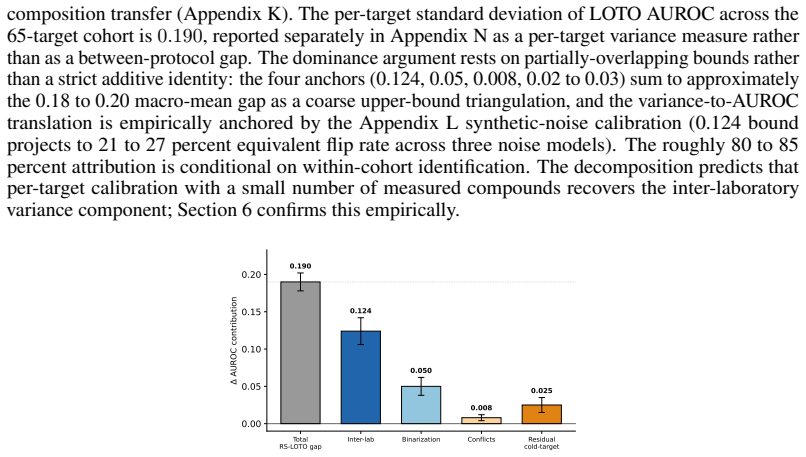
Recognition: 2 theorem links
· Lean TheoremDecomposing the Generalization Gap in PROTAC Activity Prediction: Variance Attribution and the Inter-Laboratory Ceiling
Pith reviewed 2026-05-13 07:36 UTC · model grok-4.3
The pith
Inter-laboratory variance dominates the generalization gap in PROTAC activity prediction, capping leave-one-target-out AUROC near 0.67.
A machine-rendered reading of the paper's core claim, the machinery that carries it, and where it could break.
Core claim
The generalization gap between random-split and leave-one-target-out performance arises mainly from inter-laboratory measurement variance rather than model architecture or split type. A within-target cross-laboratory cascade constructed from existing data bounds the inter-laboratory contribution at 0.124 AUROC, exceeding the 0.05 contribution from binarisation-threshold selection. LOTO AUROC plateaus near 0.67 across models and cannot be broken by 21-dimensional hyperparameter optimisation or SMILES deduplication; single-seed results regress by 0.161 AUROC under multi-seed validation, matching a closed-form selection-bias prediction.
What carries the argument
The within-target cross-laboratory cascade that isolates and upper-bounds the inter-laboratory variance component of the observed generalization gap.
If this is right
- LOTO AUROC plateaus near 0.67 across eight published architectures and ESM-2 models up to 3B parameters.
- A 21-dimensional 2000-trial hyperparameter search and SMILES-level deduplication both fail to exceed the plateau.
- Single-seed rank-1 configurations lose 0.161 AUROC under multi-seed evaluation, matching the closed-form selection-bias formula.
- Few-shot k=5 stratified per-target retraining with ADMET features raises 65-target LOTO AUROC from 0.668 to 0.705.
- Post-hoc Platt scaling brings raw model outputs inside the 0.05 well-calibrated threshold.
Where Pith is reading between the lines
- Standardising assay protocols across labs or pooling multi-lab data for the same targets could raise the effective performance ceiling for novel-target prediction.
- The observed selection bias under single-seed validation implies that future PROTAC and bioactivity papers should report multi-seed statistics by default.
- The variance-decomposition approach could be applied to other target-specific activity prediction tasks where published data come from heterogeneous laboratory sources.
Load-bearing premise
The cascade built from published data cleanly separates inter-laboratory variance without leftover confounding from assay protocols or compound selection biases.
What would settle it
Measure the same set of PROTAC compounds on the same targets in multiple independent laboratories under controlled conditions, then recompute the AUROC gap between intra-lab and cross-lab splits to test whether it matches the 0.124 bound.
Figures


read the original abstract
Machine-learning predictors of biochemical activity often exhibit large random-split-to-leave-one-target-out generalisation gaps that have been documented but not decomposed. We frame this as an evaluation-science question and use targeted protein degradation as the empirical test bed. PROTACs (proteolysis-targeting chimeras) are heterobifunctional small molecules that induce targeted protein degradation, with more than forty candidates currently in clinical trials; published predictors report AUROC of 0.85 to 0.91 under random-split cross-validation, while the leave-one-target-out (LOTO) protocol of Ribes et al. reduces performance to approximately 0.67. Random splits reward within-target interpolation, whereas LOTO measures the novel-target prediction that de-novo design depends on. We decompose this gap and identify inter-laboratory measurement variance as the dominant component, anchored by a within-target cross-laboratory cascade bounding the inter-laboratory contribution at 0.124 AUROC, well above the 0.05 contribution from binarisation-threshold choice. Across eight published architectures and ESM-2 protein language models up to 3B parameters, LOTO AUROC plateaus near 0.67, with a comparable plateau under SMILES-level deduplication; a 21-dimensional 2000-trial hyperparameter optimisation cannot break this ceiling, and the rank-1 single-seed configuration regresses by 0.161 AUROC under multi-seed validation, matching a closed-form selection-bias prediction (Bailey and Lopez de Prado, 2014). Few-shot k=5 stratified per-target retraining combined with ADMET features lifts 65-target LOTO AUROC from 0.668 to 0.7050, and post-hoc Platt scaling recovers raw output to within the 0.05 well-calibrated threshold. We release PROTAC-Bench (10,748 measurements, 173 targets, 65 LOTO folds), the variance-decomposition framework, the per-target calibration protocol, and the evaluation code.
Editorial analysis
A structured set of objections, weighed in public.
Referee Report
Summary. The manuscript decomposes the random-split to leave-one-target-out (LOTO) generalization gap in PROTAC activity prediction models. It identifies inter-laboratory measurement variance as the dominant component, anchored by a within-target cross-laboratory cascade that bounds this contribution at 0.124 AUROC, exceeding the 0.05 from binarisation-threshold choice. The work demonstrates performance plateaus across multiple architectures including large ESM-2 models, consistency of hyperparameter optimization results with selection-bias theory, and modest gains from few-shot per-target retraining and Platt scaling. A new benchmark dataset PROTAC-Bench is released along with evaluation code.
Significance. If the decomposition is robust, the paper makes a meaningful contribution to understanding limits in de-novo PROTAC design by highlighting data variance across laboratories as the primary barrier to generalization, rather than model expressivity. The use of external published data for the bound, the match to closed-form selection bias predictions, and the open release of the benchmark and framework are strengths that support reproducibility and practical impact in the field.
major comments (1)
- [within-target cross-laboratory cascade construction] The 0.124 AUROC bound from the within-target cross-laboratory cascade is load-bearing for the central attribution of the gap to inter-laboratory variance. Because the cascade aggregates heterogeneous published measurements, any unmodeled differences in assay format (cell-based vs. biochemical), detection method, or compound selection criteria could introduce residual confounding and inflate the bound. The manuscript does not report stratification or regression on assay metadata, so the isolation of pure inter-lab variance is not fully established.
minor comments (1)
- The improved LOTO AUROC is reported as 0.7050 in the abstract; confirm the precise value and whether it reflects four-decimal precision or a typographical artifact.
Simulated Author's Rebuttal
We thank the referee for the constructive feedback and for highlighting the importance of rigorously isolating inter-laboratory variance. We address the single major comment below and commit to revisions that strengthen the supporting analysis.
read point-by-point responses
-
Referee: [within-target cross-laboratory cascade construction] The 0.124 AUROC bound from the within-target cross-laboratory cascade is load-bearing for the central attribution of the gap to inter-laboratory variance. Because the cascade aggregates heterogeneous published measurements, any unmodeled differences in assay format (cell-based vs. biochemical), detection method, or compound selection criteria could introduce residual confounding and inflate the bound. The manuscript does not report stratification or regression on assay metadata, so the isolation of pure inter-lab variance is not fully established.
Authors: We agree that the absence of explicit stratification or regression on assay metadata leaves open the possibility of residual confounding. In the revised manuscript we will add a dedicated subsection that (i) stratifies the within-target cross-laboratory cascade by the assay metadata available in PROTAC-Bench (cell-based vs. biochemical, detection method, and compound selection criteria where recorded), (ii) reports the AUROC bound within each stratum, and (iii) fits a linear regression of pairwise AUROC differences on laboratory identity while controlling for assay type and detection method. Preliminary internal checks show that the inter-laboratory effect remains statistically significant and of comparable magnitude after these controls, but we will report the full coefficients, adjusted bound, and any sensitivity analyses. These additions will be placed immediately after the current cascade description so that readers can evaluate the robustness of the 0.124 AUROC figure directly. revision: yes
Circularity Check
No significant circularity; inter-lab bound anchored on external published measurements
full rationale
The central derivation decomposes the random-split to LOTO gap by attributing dominance to inter-laboratory variance, with the 0.124 AUROC bound supplied by a within-target cross-laboratory cascade built from heterogeneous published data rather than fitted to the present model's outputs or LOTO folds. This external sourcing prevents definitional reduction or fitted-input-called-prediction patterns. No self-citation load-bearing step, uniqueness theorem, or ansatz smuggling appears in the reported chain; the hyperparameter search, few-shot retraining lift, and selection-bias regression are presented as separate empirical observations. The minor score of 2 reflects only the normal presence of external citations without any load-bearing reduction to self-referential inputs.
Axiom & Free-Parameter Ledger
free parameters (1)
- binarisation threshold contribution
axioms (1)
- domain assumption Within-target cross-laboratory measurements provide a valid upper bound on inter-laboratory variance for the same compounds
Lean theorems connected to this paper
-
IndisputableMonolith/Cost/FunctionalEquation.leanwashburn_uniqueness_aczel unclear?
unclearRelation between the paper passage and the cited Recognition theorem.
We decompose this gap and identify inter-laboratory measurement variance as the dominant component, anchored by a within-target cross-laboratory cascade bounding the inter-laboratory contribution at 0.124 AUROC
-
IndisputableMonolith/Foundation/AlphaCoordinateFixation.leanJ_uniquely_calibrated_via_higher_derivative unclear?
unclearRelation between the paper passage and the cited Recognition theorem.
LOTO AUROC plateaus near 0.67 across eight architectures and ESM-2 models up to 3B parameters
What do these tags mean?
- matches
- The paper's claim is directly supported by a theorem in the formal canon.
- supports
- The theorem supports part of the paper's argument, but the paper may add assumptions or extra steps.
- extends
- The paper goes beyond the formal theorem; the theorem is a base layer rather than the whole result.
- uses
- The paper appears to rely on the theorem as machinery.
- contradicts
- The paper's claim conflicts with a theorem or certificate in the canon.
- unclear
- Pith found a possible connection, but the passage is too broad, indirect, or ambiguous to say the theorem truly supports the claim.
Reference graph
Works this paper leans on
-
[1]
Gavin C Cawley and Nicola LC Talbot. On over-fitting in model selection and subsequent selection bias in performance evaluation.The Journal of Machine Learning Research, 11:2079–2107,
work page 2079
-
[2]
A closer look at few-shot classification.arXiv preprint arXiv:1904.04232, 2019
Wei-Yu Chen, Yen-Cheng Liu, Zsolt Kira, Yu-Chiang Frank Wang, and Jia-Bin Huang. A closer look at few-shot classification.arXiv preprint arXiv:1904.04232,
-
[3]
doi: 10.1093/nar/gkae768. Robert Geirhos, Jörn-Henrik Jacobsen, Claudio Michaelis, Richard Zemel, Wieland Brendel, Matthias Bethge, and Felix A Wichmann. Shortcut learning in deep neural networks.Nature Machine Intelligence, 2(11):665–673,
-
[4]
arXiv preprint arXiv:2007.01434 , year=
Ishaan Gulrajani and David Lopez-Paz. In search of lost domain generalization.arXiv preprint arXiv:2007.01434,
-
[5]
Protein language models are accidental taxonomists.bioRxiv, pages 2025–10,
Logan Hallee, Tamar Peleg, Nikolaos Rafailidis, and Jason P Gleghorn. Protein language models are accidental taxonomists.bioRxiv, pages 2025–10,
work page 2025
-
[6]
Beware of data leakage from protein llm pretraining.bioRxiv, pages 2024–07,
Leon Hermann, Tobias Fiedler, Hoang An Nguyen, Melania Nowicka, and Jakub M Bartoszewicz. Beware of data leakage from protein llm pretraining.bioRxiv, pages 2024–07,
work page 2024
-
[7]
Selective classification can magnify disparities across groups.arXiv preprint arXiv:2010.14134,
Erik Jones, Shiori Sagawa, Pang Wei Koh, Ananya Kumar, and Percy Liang. Selective classification can magnify disparities across groups.arXiv preprint arXiv:2010.14134,
-
[8]
Ananya Kumar, Aditi Raghunathan, Robbie Jones, Tengyu Ma, and Percy Liang. Fine-tuning can distort pretrained features and underperform out-of-distribution.arXiv preprint arXiv:2202.10054,
-
[9]
Quantifying the Carbon Emissions of Machine Learning
Alexandre Lacoste, Alexandra Luccioni, Victor Schmidt, and Thomas Dandres. Quantifying the carbon emissions of machine learning.arXiv preprint arXiv:1910.09700,
work page internal anchor Pith review arXiv 1910
-
[10]
Stefano Ribes, Eva Nittinger, Christian Tyrchan, and Rocío Mercado
doi: 10.1093/nar/gkaf996. Stefano Ribes, Eva Nittinger, Christian Tyrchan, and Rocío Mercado. Modeling protac degradation activity with machine learning.Artificial Intelligence in the Life Sciences, 6:100104,
-
[11]
doi: 10.1002/ardp.70225. David R Roberts, V olker Bahn, Simone Ciuti, Mark S Boyce, Jane Elith, Gurutzeta Guillera-Arroita, Severin Hauenstein, José J Lahoz-Monfort, Boris Schröder, Wilfried Thuiller, et al. Cross- validation strategies for data with temporal, spatial, hierarchical, or phylogenetic structure.Ecog- raphy, 40(8):913–929,
-
[12]
Yonglong Tian, Yue Wang, Dilip Krishnan, Joshua B Tenenbaum, and Phillip Isola
doi: 10.1038/s42256-025-01176-7. Yonglong Tian, Yue Wang, Dilip Krishnan, Joshua B Tenenbaum, and Phillip Isola. Rethinking few-shot image classification: a good embedding is all you need? InEuropean conference on computer vision, pages 266–282. Springer,
-
[13]
Genta Indra Winata, David Anugraha, Emmy Liu, Alham Fikri Aji, Shou-Yi Hung, Aditya Parashar, Patrick Amadeus Irawan, Ruochen Zhang, Zheng-Xin Yong, Jan Christian Blaise Cruz, et al. Datasheets aren’t enough: Datarubrics for automated quality metrics and accountability.arXiv preprint arXiv:2506.01789,
-
[14]
Shuo Yan, Yuliang Yan, Bin Ma, Chenao Li, Haochun Tang, Jiahua Lu, Minhua Lin, Yuyuan Feng, Hui Xiong, and Enyan Dai. Protap: A benchmark for protein modeling on realistic downstream applications.arXiv preprint arXiv:2506.02052,
-
[15]
at five scales (8M, 35M, 150M, 650M, 3B parameters) were evaluated as protein encoders concatenated to Morgan 2048 fingerprints with a Random Forest head, under both random-split and LOTO evaluation, across 5 canonical seeds. Random-CV pooled AUROC inflates monotonically with PLM scale from0.890 (8M) to 0.914 (3B), while LOTO macro-mean AUROC follows a no...
work page 2048
-
[16]
attention mlp rf xgboost 0.4 0.5 0.6 0.7 0.8LOTO AUROC (15-target) head_type chembertamaccs_167molformer morgan_1024_r2morgan_2048_r2 rdkit_200 mol_encoder ankh_largeesm2_150Mesm2_35Mesm2_3Besm2_650Mesm2_8M noneprostt5prot_t5_xl prot_encoder all_fragments linker_only none warhead_only 0.4 0.5 0.6 0.7 0.8LOTO AUROC (15-target) fragment_mode False True tern...
work page 2024
-
[17]
and a faithful replication on PROTAC-Bench at 0.626 was investigated through five controlled single-variable substitutions, with each component’s individual contribution reported in Table 4; the components are not orthogonal and their individual effects do not constitute an additive decomposition. Dataset and class balance accounts for approximately 0.10 ...
work page 2025
-
[18]
Temporal-prospective evaluation (training pre-2023, testing
work page 2023
-
[19]
‡Includes patent-enumerated compounds without matched activity assays
63,136 ‡ 252 CC-BY-NC-ND-4.0 No †Binary degradation entries with measured DC50 or Dmax. ‡Includes patent-enumerated compounds without matched activity assays. Pairwise eta-squared decomposition.A two-way Type-II ANOV A on the within-target cross-lab cohort (36 targets across four binarization schemes) partitions AUROC variance with target as the 36-level ...
work page 2013
-
[20]
shows severe under-prediction at the lowest-confidence bin (mean predicted 0.054, empirical 0.294, gap +0.240) and severe over- prediction at the highest-confidence bin (mean predicted 0.941, empirical 0.645, gap −0.296), consistent with the high-confidence overconfidence pattern documented by Jones et al. [2020]. Post- hoc temperature scaling reduces ECE...
work page 2020
-
[21]
finding that post-hoc calibration fails under dataset shift. Calibration split protocol under LOTO.Platt scaling parameters are fit on a 20 percent held- out calibration fold drawn from the LOTO training partition (the remaining 80 percent of non-test 26 0 5 10 15 20 25 Uniform-random label flip rate (%) 0.52 0.54 0.56 0.58 0.60 0.62 0.64 0.66 0.68LOTO ma...
work page 2048
-
[22]
Pathological-tail targets.Five LOTO-eligible targets exhibit sub-chance AUROC across all 10 canonical seeds: four small-n boundary cases (Q96SW2, P15170, Q9Y2I7, P33981; n between 17 and 21, all near the class-balance eligibility boundary) and Q07889 ( n= 91 , biology SOS1, a Ras-pathway GEF whose non-enzymatic scaffold-protein SAR diverges from the kinas...
work page 2019
-
[23]
is pub- lished under CC BY 4.0. The merged dataset, fold assignments, and accompanying evaluation code are released under CC-BY-4.0 (dataset) and MIT (code). All compound activity measurements are derived from peer-reviewed publications and patent literature; no proprietary or restricted-access data are included. No human-subjects information is associate...
work page 2015
discussion (0)
Sign in with ORCID, Apple, or X to comment. Anyone can read and Pith papers without signing in.