Recognition: 2 theorem links
· Lean TheoremUncovering Local Heterogeneity: Local Summary Characteristics for Spatial Point Processes with Composition-Valued Marks
Pith reviewed 2026-05-13 05:42 UTC · model grok-4.3
The pith
Local indicators of mark association using centered log-ratio transformations detect localized clusters in composition-valued spatial point processes more accurately than global statistics.
A machine-rendered reading of the paper's core claim, the machinery that carries it, and where it could break.
Core claim
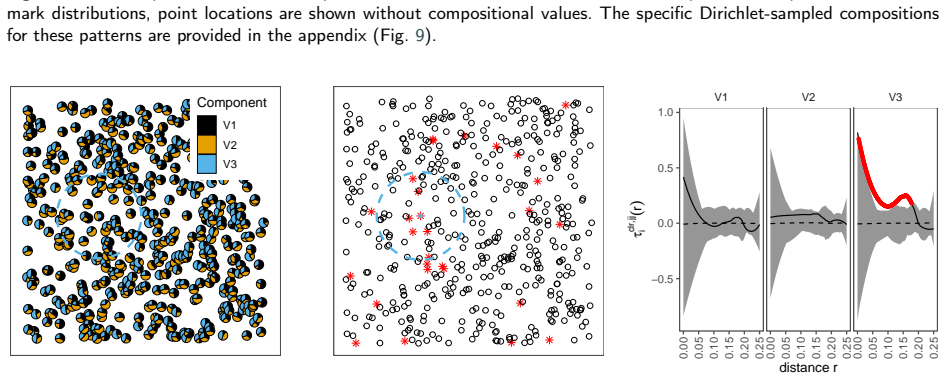
By projecting composition-valued marks into Euclidean space via the centered log-ratio transformation, the proposed LIMA functions enable the pointwise decomposition of mark association measures, thereby uncovering local spatial heterogeneity in marked point patterns that is averaged out in traditional global summaries.
What carries the argument
The clr-based LIMA functions, which are local versions of mark association measures obtained by applying centered log-ratio transformations to composition marks and computing point-specific associations.
If this is right
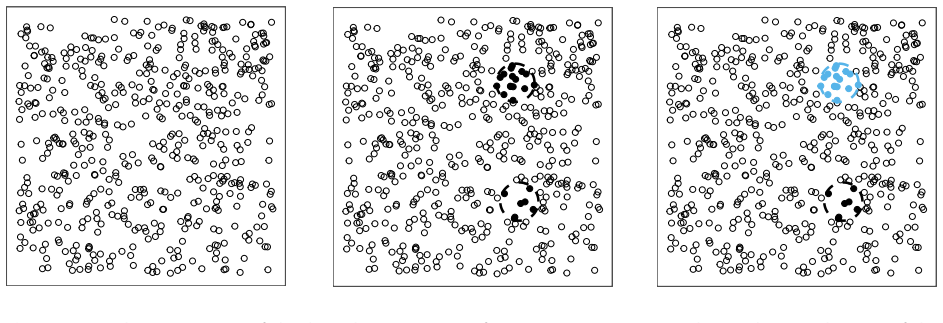
- Local LIMA functions can identify point-specific mark clusters in non-stationary spatial patterns.
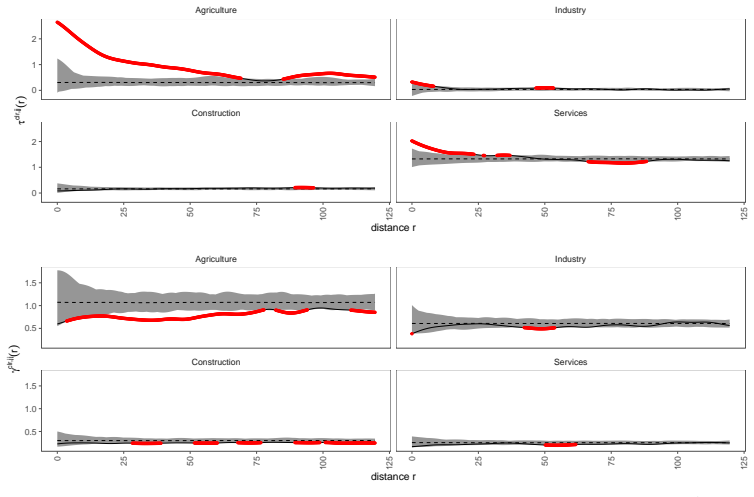
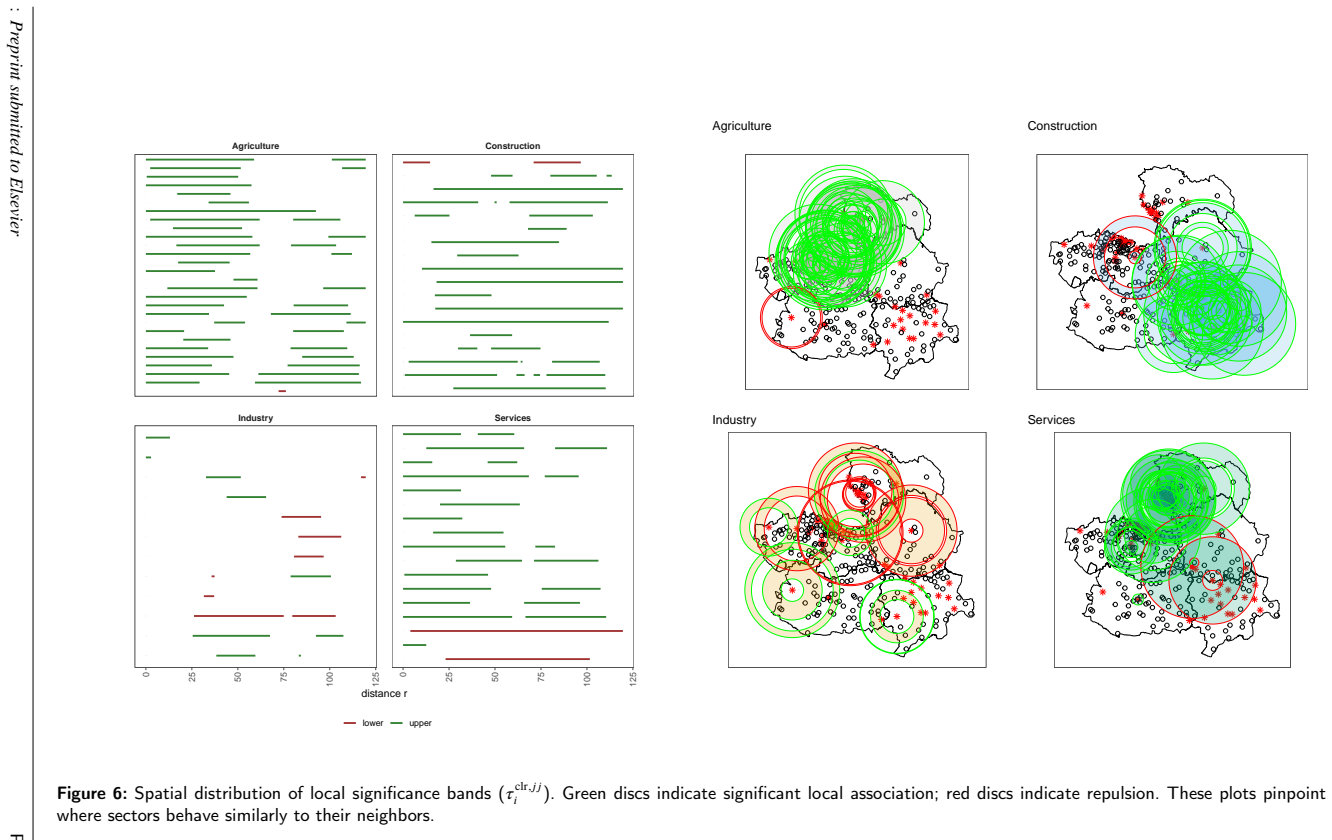
- The approach supplies granular regional insights, such as localized economic drainage effects, that global metrics miss.
- The framework serves as a diagnostic tool for high-dimensional marked point processes with constrained marks.
- Simulation results establish consistently higher cluster detection rates for the local clr-based versions.
Where Pith is reading between the lines
- The same local decomposition technique could be adapted to other constrained mark types, such as directional or positive data.
- Extending LIMA to spatio-temporal point processes would allow tracking of evolving local associations.
- Integrating these local measures with spatial clustering algorithms could automate detection of heterogeneous subregions.
Load-bearing premise
The centered log-ratio transformation faithfully preserves the relevant spatial dependencies among the original constrained composition marks without introducing geometric artifacts or information loss.
What would settle it
A controlled simulation containing known local composition clusters in which the clr-based LIMA functions show detection accuracy no higher than global summaries would falsify the claimed superiority.
Figures


read the original abstract
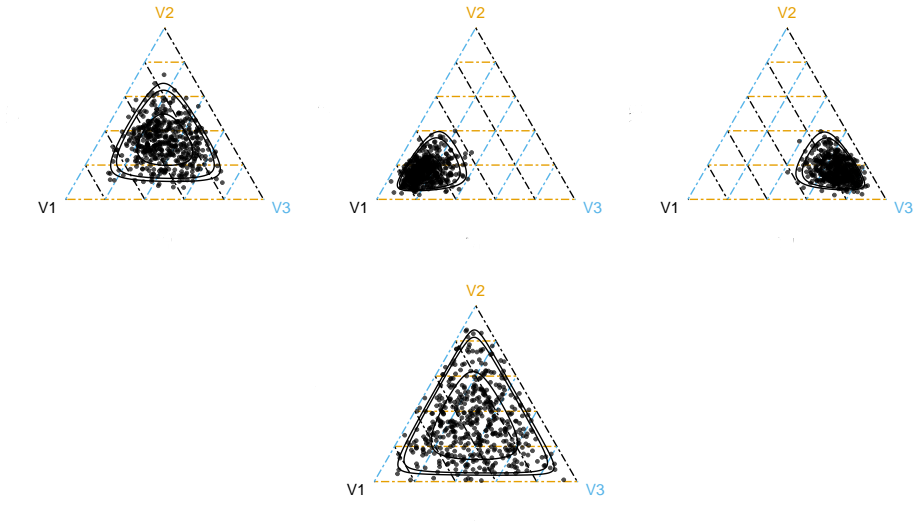
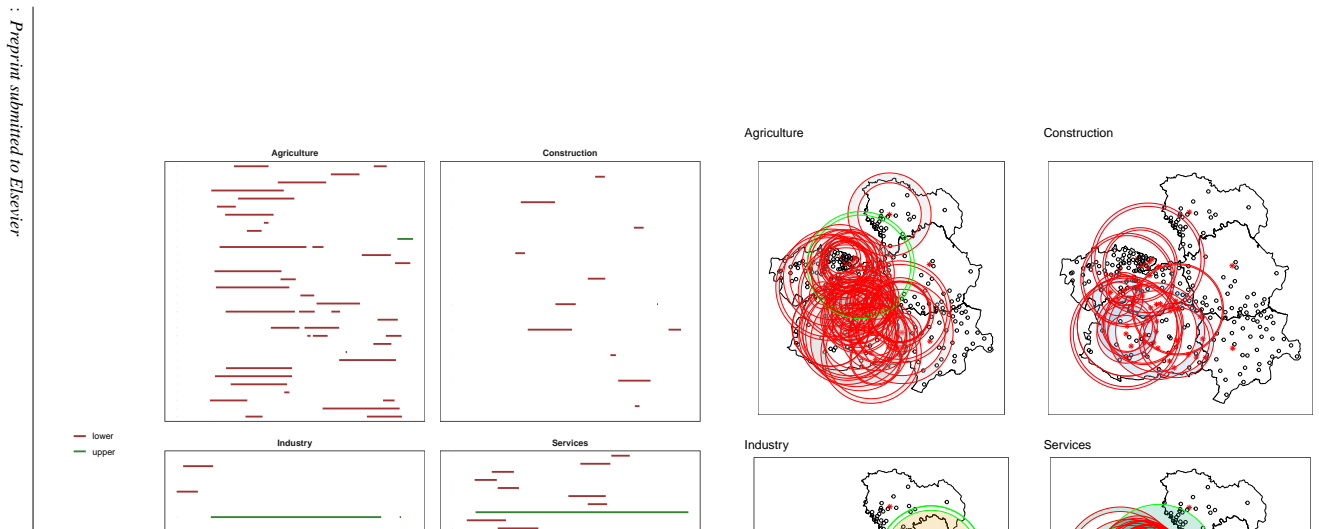
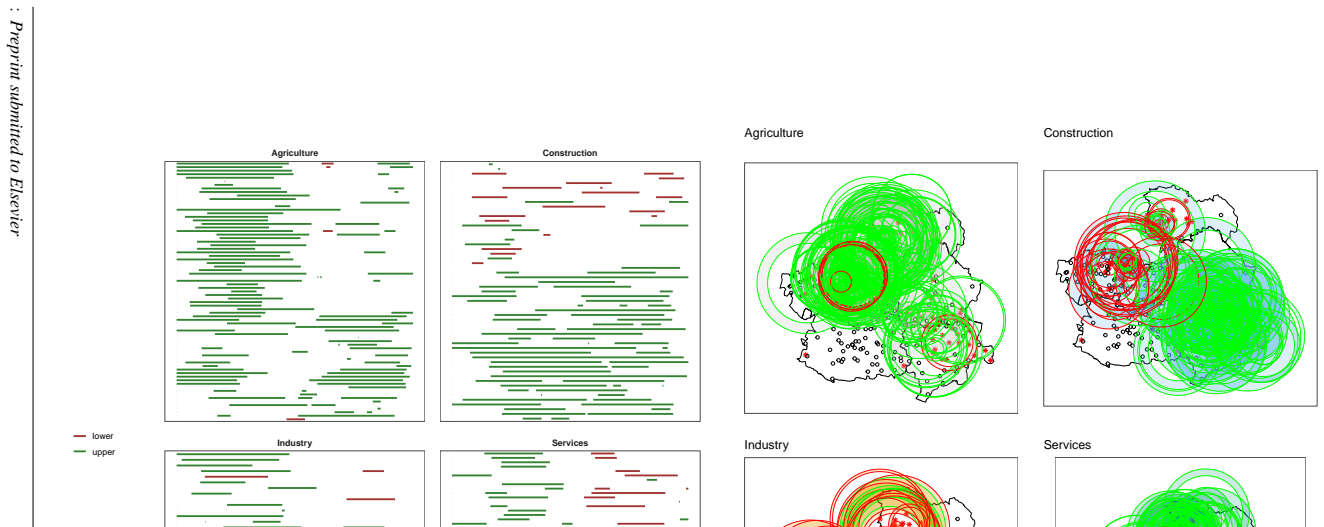
Traditional analysis of marked spatial point processes often relies on global summary statistics, which tend to obscure local spatial heterogeneity by averaging dependencies across the entire observation window. To overcome this limitation, this paper introduces a framework for Local Indicators of Mark Association (LIMA) specifically designed for composition-valued marks. Such marks, characterized by their non-negative components and sum-to-constant constraint, require a specialized treatment within the Aitchison geometry. By employing log-ratio transformations, we project these constrained marks into a Euclidean space, enabling the point-specific decomposition of global mark characteristics. The efficacy of the proposed clr-based LIMA functions is validated through extensive simulation studies. The results demonstrate a superior capacity to detect localized mark clusters, achieving detection accuracies consistently higher than their global counterparts. The practical utility of this framework is demonstrated using an empirical dataset of economic sector compositions in Castile-La Mancha, Spain. The analysis uncovers latent economic clustering patterns and localized \textit{drainage} effects that are invisible to global metrics, providing granular insights into regional spatial dynamics. Our findings suggest that the extended LIMA framework serves as a vital diagnostic tool for high-dimensional, non-stationary marked point patterns.
Editorial analysis
A structured set of objections, weighed in public.
Referee Report
Summary. The manuscript introduces Local Indicators of Mark Association (LIMA) for spatial point processes with composition-valued marks. It applies the centered log-ratio (clr) transformation to project the constrained marks into Euclidean space, then decomposes standard global mark-association summaries (such as cross-type K-functions or pair-correlation functions) into pointwise local versions. The framework is validated in simulation studies that report higher detection accuracy for localized mark clusters relative to global counterparts, and is demonstrated on an empirical dataset of economic sector compositions in Castile-La Mancha, Spain, where it identifies local clustering and drainage effects not visible globally.
Significance. If the simulation results hold under the reported conditions, the work supplies a practical, geometry-aware extension of existing marked-point-process tools to the compositional setting. This addresses a genuine gap in the analysis of non-stationary patterns with proportional marks, which arise in economics, ecology, and geology. The provision of both simulation benchmarks and a real-data illustration strengthens the case for adoption as a diagnostic tool.
major comments (2)
- [§3.2] §3.2 (Definition of clr-based LIMA): the pointwise decomposition of the global summary is presented as a direct consequence of the clr isometry, yet the manuscript does not state whether the local functions remain unbiased estimators of the underlying intensity when the mark composition varies spatially; a short derivation or reference to the corresponding global unbiasedness result would clarify this.
- [§4] §4 (Simulation studies): the reported detection accuracies are described as “consistently higher,” but the text supplies neither the number of Monte Carlo replicates, the precise point-process models used to generate the clustered compositions, nor standard-error bands on the accuracy figures; without these, the quantitative superiority claim cannot be fully assessed.
minor comments (2)
- The notation for the local LIMA functions occasionally re-uses symbols already defined for their global counterparts; a distinct subscript (e.g., LIMA_loc) would reduce ambiguity.
- Figure 3 (empirical maps) would benefit from an inset showing the global summary for direct visual comparison.
Simulated Author's Rebuttal
We thank the referee for the constructive comments and the recommendation of minor revision. We address each major comment below.
read point-by-point responses
-
Referee: [§3.2] §3.2 (Definition of clr-based LIMA): the pointwise decomposition of the global summary is presented as a direct consequence of the clr isometry, yet the manuscript does not state whether the local functions remain unbiased estimators of the underlying intensity when the mark composition varies spatially; a short derivation or reference to the corresponding global unbiasedness result would clarify this.
Authors: We agree that a clarification is useful. The clr map is a linear isometry, so the unbiasedness property of the global mark-association estimators carries over to the local LIMA functions. When the mark composition varies spatially, the local versions remain unbiased for the spatially varying intensity under the usual local-homogeneity approximation within the kernel support. We will insert a short derivation in the revised §3.2 that references the corresponding global unbiasedness result. revision: yes
-
Referee: [§4] §4 (Simulation studies): the reported detection accuracies are described as “consistently higher,” but the text supplies neither the number of Monte Carlo replicates, the precise point-process models used to generate the clustered compositions, nor standard-error bands on the accuracy figures; without these, the quantitative superiority claim cannot be fully assessed.
Authors: We thank the referee for noting these omissions. The simulation details—including the number of Monte Carlo replicates, the exact point-process models used to generate the clustered compositions, and standard-error bands on the accuracy figures—will be supplied in the revised §4 so that the quantitative claims can be fully assessed. revision: yes
Circularity Check
No significant circularity in derivation chain
full rationale
The paper presents LIMA functions as a direct pointwise decomposition of global mark-association summaries after applying the standard centered log-ratio (clr) transformation to map composition marks into Euclidean space. This construction follows immediately from the accepted Aitchison geometry and existing global summaries; no equation reduces a claimed prediction or result to a fitted parameter, self-definition, or load-bearing self-citation. Simulations and the empirical example serve as external validation rather than internal tautologies. The derivation chain remains self-contained against the cited standard transformations.
Axiom & Free-Parameter Ledger
axioms (1)
- domain assumption Composition-valued marks can be projected into Euclidean space via centered log-ratio transformations without distorting spatial association structure.
invented entities (1)
-
Local Indicators of Mark Association (LIMA) for composition marks
no independent evidence
Lean theorems connected to this paper
-
IndisputableMonolith/Cost/FunctionalEquation.leanwashburn_uniqueness_aczel unclearBy employing log-ratio transformations, we project these constrained marks into a Euclidean space, enabling the point-specific decomposition of global mark characteristics.
-
IndisputableMonolith/Foundation/AlexanderDuality.leanalexander_duality_circle_linking unclearthe clr-based LIMA functions demonstrate a superior capacity to detect localized mark clusters
Reference graph
Works this paper leans on
-
[1]
and Pietrostefani, Elisabetta , year = 2019, journal =
Ahlfeldt, Gabriel M. and Pietrostefani, Elisabetta , year = 2019, journal =. The
work page 2019
-
[2]
Aitchison, John , year = 2003, pages =. A. Compositional
work page 2003
- [3]
-
[4]
Aitchison, J. , year = 1986, series =. The. doi:10.1007/978-94-009-4109-0 , langid =
-
[5]
Anselin, Luc , year = 1995, month = apr, journal =. Local. doi:10.1111/j.1538-4632.1995.tb00338.x , urldate =
-
[6]
Audretsch, David B. and Feldman, Maryann P. , year = 1996, journal =. R&
work page 1996
-
[7]
A. Compositional. doi:10.1002/9781119976462.ch1 , urldate =
-
[8]
Handbook of Spatial Statistics , author =
Multivariate and. Handbook of Spatial Statistics , author =. doi:10.1201/9781420072884 , langid =
-
[9]
Baddeley, A. J. and Moller, J. and Waagepetersen, R. , year = 2000, month = nov, journal =. Non- and. doi:10.1111/1467-9574.00144 , urldate =
-
[10]
Baddeley, Adrian and Rubak, Ege and Turner, Rolf , year = 2016, publisher =. Spatial. doi:10.1201/b19708 , langid =
- [11]
-
[12]
and Hardegen, Andrew and Lawrence, Thomas and Milne, Robin K
Baddeley, Adrian and Diggle, Peter J. and Hardegen, Andrew and Lawrence, Thomas and Milne, Robin K. and Nair, Gopalan , year = 2014, month = aug, journal =. On. doi:10.1890/13-2042.1 , urldate =
-
[13]
Barnard, George A , year = 1963, journal =. Discussion on. doi:10.1111/j.2517-6161.1963.tb00509.x , urldate =
-
[14]
Besag, Julian and Diggle, Peter J. , year = 1977, journal =. Simple. doi:10.2307/2346974 , urldate =
-
[15]
Bivand, Roger S. and Pebesma, Edzer and. Applied. doi:10.1007/978-1-4614-7618-4 , urldate =
- [16]
- [17]
-
[18]
Campbell, N , year = 1909, journal =. The
work page 1909
-
[19]
Capasso, Vincenzo and Bakstein, David , year = 2021, series =. An. doi:10.1007/978-3-030-69653-5 , urldate =
-
[20]
Chiu, Sung Nok and Stoyan, Dietrich and Kendall, Wilfrid S and Mecke, Joseph , year = 2013, publisher =. Stochastic. doi:10.1002/9781118658222 , langid =
-
[21]
Coeurjolly, Jean-Fran. A. International Statistical Review , volume =. doi:10.1111/insr.12205 , urldate =
-
[22]
Cressie, Noel and Collins, Linda Brant , year = 2001, month = mar, journal =. Analysis of. doi:10.1198/108571101300325292 , urldate =
-
[23]
Cressie, Noel and Collins, Linda Brant , year = 2001, month = aug, journal =. Patterns in. doi:10.1002/nav.1022 , urldate =
- [24]
-
[25]
Cronie, Ottmar and Jansson, Julia and Konstantinou, Konstantinos , year = 2024, month = jun, journal =. Discussion of the. doi:10.1007/s13253-024-00606-0 , urldate =
-
[26]
Cronie, Ottmar and Moradi, Mehdi and Mateu, Jorge , year = 2020, month = sep, journal =. Inhomogeneous. doi:10.1007/s11222-020-09942-w , urldate =
-
[27]
Daley, Daryl J. and. An
-
[28]
Daley, Daryl J. and. An. doi:10.1007/978-0-387-49835-5 , langid =
-
[29]
Descombes, X. and Zerubia, J. , year = 2002, month = sep, journal =. Marked. doi:10.1109/MSP.2002.1028354 , urldate =
-
[30]
Journal of Agricultural, Biological and Environmental Statistics , year=
Eckardt, Matthias and Moradi, Mehdi , title=. Journal of Agricultural, Biological and Environmental Statistics , year=
-
[31]
International Statistical Review , volume =
Eckardt, Matthias and Comas, Carles and Mateu, Jorge , title =. International Statistical Review , volume =. 2025 , doi =
work page 2025
-
[32]
Second-Order Characteristics for Spatial Point Processes with Graph-Valued Marks , author=. 2024 , eprint=
work page 2024
- [33]
- [34]
-
[35]
Ghorbani, Mohammad and Cronie, Ottmar and Mateu, Jorge and Yu, Jun , title=. 2021 , pages=. doi:10.1007/s11749-020-00730-2 , journal=
-
[36]
Journal of Agricultural, Biological and Environmental Statistics , year=
Eckardt, Matthias and Moradi, Mehdi , title=. Journal of Agricultural, Biological and Environmental Statistics , year=. doi:10.1007/s13253-024-00613-1 , url=
-
[37]
Diggle, Peter J. , year = 1979, journal =. On. doi:10.2307/2529938 , urldate =
-
[38]
and Moraga, Paula and Rowlingson, Barry and Taylor, Benjamin M
Diggle, Peter J. and Moraga, Paula and Rowlingson, Barry and Taylor, Benjamin M. , year = 2013, journal =. Spatial and. doi:10.1214/13-STS441 , urldate =
-
[39]
, year = 2013, month = jul, edition =
Diggle, Peter J. , year = 2013, month = jul, edition =. Statistical. doi:10.1201/b15326 , urldate =
-
[40]
Dudley, R M and Bollobas, B and Fulton, W and Katok, A and Kirwan, F and Sarnak, P , year = 2002, publisher =. Real. doi:10.1017/CBO9780511755347 , langid =
-
[41]
Duranton, Gilles and Puga, Diego , editor =. Micro-. Handbook of. doi:10.1016/S1574-0080(04)80005-1 , urldate =
- [42]
-
[43]
Journal of Computational and Graphical Statistics , number=
Local Indicators of Mark Association for Marked Spatial Point Processes , author=. Journal of Computational and Graphical Statistics , number=. 2026 , publisher=
work page 2026
-
[44]
International Statistical Review , year =
On Spatial Point Processes with Composition-Valued Marks , author =. International Statistical Review , year =
-
[45]
Egozcue, Juan Jos. Basic. Compositional. doi:10.1002/9781119976462.ch2 , collaborator =
-
[46]
Egozcue, J J and. Isometric. Mathematical geology , volume =. doi:10.1023/A:1023818214614 , langid =
-
[47]
Getis, Arthur and Ord, J. K. , year = 1992, month = jul, journal =. The. doi:10.1111/j.1538-4632.1992.tb00261.x , urldate =
-
[48]
Getis, A , year = 1984, month = feb, journal =. Interaction. doi:10.1068/a160173 , urldate =
-
[49]
Getis, Arthur , year = 1987, journal =. Second-
work page 1987
-
[50]
, year = 1971, month = sep, journal =
Glass, Leon and Tobler, Waldo R. , year = 1971, month = sep, journal =. General:. doi:10.1038/233067a0 , urldate =
-
[51]
Afiliacion a uttimo dia de mes por sectores econ
-
[52]
Descargas de Datos Geogr
-
[53]
Greenacre, Michael , year = 2021, month = mar, journal =. Compositional. doi:10.1146/annurev-statistics-042720-124436 , urldate =
-
[54]
Hartmann, K and Krois, J and Rudolph, A , year = 2023, journal =. Statistics and
work page 2023
- [55]
- [56]
-
[57]
Illian, Janine and Penttinen, Antti and Stoyan, Helga and Stoyan, Dietrich , year = 2008, publisher =. Statistical
work page 2008
-
[58]
Isham, Valerie , year = 1985, publisher =. Marked. Spatial Processes and Spatial Time Series Analysis : Proceedings of the 6th
work page 1985
-
[59]
Kallenberg, Olav , year = 2017, series =. Random. doi:10.1007/978-3-319-41598-7 , urldate =
-
[60]
Karlin, Samuel and Taylor, Howard M. , year = 2008, edition =. A
work page 2008
-
[61]
Compositional Data Analysis , author =
The. Compositional Data Analysis , author =. 2011 , pages =. doi:10.1002/9781119976462.ch3 , langid =
-
[62]
Mohler, George , year = 2014, month = jul, journal =. Marked. doi:10.1016/j.ijforecast.2014.01.004 , urldate =
-
[63]
Moradi, Mehdi and Eckardt, Matthias , year = 2025, month = may, journal =. Inhomogeneous. arXiv , langid =:2505.24501 , primaryclass =
-
[64]
Moran, P A P , year = 1950, journal =. Notes on. doi:10.2307/2332142 , langid =
-
[65]
Mrkvicka, Tomas and Myllym. New. Statistics in Medicine , volume =. doi:10.1002/sim.9236 , urldate =
-
[66]
Journal of Statistical Software , volume =
Myllym. Journal of Statistical Software , volume =. doi:10.18637/jss.v111.i03 , urldate =
-
[67]
Myllym. Global. Journal of the Royal Statistical Society Series B: Statistical Methodology , volume =. doi:10.1111/rssb.12172 , urldate =
-
[68]
Ogira, Carol and Kamau, Roselynn and Kamau, Shallom and Bwoma, Bridgette Kerubo and Komora, Bonaya Kiinywi and Athiany, Henry , year = 2024, month = feb, journal =. Predicting. doi:10.11648/ijdsa.20241001.11 , urldate =
-
[69]
, year = 1983, month = jan, journal =
Ohser, J. , year = 1983, month = jan, journal =. On. doi:10.1080/02331888308801687 , urldate =
-
[70]
Pearson, Karl , year = 1897, month = dec, journal =. Mathematical. doi:10.1098/rspl.1896.0076 , urldate =
-
[71]
Pebesma, Edzer and Bivand, Roger and Racine, Etienne and Sumner, Michael and Cook, Ian and Keitt, Tim and Lovelace, Robin and Wickham, Hadley and Ooms, Jeroen and M. Sf:
- [72]
-
[73]
, year = 1992, month = nov, journal =
Penttinen, Antti and Stoyan, Dietrich and Henttonen, Helena M. , year = 1992, month = nov, journal =. Marked. doi:10.1093/forestscience/38.4.806 , urldate =
-
[74]
Platt, William J. and Evans, Gregory W. and Rathbun, Stephen L. , year = 1988, journal =. The
work page 1988
-
[75]
Reinhart, Alex , year = 2018, month = aug, journal =. A. doi:10.1214/17-STS629 , urldate =
-
[76]
Ripley, B. D. , year = 1977, month = jan, journal =. Modelling. doi:10.1111/j.2517-6161.1977.tb01615.x , urldate =
-
[77]
Ripley, B.D. , year = 1976, journal =. The. doi:10.2307/3212829 , langid =
-
[78]
Schlather, Martin and Ribeiro, Paulo J. and Diggle, Peter J. , year = 2004, journal =. Detecting
work page 2004
-
[79]
Schlather, Martin , year = 2001, month = feb, journal =. On the. doi:10.2307/3318604 , urldate =
-
[80]
Shimatani, Kenichiro , year = 2002, month = apr, journal =. Point. doi:10.1002/1521-4036(200204)44:3<325::AID-BIMJ325>3.0.CO;2-B , urldate =
discussion (0)
Sign in with ORCID, Apple, or X to comment. Anyone can read and Pith papers without signing in.