Recognition: 1 theorem link
· Lean TheoremAdvancing Dynamic Ride-Pooling Simulation -- A Highly Scalable Dispatcher
Pith reviewed 2026-05-13 04:46 UTC · model grok-4.3
The pith
Mt-KaRRi processes millions of ride-pooling requests per hour with response times around 1 millisecond.
A machine-rendered reading of the paper's core claim, the machinery that carries it, and where it could break.
Core claim
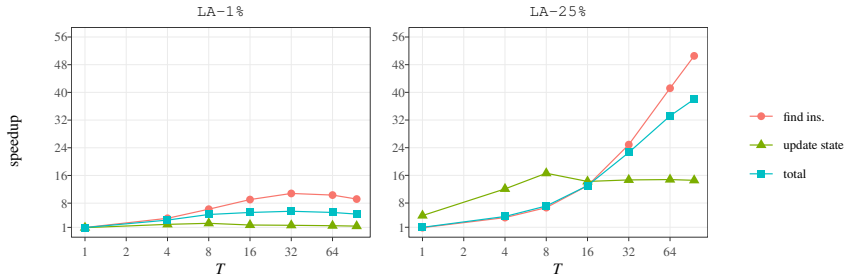
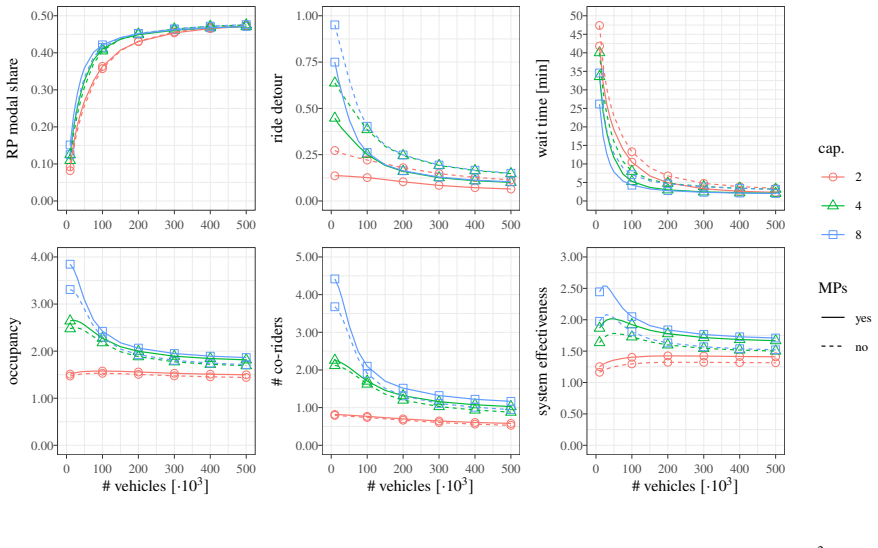
Mt-KaRRi is a novel dispatcher for dynamic ride-pooling that leverages state-of-the-art shortest-path algorithms to process millions of travelers per hour while achieving a response time per request of around 1ms, even in the largest instances, enabling ride-pooling studies at unprecedented scale with tens of thousands of vehicles.
What carries the argument
Mt-KaRRi, the dispatcher that combines state-of-the-art shortest-path algorithms with a simple mode choice model to dynamically assign and route pooled rides.
If this is right
- Quality of rides and vehicle resource usage can be analyzed for very large fleets and traveler volumes.
- Simulations of ride-pooling in entire cities become practical with realistic demand data.
- Future studies can explore how ride-pooling performs under different conditions at scales matching real-world operations.
Where Pith is reading between the lines
- Such a scalable tool could support planning for autonomous vehicle fleets in mobility-on-demand services.
- Researchers might use it to test the impact of varying mode choice behaviors on overall system efficiency.
- Integration with real-time data could further enhance its applicability to live operations.
Load-bearing premise
That the shortest-path based matching combined with a simple mode choice model produces outcomes for ride quality and vehicle utilization that match real-world behavior in the tested urban areas.
What would settle it
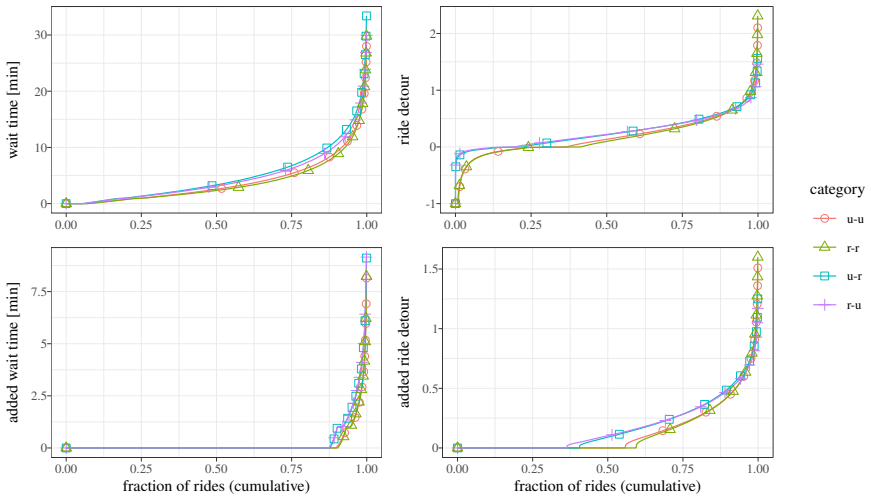
Comparing the simulated average passenger wait times, ride durations, and vehicle occupancies against data from an actual ride-pooling service operating in one of the studied cities.
Figures


read the original abstract
In ride-pooling, a fleet of vehicles is dynamically dispatched to bring travelers from A to B, trying to pool riders with similar itineraries to improve the use of resources compared to taxis or private cars. Ride-pooling is considered a core building block of future transport systems with autonomous vehicles. In this paper, we introduce Mt-KaRRi, a novel dispatcher for dynamic ride-pooling that leverages state-of-the-art shortest-path algorithms to process millions of travelers per hour. We add a simple mode choice model and use realistic travel demand in three different urban areas for extensive experiments. We find that our dispatcher scales well with a response time per request of around 1ms even for our largest instances. We show how this scalability can be used to conduct ride-pooling studies at unprecedented scale. For instance, we determine how the quality of rides and usage of vehicle resources develop for tens of thousands of vehicles and millions of travelers. We envision Mt-KaRRi as a tool for future ride-pooling simulation studies at scale.
Editorial analysis
A structured set of objections, weighed in public.
Referee Report
Summary. The paper introduces Mt-KaRRi, a novel dispatcher for dynamic ride-pooling that leverages state-of-the-art shortest-path algorithms to process millions of travelers per hour. It incorporates a simple mode choice model and evaluates the approach on realistic travel demand data from three urban areas, reporting response times of around 1 ms per request even on the largest instances with tens of thousands of vehicles. The work demonstrates how this scalability enables ride-pooling studies at unprecedented scale, including analyses of ride quality and vehicle resource utilization for millions of travelers.
Significance. If the reported timings and scalability hold under end-to-end online conditions, the contribution is significant for the field of transportation simulation. It supplies a practical, high-performance tool that makes previously intractable large-scale ride-pooling experiments feasible, directly supporting research on autonomous-vehicle-based mobility systems. The use of multiple real-world demand datasets and the focus on online dynamic dispatching are positive aspects that increase the potential impact.
minor comments (3)
- [Results / Experiments] The abstract and results sections state the ~1 ms response time without accompanying variance, standard deviation, or per-component timing breakdown (shortest-path queries versus matching and assignment); adding these would strengthen verification of the end-to-end claim.
- [Methods] The simple mode choice model is introduced without explicit pseudocode or parameter values; a short algorithmic description or table of parameters would improve reproducibility.
- [Figures] Figure captions and legends for the large-scale utilization and ride-quality plots should explicitly state the demand dataset and fleet size corresponding to each curve to avoid ambiguity when comparing across the three urban areas.
Simulated Author's Rebuttal
We thank the referee for the positive summary, recognition of significance, and recommendation for minor revision. We are pleased that the scalability of Mt-KaRRi and its potential to enable large-scale ride-pooling studies are viewed favorably.
Circularity Check
No significant circularity detected
full rationale
The paper introduces an algorithmic dispatcher (Mt-KaRRi) for dynamic ride-pooling and evaluates its scalability through direct empirical timing measurements on external urban travel demand datasets. The core claims rest on measured per-request response times (~1 ms) and instance sizes using standard shortest-path primitives plus a simple mode-choice model, rather than any derivation that reduces to fitted parameters, self-defined outputs, or load-bearing self-citations. No equations, uniqueness theorems, or ansatzes are presented that would create a self-referential loop; the performance results are falsifiable against the chosen datasets and algorithms.
Axiom & Free-Parameter Ledger
Reference graph
Works this paper leans on
-
[1]
A Note on Two Problems in Connexion with Graphs , volume =
Edsger W Dijkstra , journal =. A Note on Two Problems in Connexion with Graphs , volume =
-
[2]
Exact Routing in Large Road Networks using Contraction Hierarchies , volume =
Robert Geisberger and Peter Sanders and Dominik Schultes and Christian Vetter , doi =. Exact Routing in Large Road Networks using Contraction Hierarchies , volume =. INFORMS Transportation Science , publisher =
-
[3]
Workshop on Algorithm Engineering and Experiments (ALENEX) , title =
Sebastian Knopp and Peter Sanders and Dominik Schultes and Frank Schulz and Dorothea Wagner , doi =. Workshop on Algorithm Engineering and Experiments (ALENEX) , title =
-
[4]
Customizable Contraction Hierarchies , volume =
Julian Dibbelt and Ben Strasser and Dorothea Wagner , doi =. Customizable Contraction Hierarchies , volume =. ACM Journal of Experimental Algorithmics , pages =
-
[5]
INFORMS Transportation Science , publisher =
Moritz Baum and Valentin Buchhold and Jonas Sauer and Dorothea Wagner and Tobias Zündorf , doi =. INFORMS Transportation Science , publisher =
-
[6]
Fast, Exact and Scalable Dynamic Ridesharing , year =
Valentin Buchhold and Peter Sanders and Dorothea Wagner , city =. Fast, Exact and Scalable Dynamic Ridesharing , year =. Workshop on Algorithm Engineering and Experiments (ALENEX) , pages =. doi:10.1137/1.9781611976472.8 , isbn =
-
[7]
Symposium on Algorithm Engineering and Experiments (ALENEX) , chapter =
Moritz Laupichler and Peter Sanders , title =. Symposium on Algorithm Engineering and Experiments (ALENEX) , chapter =. 2024 , doi =
work page 2024
-
[8]
Communications of the ACM , month = sep, pages =
Bentley, Jon Louis , title =. Communications of the ACM , month = sep, pages =. 1975 , issue_date =. doi:10.1145/361002.361007 , abstract =
- [9]
-
[10]
Comfortable and maximum walking speed of adults aged 20—79 years: reference values and determinants , author=. Age and Ageing , volume=. 1997 , publisher=
work page 1997
-
[11]
Nobis, Claudia and Kuhnimhof, Tobias , year=
-
[12]
Frontiers in Econometrics , editor =
McFadden, Daniel , title =. Frontiers in Econometrics , editor =. 1974 , pages =
work page 1974
-
[13]
Discrete Choice Methods with Simulation , year =
-
[14]
Discrete choice analysis: theory and application to travel demand , author =. 1985 , publisher =
work page 1985
-
[15]
Belz, Janina and B. 2025 , title =. doi:10.71786/dlr.vf-9hvj-sh11 , url =
-
[16]
Passenger Mobility Statistics - Report on Surveys , institution =. 2018 , url =
work page 2018
-
[17]
Breitling, Johannes and Laupichler, Moritz , title =. Symposium on Algorithmic Approaches for Transportation Modelling, Optimization, and Systems (ATMOS) , pages =. 2025 , publisher =
work page 2025
- [18]
-
[19]
Three revolutions in urban transportation: How to achieve the full potential of vehicle electrification, automation, and shared mobility in urban transportation systems around the world by 2050 , author=. 2017 , url =
work page 2050
-
[20]
On the energy intensity of road transport in the presence of Connected and Automated Mobility , type =. 2025 , author =
work page 2025
- [21]
-
[22]
Harilaos N. Psaraftis , doi =. A Dynamic Programming Solution to the Single Vehicle Many-to-Many Immediate Request Dial-a-Ride Problem , volume =. Transportation Science , pages =
-
[23]
Jang-Jei Jaw and Amedeo R. Odoni and Harilaos N. Psaraftis and Nigel H.M. Wilson , doi =. A Heuristic Algorithm for the Multi-Vehicle Advance Request Dial-a-Ride Problem with Time Windows , volume =. Transportation Research Part B: Methodological , pages =
-
[24]
Oli B. G. Madsen and Hans F. Ravn and Jens Moberg Rygaard , doi =. A Heuristic Algorithm for a Dial-a-Ride Problem with Time Windows, Multiple Capacities, and Multiple Objectives , volume =. Annals of Operations Research , keywords =
-
[25]
Mark E.T. Horn , doi =. Fleet Scheduling and Dispatching for Demand-Responsive Passenger Services , volume =. Transportation Research Part C: Emerging Technologies , keywords =
-
[26]
Efficient Feasibility Testing for Dial-a-Ride Problems , volume =
Brady Hunsaker and Martin Savelsbergh , doi =. Efficient Feasibility Testing for Dial-a-Ride Problems , volume =. Operations Research Letters , pages =
-
[27]
Häll and Magdalena Högberg and Jan T
Carl H. Häll and Magdalena Högberg and Jan T. Lundgren , doi =. A Modeling System for Simulation of Dial-a-Ride Services , volume =. Public Transport , keywords =
-
[28]
IEEE Transactions on Big Data , pages =
Masayo Ota and Huy Vo and Claudio Silva and Juliana Freire , doi =. IEEE Transactions on Big Data , pages =
-
[29]
Dynamic stop pooling for flexible and sustainable ride sharing , volume =
Charlotte Lotze and Philip Marszal and Malte Schröder and Marc Timme , doi =. Dynamic stop pooling for flexible and sustainable ride sharing , volume =. New Journal of Physics , pages =
-
[30]
International Conference on Intelligent Transportation Systems (ITSC) , title =
Joschka Bischoff and Michal Maciejewski and Kai Nagel , doi =. International Conference on Intelligent Transportation Systems (ITSC) , title =
-
[31]
The Multi-Agent Transport Simulation. doi:10.5334/baw , editor =
-
[32]
Procedia Computer Science , volume =
Nicolai Mallig and Martin Kagerbauer and Peter Vortisch , keywords =. Procedia Computer Science , volume =. 2013 , issn =. doi:https://doi.org/10.1016/j.procs.2013.06.114 , url =
-
[33]
Large Scale Realtime Ridesharing with Service Guarantee on Road Networks , volume =
Yan Huang and Favyen Bastani and Ruoming Jin and Xiaoyang Sean Wang , doi =. Large Scale Realtime Ridesharing with Service Guarantee on Road Networks , volume =. Proceedings of the VLDB Endowment , pages =
-
[34]
International Joint Conference on Artificial Intelligence (IJCAI) , pages =
Kleiner, Alexander and Nebel, Bernhard and Ziparo, Vittorio Amos , title =. International Joint Conference on Artificial Intelligence (IJCAI) , pages =. 2011 , isbn =
work page 2011
-
[35]
Dynamic Ride-Sharing: A Simulation Study in Metro
Niels Agatz and Alan Erera and Martin Savelsbergh and Xing Wang , doi =. Dynamic Ride-Sharing: A Simulation Study in Metro. Transportation Research Part B: Methodological , keywords =
-
[36]
Wesam Herbawi and Michael Weber , doi =. A Genetic and Insertion Heuristic Algorithm for Solving the Dynamic Ridematching Problem with Time Windows , year =. International Conference on Genetic and Evolutionary Computation (GECCO) , publisher =
- [37]
-
[38]
Procedia Computer Science , volume=
Modeling intermodal travel behavior in an agent-based travel demand model , author=. Procedia Computer Science , volume=. 2021 , publisher=
work page 2021
-
[39]
On-demand Shared Ride-hailing for Commuting Purposes: Comparison of
Mireia Gilibert and Imma Ribas and Christian Rosen and Alexander Siebeneich , doi =. On-demand Shared Ride-hailing for Commuting Purposes: Comparison of. Transportation Research Procedia , keywords =
-
[40]
Usage and User Characteristics—Insights from
Nadine Kostorz and Eva Fraedrich and Martin Kagerbauer , doi =. Usage and User Characteristics—Insights from. Sustainability , keywords =
-
[41]
Environmental Benefits From Ridesharing: A Case of
Biying Yu and Ye Ma and Meimei Xue and Baojun Tang and Bin Wang and Jinyue Yan and Yi-Ming Wei , doi =. Environmental Benefits From Ridesharing: A Case of. Applied Energy , keywords =
-
[42]
Mladenović and Waqar Ullah and John D
Christoffer Weckström and Miloš N. Mladenović and Waqar Ullah and John D. Nelson and Moshe Givoni and Sebastian Bussman , doi =. User Perspectives on Emerging Mobility Services: Ex Post Analysis of. Research in Transportation Business & Management , keywords =
-
[43]
Jani-Pekka Jokinen and Teemu Sihvola and Milos N. Mladenovic , doi =. Policy Lessons from the Flexible Transport Service Pilot. Transport Policy , pages =
-
[44]
Behavioral Responses to Dynamic Ridesharing Services - The Case of Taxi-Sharing Project in
Chichung Tao and Chungjung Wu , doi =. Behavioral Responses to Dynamic Ridesharing Services - The Case of Taxi-Sharing Project in. International Conference on Service Operations and Logistics, and Informatics (SOLI) , pages =
-
[45]
Dynamic Ride Sharing Service: Are Users Ready to Adopt it? , volume =
Eleonora Gargiulo and Roberta Giannantonio and Elena Guercio and Claudio Borean and Giovanni Zenezini , doi =. Dynamic Ride Sharing Service: Are Users Ready to Adopt it? , volume =. Procedia Manufacturing , keywords =
-
[46]
The Limits of Money in Daily Ridesharing: Evidence from a Field Experiment in Rural
Dianzhuo Zhu , doi =. The Limits of Money in Daily Ridesharing: Evidence from a Field Experiment in Rural. Revue d'économie industrielle , pages =
-
[47]
Flow-Inflated Selective Sampling for Efficient Agent-Based Dynamic Ride-Pooling Simulations , year =
Nico Kuehnel and Hannes Rewald and Steffen Axer and Felix Zwick and Rolf Findeisen , doi =. Flow-Inflated Selective Sampling for Efficient Agent-Based Dynamic Ride-Pooling Simulations , year =. Transportation Research Record: Journal of the Transportation Research Board , pages =
-
[48]
Daniel J. Fagnant and Kara M. Kockelman , doi =. The Travel and Environmental Implications of Shared Autonomous Vehicles, Using Agent-Based Model Scenarios , volume =. Transportation Research Part C: Emerging Technologies , pages =
-
[49]
Gabriel Wilkes and Roman Engelhardt and Lars Briem and Florian Dandl and Peter Vortisch and Klaus Bogenberger and Martin Kagerbauer , doi =. Self-Regulating Demand and Supply Equilibrium in Joint Simulation of Travel Demand and a Ride-Pooling Service , volume =. Transportation Research Record: Journal of the Transportation Research Board , pages =
-
[50]
Felix Zwick and Gabriel Wilkes and Roman Engelhardt and Steffen Axer and Florian Dandl and Hannes Rewald and Nadine Kostorz and Eva Fraedrich and Martin Kagerbauer and Kay W. Axhausen , doi =. Mode choice and ride-pooling simulation: A comparison of. Procedia Computer Science , keywords =
-
[51]
Transportation Research Record: Journal of the Transportation Research Board , author =
Analytical and Agent-Based Model to Evaluate Ride-Pooling Impact Factors , volume =. Transportation Research Record: Journal of the Transportation Research Board , author =. 2020 , langid =. doi:10.1177/0361198120917666 , abstract =
-
[52]
and Basalamah, Anas , urldate =
Cao, Bin and Alarabi, Louai and Mokbel, Mohamed F. and Basalamah, Anas , urldate =. International Conference on Mobile Data Management (. 2015 , langid =. doi:10.1109/MDM.2015.12 , shorttitle =
-
[53]
Data Driven Analysis of the Potentials of Dynamic Ride Pooling , isbn =
Chen, Min Hao and Jauhri, Abhinav and Shen, John Paul , urldate =. Data Driven Analysis of the Potentials of Dynamic Ride Pooling , isbn =. 2017 , langid =. doi:10.1145/3151547.3151549 , abstract =
-
[54]
Quantifying the Benefits of Autonomous On-Demand Ride-Pooling: A Simulation Study for
Engelhardt, Roman and Dandl, Florian and Bilali, Aledia and Bogenberger, Klaus , urldate =. Quantifying the Benefits of Autonomous On-Demand Ride-Pooling: A Simulation Study for. Intelligent Transportation Systems Conference (. 2019 , langid =. doi:10.1109/ITSC.2019.8916955 , shorttitle =
-
[55]
Journal of Transport Geography , author =
User characteristics and spatial correlates of ride-pooling demand – Evidence from. Journal of Transport Geography , author =. 2023 , langid =. doi:10.1016/j.jtrangeo.2023.103596 , abstract =
-
[56]
Usage and User Characteristics—Insights from. Sustainability , author =. 2021 , langid =. doi:10.3390/su13020958 , abstract =
-
[57]
Transportation Research Procedia , author =
An Intermodal Dispatcher for the Assignment of Public Transport and Ride Pooling Services , volume =. Transportation Research Procedia , author =. 2022 , langid =. doi:10.1016/j.trpro.2022.02.056 , pages =
-
[58]
A Time-Invariant Network Flow Model for Ride-Pooling in Mobility-on-Demand Systems , volume =
Paparella, Fabio and Pedroso, Leonardo and Hofman, Theo and Salazar, Mauro , urldate =. A Time-Invariant Network Flow Model for Ride-Pooling in Mobility-on-Demand Systems , volume =. 2025 , langid =. doi:10.1109/TCNS.2024.3431411 , abstract =
-
[59]
Neural Approximate Dynamic Programming for On-Demand Ride-Pooling , volume =
Shah, Sanket and Lowalekar, Meghna and Varakantham, Pradeep , urldate =. Neural Approximate Dynamic Programming for On-Demand Ride-Pooling , volume =. Conference on Artificial Intelligence , publisher =. 2020 , langid =. doi:10.1609/aaai.v34i01.5388 , abstract =
-
[60]
Journal of Transport Geography , author =
Spatiotemporal variability of ride-pooling potential – Half a year New York City experiment , volume =. Journal of Transport Geography , author =. 2024 , langid =. doi:10.1016/j.jtrangeo.2023.103767 , abstract =
-
[61]
Transportmetrica A: Transport Science , author =
The shareability potential of ride-pooling under alternative spatial demand patterns , volume =. Transportmetrica A: Transport Science , author =. 2024 , langid =. doi:10.1080/23249935.2022.2140022 , abstract =
-
[62]
Yu, Xian and Shen, Siqian , urldate =. An Integrated Decomposition and Approximate Dynamic Programming Approach for On-Demand Ride Pooling , volume =. 2020 , langid =. doi:10.1109/TITS.2019.2934423 , abstract =
-
[63]
Transportation Research Part D: Transport and Environment , author =
The potential of ride-pooling in. Transportation Research Part D: Transport and Environment , author =. 2022 , langid =. doi:10.1016/j.trd.2021.103155 , abstract =
-
[64]
Zwick, Felix and Axhausen, Kay W. , urldate =. Analysis of ridepooling strategies with. 2020 , langid =. doi:10.3929/ETHZ-B-000420103 , abstract =
-
[65]
Procedia Computer Science , author =
Ride-Pooling Efficiency in Large, Medium-Sized and Small Towns -Simulation Assessment in the. Procedia Computer Science , author =. 2021 , langid =. doi:10.1016/j.procs.2021.03.083 , pages =
-
[66]
Journal of Transport Geography , author =
Ride-pooling demand prediction: A spatiotemporal assessment in. Journal of Transport Geography , author =. 2022 , langid =. doi:10.1016/j.jtrangeo.2022.103307 , shorttitle =
-
[67]
Transportation Planning and Technology , author =
On the scalability of private and pooled on-demand services for urban mobility in Amsterdam , volume =. Transportation Planning and Technology , author =. 2022 , langid =. doi:10.1080/03081060.2021.2017214 , abstract =
-
[68]
A scalable approach for data-driven taxi ride-sharing simulation , isbn =
Ota, Masayo and Vo, Huy and Silva, Claudio and Freire, Juliana , urldate =. A scalable approach for data-driven taxi ride-sharing simulation , isbn =. International Conference on Big Data (Big Data) , publisher =. 2015 , langid =. doi:10.1109/BigData.2015.7363837 , abstract =
-
[69]
International Conference on Data Engineering (
Ma, Shuo and Zheng, Yu and Wolfson, Ouri , urldate =. International Conference on Data Engineering (. 2013 , langid =. doi:10.1109/ICDE.2013.6544843 , shorttitle =
-
[70]
Real-Time City-Scale Taxi Ridesharing , volume =
Ma, Shuo and Zheng, Yu and Wolfson, Ouri , urldate =. Real-Time City-Scale Taxi Ridesharing , volume =. 2015 , langid =. doi:10.1109/TKDE.2014.2334313 , abstract =
-
[71]
Artificial Intelligence Review , author =
Putting ridesharing to the test: efficient and scalable solutions and the power of dynamic vehicle relocation , volume =. Artificial Intelligence Review , author =. 2022 , langid =. doi:10.1007/s10462-022-10145-0 , shorttitle =
-
[72]
Bus Pooling: A Large-Scale Bus Ridesharing Service , volume =
Liu, Kaijun and Zhang, Jingwei and Yang, Qing , urldate =. Bus Pooling: A Large-Scale Bus Ridesharing Service , volume =. 2019 , langid =. doi:10.1109/ACCESS.2019.2920756 , shorttitle =
-
[73]
Transportmetrica B: Transport Dynamics , author =
An enhanced approximate dynamic programming approach to on-demand ride-Pooling , volume =. Transportmetrica B: Transport Dynamics , author =. 2025 , langid =. doi:10.1080/21680566.2025.2551913 , abstract =
discussion (0)
Sign in with ORCID, Apple, or X to comment. Anyone can read and Pith papers without signing in.