Recognition: 2 theorem links
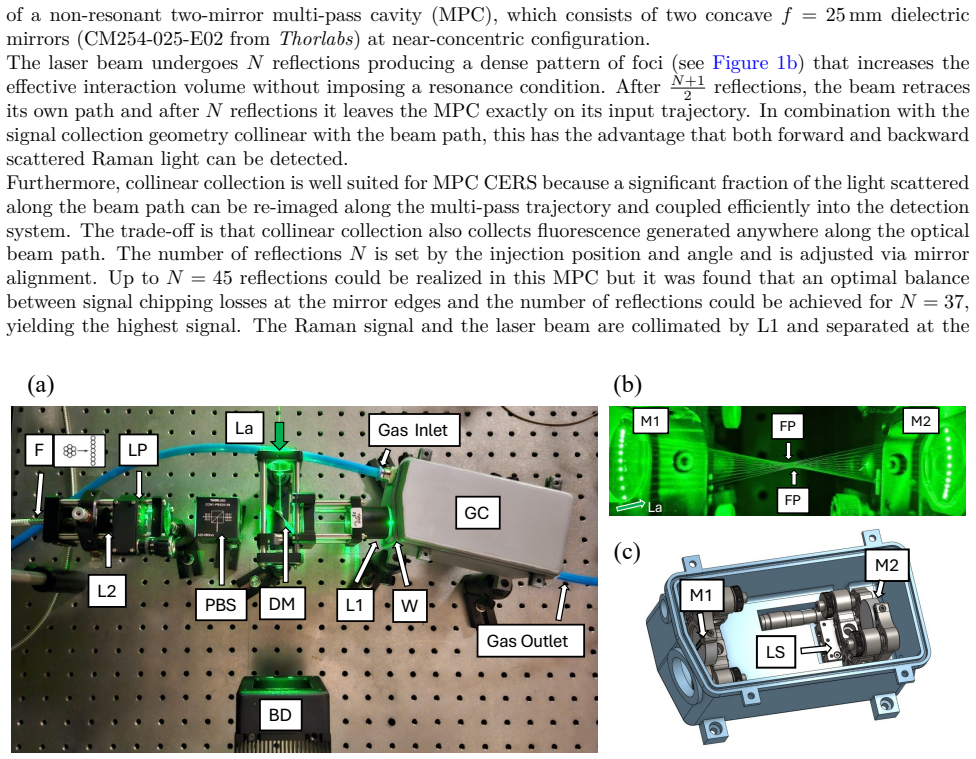
· Lean TheoremSystematic Investigation and Suppression of Fluorescence in High-Sensitivity Cavity-Enhanced Raman Gas Sensing
Pith reviewed 2026-05-13 05:12 UTC · model grok-4.3
The pith
Systematic removal of fluorescent optics in a multi-pass cavity allows cavity-enhanced Raman sensing to detect ambient methane at 2 ppm and other trace gases at parts-per-million levels.
A machine-rendered reading of the paper's core claim, the machinery that carries it, and where it could break.
Core claim
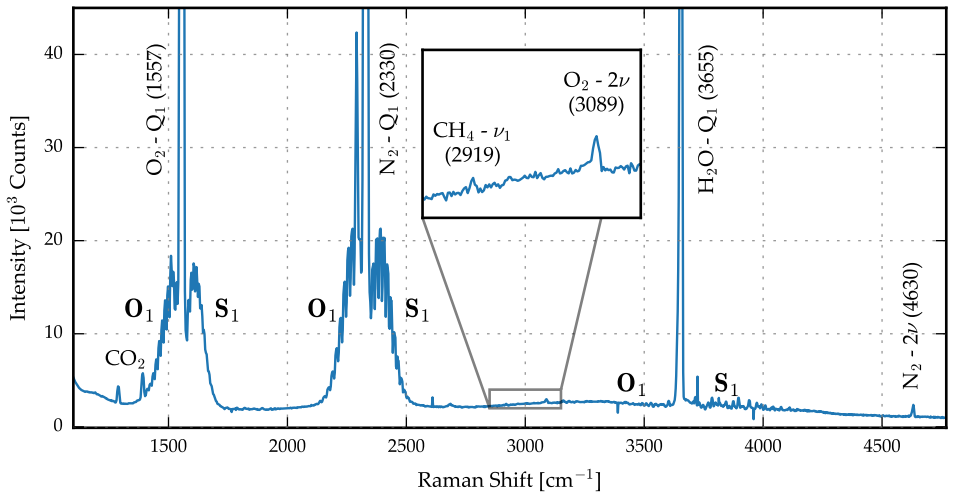
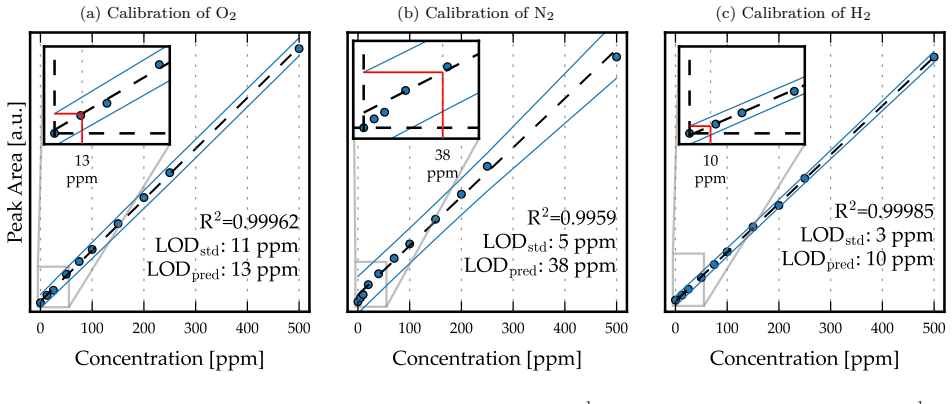
In a cavity-enhanced Raman system built around a 500 mW 532 nm laser and a simple two-mirror multi-pass cavity operated near the concentric condition with up to 45 reflections, a systematic campaign to identify and replace fluorescent optics reduces the fluorescence baseline. A CCD noise model that ties residual fluorescence directly to shot-noise-limited performance, together with ray-tracing simulations of collection efficiency, quantifies the improvement. The resulting instrument resolves weak Raman features in room air, including CO2, O2 and N2 overtones, and ambient CH4 at 2 ppm. Separate calibration sequences for O2 diluted in N2, N2 diluted in O2, and H2 diluted in N2 establish 1-sqrt
What carries the argument
Step-wise elimination of fluorescent optical components, supported by a CCD-specific noise model that links baseline fluorescence levels to measurement noise and by optical simulations of collection efficiency inside the multi-pass cavity.
If this is right
- Ambient-air spectra become rich enough to show CO2 peaks together with O2 and N2 overtones.
- Methane at its natural 2 ppm concentration is detectable without preconcentration.
- Calibration curves yield 3 ppm detection limit for H2, 5 ppm for N2, and 11 ppm for O2 in 180 s acquisitions.
- Fluorescence mitigation emerges as a practical design lever for field-deployable CERS instruments.
Where Pith is reading between the lines
- Material selection for low-fluorescence optics may improve sensitivity in other Raman or fluorescence-sensitive techniques without requiring higher laser power.
- The same systematic audit could be repeated at different wavelengths or with resonant cavities to test whether the same classes of fluorescent contaminants dominate.
- The approach supports more reliable multi-species monitoring in environmental or industrial settings where power and complexity must stay low.
Load-bearing premise
The measured gains in sensitivity are caused chiefly by the removal of fluorescent optics rather than by unrecorded changes in laser stability, beam alignment, or light collection geometry that occurred while the optics were being swapped.
What would settle it
A side-by-side comparison in which the final non-fluorescent optical train is swapped back to the original fluorescent components while all alignment, laser power, and integration settings are held identical, followed by re-measurement of the same gas samples to check whether detection limits revert to their earlier values.
Figures

read the original abstract
Raman spectroscopy enables broadband, multi-species gas analysis by providing access to an entire vibrational spectrum in a single measurement. However, the sensitivity of gas-phase Raman sensing is often limited by weak signals and fluorescence background from various optical elements that constrain the achievable signal-to-noise ratio (SNR) through signal-dependent noise contributions (e.g. shot noise). Here, we present a cavity-enhanced Raman spectroscopy (CERS) gas sensor employing a 500 mW, 532 nm continuous wave (CW) laser and a simple, non-resonant two-mirror multi-pass cavity (MPC) operated at ambient pressure and near the concentric condition, providing up to 45 internal reflections. To quantitatively capture the impact of fluorescence on performance, a CCD-specific noise model was developed that links fluorescenceinduced baseline levels to measurement noise. Complementary optical simulations were employed to assess the signal collection efficiency in the MPC. Through a systematic analysis of fluorescence sources, the background was reduced substantially by step-wise elimination of fluorescent optics. The fluorescence-minimized setup resolves weak Raman signatures in ambient-air spectra, including CO2 peaks, O2 and N2 overtones, and ambient CH4 (2 ppm). Calibration measurements for O2 (diluted in N2), N2 (in O2) and H2 (in N2) demonstrate detection limits of 11 ppm, 5 ppm and 3 ppm, respectively, with a 180 s measurement time. The results highlight fluorescence mitigation as a key design lever for robust, field-oriented CERS instrumentation for trace gas sensing.
Editorial analysis
A structured set of objections, weighed in public.
Referee Report
Summary. The manuscript describes a cavity-enhanced Raman spectroscopy (CERS) sensor using a 500 mW 532 nm CW laser and a non-resonant two-mirror multi-pass cavity (MPC) operated near concentricity at ambient pressure with up to 45 reflections. A CCD-specific noise model is developed to relate fluorescence-induced baseline levels to measurement noise, complemented by optical simulations of signal collection efficiency. Systematic step-wise removal of fluorescent optics reduces the background, enabling resolution of weak Raman features in ambient air (including CO2, O2/N2 overtones, and 2 ppm CH4) and calibration-based detection limits of 11 ppm O2 (in N2), 5 ppm N2 (in O2), and 3 ppm H2 (in N2) for 180 s integration times.
Significance. If the reported sensitivity gains are attributable to fluorescence suppression, the work demonstrates a practical, low-cost design lever for improving SNR in broadband Raman gas sensors without requiring resonant enhancement or cryogenic cooling. The CCD noise model and collection-efficiency simulations provide reusable tools for quantifying background-limited performance. The achieved limits at ambient pressure and the demonstration of multi-species ambient-air spectra are relevant for field-deployable trace-gas instrumentation.
major comments (2)
- [Systematic analysis of fluorescence sources (and associated results section)] The central claim attributes the reported detection limits and ambient-air spectra primarily to the step-wise elimination of fluorescent optics. However, no quantitative before/after Raman signal amplitudes (for a fixed test gas and fixed alignment) are shown after each optic replacement. Given that the MPC operates near concentricity and is sensitive to mirror spacing, injection alignment, and collection geometry, concurrent changes in intracavity power or collection efficiency cannot be ruled out as contributors to the SNR improvement.
- [CCD-specific noise model description] The CCD noise model is used to link reduced baseline to lower noise, but the manuscript does not provide the explicit functional form or fitted parameters relating fluorescence level to the final detection limits. It is therefore unclear whether the quoted limits (11 ppm O2, 5 ppm N2, 3 ppm H2) follow directly from the model or incorporate additional empirical scaling.
minor comments (2)
- [Figures showing ambient-air and calibration spectra] Figure captions should explicitly state integration time, laser power, and gas pressure for each spectrum to allow direct comparison with the calibration data.
- [Noise model section] The term 'parameter-free' is used in the noise-model discussion; clarify whether any scaling factors were adjusted to match the experimental baselines.
Simulated Author's Rebuttal
We thank the referee for the constructive comments and positive assessment of the work's relevance. We address each major comment point by point below. Where the comments identify gaps in the presented evidence, we have revised the manuscript to strengthen the claims.
read point-by-point responses
-
Referee: The central claim attributes the reported detection limits and ambient-air spectra primarily to the step-wise elimination of fluorescent optics. However, no quantitative before/after Raman signal amplitudes (for a fixed test gas and fixed alignment) are shown after each optic replacement. Given that the MPC operates near concentricity and is sensitive to mirror spacing, injection alignment, and collection geometry, concurrent changes in intracavity power or collection efficiency cannot be ruled out as contributors to the SNR improvement.
Authors: We agree that explicit quantitative before-and-after Raman signal amplitudes for each optic replacement would more rigorously isolate the contribution of fluorescence reduction. The replacements were performed sequentially while preserving the near-concentric MPC alignment and monitoring reference Raman signals from a fixed test gas to maintain consistent intracavity power and collection geometry. However, these intermediate signal values were not documented in the original manuscript. In the revised version, we will add a supplementary table and accompanying text in the results section that reports the N2 Q-branch peak amplitudes measured at each major stage of the systematic optic removal. These data confirm that Raman signal levels remained stable (within 5%) while the fluorescence baseline decreased by more than an order of magnitude, supporting that alignment-induced changes were not the dominant factor in the SNR improvement. revision: yes
-
Referee: The CCD noise model is used to link reduced baseline to lower noise, but the manuscript does not provide the explicit functional form or fitted parameters relating fluorescence level to the final detection limits. It is therefore unclear whether the quoted limits (11 ppm O2, 5 ppm N2, 3 ppm H2) follow directly from the model or incorporate additional empirical scaling.
Authors: The CCD noise model is introduced in the methods section to relate fluorescence baseline to shot-noise-limited performance, but the explicit functional form and parameter values were omitted for brevity. The quoted detection limits were obtained directly from experimental calibration curves in the final fluorescence-minimized configuration. In the revised manuscript, we will insert the complete noise model equation (including the fluorescence-dependent shot-noise term, read noise, and dark current contributions) together with the fitted CCD parameters and the scaling coefficient that connects baseline level to noise variance. This addition will show that the reported limits of 11 ppm O2, 5 ppm N2, and 3 ppm H2 are consistent with the model predictions based on the measured post-suppression baseline, without additional empirical scaling beyond the calibration data. revision: yes
Circularity Check
No circularity: experimental calibration against external standards
full rationale
The manuscript presents an experimental CERS setup in which fluorescence sources are identified and removed stepwise, with performance quantified by direct calibration measurements of known gas mixtures (O2 in N2, N2 in O2, H2 in N2) yielding stated detection limits. No equations, predictions, or uniqueness theorems are invoked that reduce by construction to fitted parameters, self-citations, or ansatzes defined from the same data. The noise model is described as linking baseline to shot noise but is not shown to be self-referential or load-bearing for the central claims. The work is therefore self-contained against external benchmarks.
Axiom & Free-Parameter Ledger
Lean theorems connected to this paper
-
IndisputableMonolith/Foundation/AbsoluteFloorClosure.leanreality_from_one_distinction unclearThrough a systematic analysis of fluorescence sources, the background was reduced substantially by step-wise elimination of fluorescent optics... detection limits of 11 ppm, 5 ppm and 3 ppm... with a 180 s measurement time.
-
IndisputableMonolith/Cost/FunctionalEquation.leanwashburn_uniqueness_aczel unclearCCD-specific noise model... σ_N = √(aμ_S + bμ_S² + c)
Reference graph
Works this paper leans on
-
[1]
Atmospheric composition change – global and regional air quality
P. Monks et al. “Atmospheric composition change – global and regional air quality”. In:Atmospheric Environment43.33 (Oct. 2009), pp. 5268–5350.issn: 13522310.doi:10.1016/j.atmosenv.2009.08.021. url:https://linkinghub.elsevier.com/retrieve/pii/S1352231009007109(visited on 09/16/2025)
-
[2]
Multipass Raman gas analyzer for monitoring of atmo- spheric air composition
D. Petrov, I. Matrosov, and M. Kostenko. “Multipass Raman gas analyzer for monitoring of atmo- spheric air composition”. In:Optics & Laser Technology152 (Aug. 2022), p. 108155.issn: 00303992. doi:10.1016/j.optlastec.2022.108155.url:https://linkinghub.elsevier.com/retrieve/pii/ S0030399222003127(visited on 12/12/2024)
work page doi:10.1016/j.optlastec.2022.108155.url:https://linkinghub.elsevier.com/retrieve/pii/ 2022
-
[3]
Outgassing Environment of Spacecraft: An Overview
Z. Jiao et al. “Outgassing Environment of Spacecraft: An Overview”. In:IOP Conference Series: Materials Science and Engineering611.1 (Oct. 1, 2019), p. 012071.issn: 1757-8981, 1757-899X.doi:10.1088/1757- 899X/611/1/012071.url:https://iopscience.iop.org/article/10.1088/1757- 899X/611/1/ 012071(visited on 02/04/2026)
-
[4]
Application of gas chromatography in food analysis
S. J. Lehotay and J. Hajšlová. “Application of gas chromatography in food analysis”. In:TrAC Trends in Analytical Chemistry21.9 (Sept. 2002), pp. 686–697.issn: 01659936.doi:10.1016/S0165-9936(02) 00805- 1.url:https://linkinghub.elsevier.com/retrieve/pii/S0165993602008051(visited on 02/04/2026)
-
[5]
Analyses of gas composition in vacuum systems by mass spectrometry
P. Řepa et al. “Analyses of gas composition in vacuum systems by mass spectrometry”. In:Journal of Mass Spectrometry37.12 (Dec. 2002), pp. 1287–1291.issn: 1076-5174, 1096-9888.doi:10.1002/jms.388.url: https://analyticalsciencejournals.onlinelibrary.wiley.com/doi/10.1002/jms.388(visited on 02/04/2026)
-
[6]
X. Huang et al. “An in-line Mach-Zehnder Interferometer Using Thin-core Fiber for Ammonia Gas Sensing With High Sensitivity”. In:Scientific Reports7.1 (Apr. 5, 2017), p. 44994.issn: 2045-2322.doi:10.1038/ srep44994.url:https://www.nature.com/articles/srep44994(visited on 02/04/2026). 11
work page 2017
-
[7]
Use of Hydrogen as Fuel: A Trend of the 21st Century
C. B. B. Farias et al. “Use of Hydrogen as Fuel: A Trend of the 21st Century”. In:Energies15.1 (Jan. 3, 2022), p. 311.issn: 1996-1073.doi:10.3390/en15010311.url:https://www.mdpi.com/1996- 1073/ 15/1/311(visited on 09/16/2025)
work page doi:10.3390/en15010311.url:https://www.mdpi.com/1996- 2022
-
[8]
Hydrogen-Based Energy Systems: Current Technology Develop- ment Status, Opportunities and Challenges
I. Rolo, V. A. F. Costa, and F. P. Brito. “Hydrogen-Based Energy Systems: Current Technology Develop- ment Status, Opportunities and Challenges”. In:Energies17.1 (Dec. 28, 2023), p. 180.issn: 1996-1073. doi:10.3390/en17010180.url:https://www.mdpi.com/1996-1073/17/1/180(visited on 09/16/2025)
work page doi:10.3390/en17010180.url:https://www.mdpi.com/1996-1073/17/1/180(visited 2023
-
[9]
Green steel at its crossroads: Hybrid hydrogen-based reduction of iron ores
I. R. Souza Filho et al. “Green steel at its crossroads: Hybrid hydrogen-based reduction of iron ores”. In: Journal of Cleaner Production340 (Mar. 2022), p. 130805.issn: 09596526.doi:10.1016/j.jclepro. 2022.130805.url:https://linkinghub.elsevier.com/retrieve/pii/S0959652622004437(visited on 01/02/2025)
-
[10]
M. Kamiński et al. “Determination of carbon monoxide, methane and carbon dioxide in refinery hydrogen gases and air by gas chromatography”. In:Journal of Chromatography A989.2 (Mar. 2003), pp. 277–283. issn: 00219673.doi:10.1016/S0021- 9673(03)00032- 3.url:https://linkinghub.elsevier.com/ retrieve/pii/S0021967303000323(visited on 01/02/2025)
-
[11]
K. D. Bartle and P. Myers. “History of gas chromatography”. In:TrAC Trends in Analytical Chemistry 21.9 (Sept. 2002), pp. 547–557.issn: 01659936.doi:10.1016/S0165- 9936(02)00806- 3.url:https: //linkinghub.elsevier.com/retrieve/pii/S0165993602008063(visited on 01/02/2025)
-
[12]
Methods for gas chromatography-olfactometry: a review
S. M. Van Ruth. “Methods for gas chromatography-olfactometry: a review”. In:Biomolecular Engineering 17.4 (May 2001), pp. 121–128.issn: 13890344.doi:10.1016/S1389- 0344(01)00070- 3.url:https: //linkinghub.elsevier.com/retrieve/pii/S1389034401000703(visited on 01/02/2025)
-
[13]
J. Gebicki. “Application of electrochemical sensors and sensor matrixes for measurement of odorous chem- ical compounds”. In:TrAC Trends in Analytical Chemistry77 (Mar. 2016), pp. 1–13.issn: 01659936. doi:10 . 1016 / j . trac . 2015 . 10 . 005.url:https : / / linkinghub . elsevier . com / retrieve / pii / S0165993615300923(visited on 01/02/2025)
work page 2016
-
[14]
Applications and Advances in Electronic-Nose Technologies
A. D. Wilson and M. Baietto. “Applications and Advances in Electronic-Nose Technologies”. In:Sensors 9.7 (June 29, 2009), pp. 5099–5148.issn: 1424-8220.doi:10.3390/s90705099.url:https://www.mdpi. com/1424-8220/9/7/5099(visited on 01/02/2025)
-
[15]
Recent progress on laser absorption spectroscopy for determination of gaseous chemical species
B. Fu et al. “Recent progress on laser absorption spectroscopy for determination of gaseous chemical species”. In:Applied Spectroscopy Reviews57.2 (Feb. 7, 2022), pp. 112–152.issn: 0570-4928, 1520-569X. doi:10.1080/05704928.2020.1857258.url:https://www.tandfonline.com/doi/full/10.1080/ 05704928.2020.1857258(visited on 01/02/2025)
work page doi:10.1080/05704928.2020.1857258.url:https://www.tandfonline.com/doi/full/10.1080/ 2022
-
[16]
Ultralow Gas Concentration Infrared Absorption Spectroscopy
L. B. Kreuzer. “Ultralow Gas Concentration Infrared Absorption Spectroscopy”. In:Journal of Applied Physics42.7 (June 1, 1971), pp. 2934–2943.issn: 0021-8979.doi:10.1063/1.1660651.url:https: //doi.org/10.1063/1.1660651(visited on 01/02/2025)
-
[17]
Cavity ring-down optical spectrometer for absorption measurements using pulsed laser sources
A. O’Keefe and D. A. G. Deacon. “Cavity ring-down optical spectrometer for absorption measurements using pulsed laser sources”. In:Review of Scientific Instruments59.12 (Dec. 1, 1988), pp. 2544–2551.issn: 0034-6748, 1089-7623.doi:10.1063/1.1139895.url:https://pubs.aip.org/rsi/article/59/12/ 2544/313248/Cavity-ring-down-optical-spectrometer-for(visited on ...
work page doi:10.1063/1.1139895.url:https://pubs.aip.org/rsi/article/59/12/ 1988
-
[18]
D. A. Long.The Raman Effect: A Unified Treatment of the Theory of Raman Scattering by Molecules. 1sted.Wiley,Apr.15,2002.isbn:0-470-84576-7.doi:10.1002/0470845767.url:https://onlinelibrary. wiley.com/doi/book/10.1002/0470845767(visited on 10/22/2024)
work page doi:10.1002/0470845767.url:https://onlinelibrary 2002
-
[19]
G. Herzberg. “On the Possibility of Detecting Molecular Hydrogen and Nitrogen in Planetary and Stellar Atmospheres by Their Rotation-Vibration Spectra”. In:The Astrophysical Journal87 (May 1938), p. 428. issn: 0004-637X, 1538-4357.doi:10.1086/143935.url:http://adsabs.harvard.edu/doi/10.1086/ 143935(visited on 02/04/2026)
work page doi:10.1086/143935.url:http://adsabs.harvard.edu/doi/10.1086/ 1938
-
[20]
Quadrupole Rotation-Vibration Spectrum of the Hydrogen Molecule
G. Herzberg. “Quadrupole Rotation-Vibration Spectrum of the Hydrogen Molecule”. In:Nature163.4135 (Jan. 29, 1949), pp. 170–170.issn: 0028-0836, 1476-4687.doi:10.1038/163170a0.url:https://www. nature.com/articles/163170a0(visited on 02/04/2026)
-
[21]
Advances in mid-infrared spectroscopy enabled by supercontinuum laser sources
I. Zorin et al. “Advances in mid-infrared spectroscopy enabled by supercontinuum laser sources”. In: Optics Express30.4 (Feb. 14, 2022), p. 5222.issn: 1094-4087.doi:10.1364/OE.447269.url:https: //opg.optica.org/abstract.cfm?URI=oe-30-4-5222(visited on 02/04/2026)
-
[22]
Weber, ed.Raman Spectroscopy of Gases and Liquids
A. Weber, ed.Raman Spectroscopy of Gases and Liquids. Vol. 11. Topics in Current Physics. Berlin, Heidelberg: Springer Berlin Heidelberg, 1979.isbn: 978-3-642-81279-8.doi:10.1007/978-3-642-81279- 8.url:http://link.springer.com/10.1007/978-3-642-81279-8(visited on 11/12/2024). 12
-
[23]
Raman cross section of some simple gases
W. R. Fenner et al. “Raman cross section of some simple gases”. In:Journal of the Optical Society of America63.1 (Jan. 1, 1973), p. 73.issn: 0030-3941.doi:10 . 1364 / JOSA . 63 . 000073.url:https : //opg.optica.org/abstract.cfm?URI=josa-63-1-73(visited on 11/12/2024)
work page 1973
-
[24]
A review of cavity-enhanced Raman spectroscopy as a gas sensing method
P. Wang et al. “A review of cavity-enhanced Raman spectroscopy as a gas sensing method”. In:Applied Spectroscopy Reviews55.5 (May 27, 2020), pp. 393–417.issn: 0570-4928, 1520-569X.doi:10 . 1080 / 05704928.2019.1661850.url:https://www.tandfonline.com/doi/full/10.1080/05704928.2019. 1661850(visited on 12/12/2024)
-
[25]
A Short Review of Cavity-Enhanced Raman Spectroscopy for Gas Analysis
C. Niklas, H. Wackerbarth, and G. Ctistis. “A Short Review of Cavity-Enhanced Raman Spectroscopy for Gas Analysis”. In:Sensors21.5 (Mar. 2, 2021), p. 1698.issn: 1424-8220.doi:10.3390/s21051698. url:https://www.mdpi.com/1424-8220/21/5/1698(visited on 06/25/2024)
-
[26]
Multiple Gas Detection by Cavity-Enhanced Raman Spectroscopy with Sub-ppm Sen- sitivity
Q.-y. Yang et al. “Multiple Gas Detection by Cavity-Enhanced Raman Spectroscopy with Sub-ppm Sen- sitivity”. In:Analytical Chemistry95.13 (Apr. 4, 2023), pp. 5652–5660.issn: 0003-2700, 1520-6882.doi: 10.1021/acs.analchem.2c05432.url:https://pubs.acs.org/doi/10.1021/acs.analchem.2c05432 (visited on 06/25/2024)
work page doi:10.1021/acs.analchem.2c05432.url:https://pubs.acs.org/doi/10.1021/acs.analchem.2c05432 2023
-
[27]
Multigas Analysis by Cavity-Enhanced Raman Spectroscopy for Power Transformer Diagnosis
P. Wang et al. “Multigas Analysis by Cavity-Enhanced Raman Spectroscopy for Power Transformer Diagnosis”. In:Analytical Chemistry92.8 (Apr. 21, 2020), pp. 5969–5977.issn: 0003-2700, 1520-6882.doi: 10.1021/acs.analchem.0c00179.url:https://pubs.acs.org/doi/10.1021/acs.analchem.0c00179 (visited on 06/25/2024)
work page doi:10.1021/acs.analchem.0c00179.url:https://pubs.acs.org/doi/10.1021/acs.analchem.0c00179 2020
-
[28]
An introduction to Pound–Drever–Hall laser frequency stabilization
E. D. Black. “An introduction to Pound–Drever–Hall laser frequency stabilization”. In:American Journal of Physics69.1 (Jan. 1, 2001), pp. 79–87.issn: 0002-9505, 1943-2909.doi:10.1119/1.1286663.url: https://pubs.aip.org/ajp/article/69/1/79/1055569/An-introduction-to-Pound-Drever-Hall- laser(visited on 05/05/2025)
-
[29]
A review of Pound-Drever-Hall laser frequency locking
M. Nickerson. “A review of Pound-Drever-Hall laser frequency locking”. In:JILA, University of Colorado and NIST(2019), p. 7.url:https://jila1.nickersonm.com/papers/PDH%20Locking%20Review.pdf (visited on 11/17/2025)
work page 2019
-
[30]
P. Wang et al. “Cavity-Enhanced Raman Spectroscopy for Detection of Trace Gaseous Impurities in Hydrogen for Fuel Cells”. In:Analytical Chemistry95.17 (May 2, 2023), pp. 6894–6904.issn: 0003-2700, 1520-6882.doi:10.1021/acs.analchem.3c00066.url:https://pubs.acs.org/doi/10.1021/acs. analchem.3c00066(visited on 10/21/2024)
work page doi:10.1021/acs.analchem.3c00066.url:https://pubs.acs.org/doi/10.1021/acs 2023
-
[31]
J. Wang et al. “Highly sensitive multi-pass cavity enhanced Raman spectroscopy with novel polarization filtering for quantitative measurement of SF6 decomposed components in gas-insulated power equipment”. In:Sensors and Actuators B: Chemical380 (Apr. 2023), p. 133350.issn: 09254005.doi:10.1016/j.snb. 2023.133350.url:https://linkinghub.elsevier.com/retrie...
-
[32]
Diagnosis of Multiple Gases Separated from Transformer Oil Using Cavity-Enhanced Raman Spectroscopy
L. Xiao-Yun et al. “Diagnosis of Multiple Gases Separated from Transformer Oil Using Cavity-Enhanced Raman Spectroscopy”. In:Chinese Physics Letters25.9 (Sept. 2008), pp. 3326–3329.issn: 0256-307X, 1741-3540.doi:10.1088/0256- 307X/25/9/062.url:https://iopscience.iop.org/article/10. 1088/0256-307X/25/9/062(visited on 12/31/2024)
-
[33]
Ambient Hydrocarbon Detection with an Ultra-Low-Loss Cavity Raman An- alyzer
J. Singh and A. Muller. “Ambient Hydrocarbon Detection with an Ultra-Low-Loss Cavity Raman An- alyzer”. In:Analytical Chemistry95.7 (Feb. 21, 2023), pp. 3703–3711.issn: 0003-2700, 1520-6882.doi: 10.1021/acs.analchem.2c04707.url:https://pubs.acs.org/doi/10.1021/acs.analchem.2c04707 (visited on 01/20/2026)
work page doi:10.1021/acs.analchem.2c04707.url:https://pubs.acs.org/doi/10.1021/acs.analchem.2c04707 2023
-
[34]
High-Precision Trace Hydrogen Sensing by Multipass Raman Scattering
J. Singh and A. Muller. “High-Precision Trace Hydrogen Sensing by Multipass Raman Scattering”. In: Sensors23.11 (May 29, 2023), p. 5171.issn: 1424-8220.doi:10.3390/s23115171.url:https://www. mdpi.com/1424-8220/23/11/5171(visited on 01/19/2026)
-
[35]
Isotopic trace analysis of water vapor with multipass cavity Raman scattering
J. Singh and A. Muller. “Isotopic trace analysis of water vapor with multipass cavity Raman scattering”. In:The Analyst146.21 (2021), pp. 6482–6489.issn: 0003-2654, 1364-5528.doi:10.1039/D1AN01254A. url:https://xlink.rsc.org/?DOI=D1AN01254A(visited on 09/08/2025)
-
[36]
Raman scattering applied to human breath analysis
C. M. Arachchige and A. Muller. “Raman scattering applied to human breath analysis”. In:TrAC Trends in Analytical Chemistry177 (Aug. 2024), p. 117791.issn: 01659936.doi:10.1016/j.trac.2024.117791. url:https://linkinghub.elsevier.com/retrieve/pii/S0165993624002747(visited on 02/03/2026)
-
[37]
SpontaneousRamanscatteringattracegasconcentrationswithapressurized external multipass cavity
J.S.G.VelezandA.Muller.“SpontaneousRamanscatteringattracegasconcentrationswithapressurized external multipass cavity”. In:Measurement Science and Technology32.4 (Apr. 1, 2021), p. 045501.issn: 0957-0233, 1361-6501.doi:10.1088/1361-6501/abd11e.url:https://iopscience.iop.org/article/ 10.1088/1361-6501/abd11e(visited on 02/03/2026). 13
work page doi:10.1088/1361-6501/abd11e.url:https://iopscience.iop.org/article/ 2021
-
[38]
Y. Zheng, X. Zou, and S. He. “Gas detection using cavity-enhanced Raman spectroscopy with a bidirec- tional multi-pass cell and polarization beam-splitting optical path”. In:Applied Physics B130.8 (Aug. 2024), p. 144.issn: 0946-2171, 1432-0649.doi:10.1007/s00340- 024- 08285- y.url:https://link. springer.com/10.1007/s00340-024-08285-y(visited on 11/18/2024)
-
[39]
Portable Raman hydrogen concentration mapping with parts-per- billion sensitivity
C. Muktha Arachchige and A. Muller. “Portable Raman hydrogen concentration mapping with parts-per- billion sensitivity”. In:Applied Optics64.13 (May 1, 2025), p. 3646.issn: 1559-128X, 2155-3165.doi: 10.1364/ao.558965.url:https://opg.optica.org/abstract.cfm?URI=ao-64-13-3646(visited on 07/21/2025)
work page doi:10.1364/ao.558965.url:https://opg.optica.org/abstract.cfm 2025
-
[40]
J. Gomez Velez and A. Muller. “Trace gas sensing using diode-pumped collinearly detected spontaneous Raman scattering enhanced by a multipass cell”. In:Optics Letters45.1 (Jan. 1, 2020), p. 133.issn: 0146- 9592, 1539-4794.doi:10.1364/OL.45.000133.url:https://opg.optica.org/abstract.cfm?URI=ol- 45-1-133(visited on 12/12/2024)
work page doi:10.1364/ol.45.000133.url:https://opg.optica.org/abstract.cfm 2020
-
[41]
D. Yang et al. “High-Sensitivity and In Situ Multi-Component Detection of Gases Based on Multiple- Reflection-Cavity-Enhanced Raman Spectroscopy”. In:Sensors24.17 (Sept. 7, 2024), p. 5825.issn: 1424- 8220.doi:10.3390/s24175825.url:https://www.mdpi.com/1424- 8220/24/17/5825(visited on 11/18/2024)
work page doi:10.3390/s24175825.url:https://www.mdpi.com/1424- 2024
-
[42]
High-SensitivityRamanGasProbeforInSituMulti-ComponentGasDetection
J.Guoetal.“High-SensitivityRamanGasProbeforInSituMulti-ComponentGasDetection”.In:Sensors 21.10 (May 19, 2021), p. 3539.issn: 1424-8220.doi:10.3390/s21103539.url:https://www.mdpi.com/ 1424-8220/21/10/3539(visited on 12/12/2024)
work page doi:10.3390/s21103539.url:https://www.mdpi.com/ 2021
-
[43]
Highly sensitive Raman system for dissolved gas analysis in water
D. Yang et al. “Highly sensitive Raman system for dissolved gas analysis in water”. In:Applied Optics 55.27 (Sept. 20, 2016), p. 7744.issn: 0003-6935, 1539-4522.doi:10.1364/AO.55.007744.url:https: //opg.optica.org/abstract.cfm?URI=ao-55-27-7744(visited on 03/03/2025)
-
[44]
Multipass optical system for a Raman gas spectrometer
D. V. Petrov. “Multipass optical system for a Raman gas spectrometer”. In:Applied Optics55.33 (Nov. 20, 2016), p. 9521.issn: 0003-6935, 1539-4522.doi:10.1364/AO.55.009521.url:https://opg.optica. org/abstract.cfm?URI=ao-55-33-9521(visited on 12/12/2024)
work page doi:10.1364/ao.55.009521.url:https://opg.optica 2016
-
[45]
Near-confocal cavity-enhanced Raman spectroscopy for multitrace-gas detection
X. Li et al. “Near-confocal cavity-enhanced Raman spectroscopy for multitrace-gas detection”. In:Optics Letters33.18 (Sept. 15, 2008), p. 2143.issn: 0146-9592, 1539-4794.doi:10.1364/OL.33.002143.url: https://opg.optica.org/abstract.cfm?URI=ol-33-18-2143(visited on 03/03/2025)
-
[46]
Parabolic mirror cavity-enhanced Raman spectroscopy for trace gas detection
J. Miao et al. “Parabolic mirror cavity-enhanced Raman spectroscopy for trace gas detection”. In:Optics Letters49.19 (Oct. 1, 2024), p. 5455.issn: 0146-9592, 1539-4794.doi:10.1364/OL.534842.url:https: //opg.optica.org/abstract.cfm?URI=ol-49-19-5455(visited on 03/03/2025). [47]IUPAC - limit of detection (L03540). IUPAC Gold Book.url:https://goldbook.iupac....
-
[47]
LimitofDetectionACloserLookattheIUPACDefinition
G.L.LongandJ.D.Winefordner.“LimitofDetectionACloserLookattheIUPACDefinition”.In:Analyt- ical Chemistry55.7 (June 1, 1983), 712A–724A.issn: 0003-2700, 1520-6882.doi:10.1021/ac00258a724. url:https://pubs.acs.org/doi/abs/10.1021/ac00258a724(visited on 09/15/2025)
-
[48]
J.-M. Mermet. “Calibration in atomic spectrometry: A tutorial review dealing with quality criteria, weight- ing procedures and possible curvatures”. In:Spectrochimica Acta Part B: Atomic Spectroscopy65.7 (July 2010), pp. 509–523.issn: 05848547.doi:10.1016/j.sab.2010.05.007.url:https://linkinghub. elsevier.com/retrieve/pii/S0584854710001394(visited on 08/04/2025)
work page doi:10.1016/j.sab.2010.05.007.url:https://linkinghub 2010
-
[49]
Pattern Recognition 127 (2022), 108611
J.-M. Mermet. “Limit of quantitation in atomic spectrometry: An unambiguous concept?” In:Spectrochim- ica Acta Part B: Atomic Spectroscopy63.2 (Feb. 2008), pp. 166–182.issn: 05848547.doi:10.1016/j. sab . 2007 . 11 . 029.url:https : / / linkinghub . elsevier . com / retrieve / pii / S0584854707004430 (visited on 08/04/2025)
work page doi:10.1016/j 2008
-
[50]
N. R. Draper and H. Smith.Applied regression analysis. 3rd ed. Wiley series in probability and statistics. New York Chichester Weinheim [etc.]: J. Wiley & sons, 1998.isbn: 978-0-471-17082-2.url:https : //onlinelibrary.wiley.com/doi/book/10.1002/9781118625590
-
[51]
D. L. Massart.Handbook of chemometrics and qualimetrics. Data handling in science and technology v
-
[52]
Amsterdam New York: Elsevier, 1997.isbn: 0-444-89724-0.url:https://pubs.acs.org/doi/10. 1021/ci980427d
work page 1997
-
[53]
A Technique for Evaluation of CCD Video-Camera Noise
K. Irie et al. “A Technique for Evaluation of CCD Video-Camera Noise”. In:IEEE Transactions on Circuits and Systems for Video Technology18.2 (Feb. 2008), pp. 280–284.issn: 1051-8215, 1558-2205. doi:10.1109/TCSVT.2007.913972.url:http://ieeexplore.ieee.org/document/4400030/(visited on 08/08/2025). 14
work page doi:10.1109/tcsvt.2007.913972.url:http://ieeexplore.ieee.org/document/4400030/(visited 2008
-
[54]
Overtone Excitation of Nitrogen Molecules via Stimulated Raman Pumping
Y. Xiao et al. “Overtone Excitation of Nitrogen Molecules via Stimulated Raman Pumping”. In:The Journal of Physical Chemistry Letters15.46 (Nov. 21, 2024), pp. 11510–11516.issn: 1948-7185, 1948- 7185.doi:10.1021/acs.jpclett.4c02608.url:https://pubs.acs.org/doi/10.1021/acs.jpclett. 4c02608(visited on 01/20/2026). 15
work page doi:10.1021/acs.jpclett.4c02608.url:https://pubs.acs.org/doi/10.1021/acs.jpclett 2024
discussion (0)
Sign in with ORCID, Apple, or X to comment. Anyone can read and Pith papers without signing in.