Recognition: no theorem link
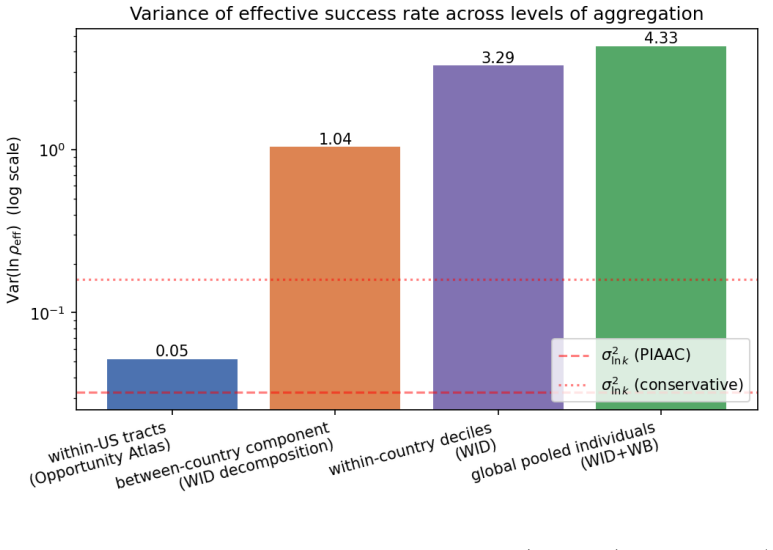
Empirical Confirmation of the Environmental-Dominance Inequality A direct decomposition of Var(ln r{ho}eff ) across four levels of aggregation
Pith reviewed 2026-05-13 04:28 UTC · model grok-4.3
The pith
Global variation in effective outcomes is 27 to 134 times more attributable to environmental differences than to individual trait differences.
A machine-rendered reading of the paper's core claim, the machinery that carries it, and where it could break.
Core claim
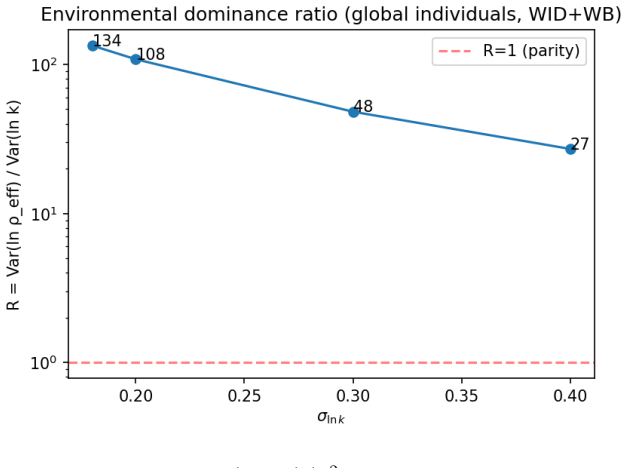
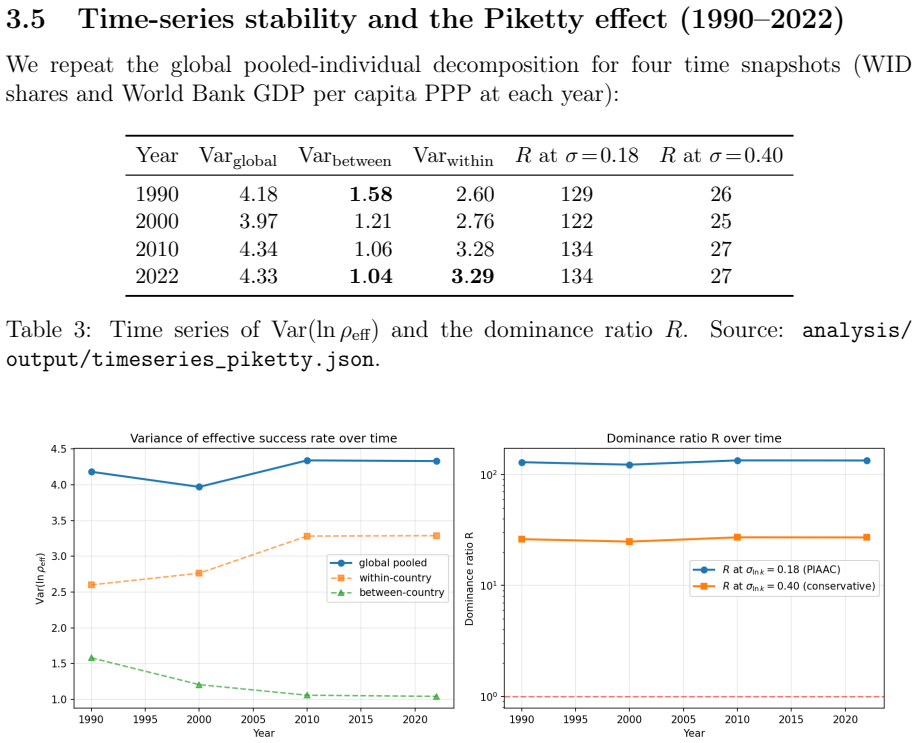
Direct calculation from Opportunity Atlas, World Bank, and World Inequality Database data yields Var(ln rho_eff) = 4.33 at the global level, producing a dominance ratio R in the interval [27, 134] when divided by plausible values of Var(ln k) for sigma_ln k in [0.18, 0.40]. The inequality is preserved with one-to-two orders of magnitude at global and decile scales, shrinks to single-digit dominance between countries, and falls below parity inside already-homogenized U.S. tracts. The 1990-2022 series shows aggregate stability accompanied by a 34 percent decline in between-country dispersion and a 26 percent rise in within-country dispersion.
What carries the argument
The dominance ratio R defined as Var(ln rho_eff) divided by Var(ln k), obtained by decomposing the variance of ln rho_eff directly across the four aggregation levels.
If this is right
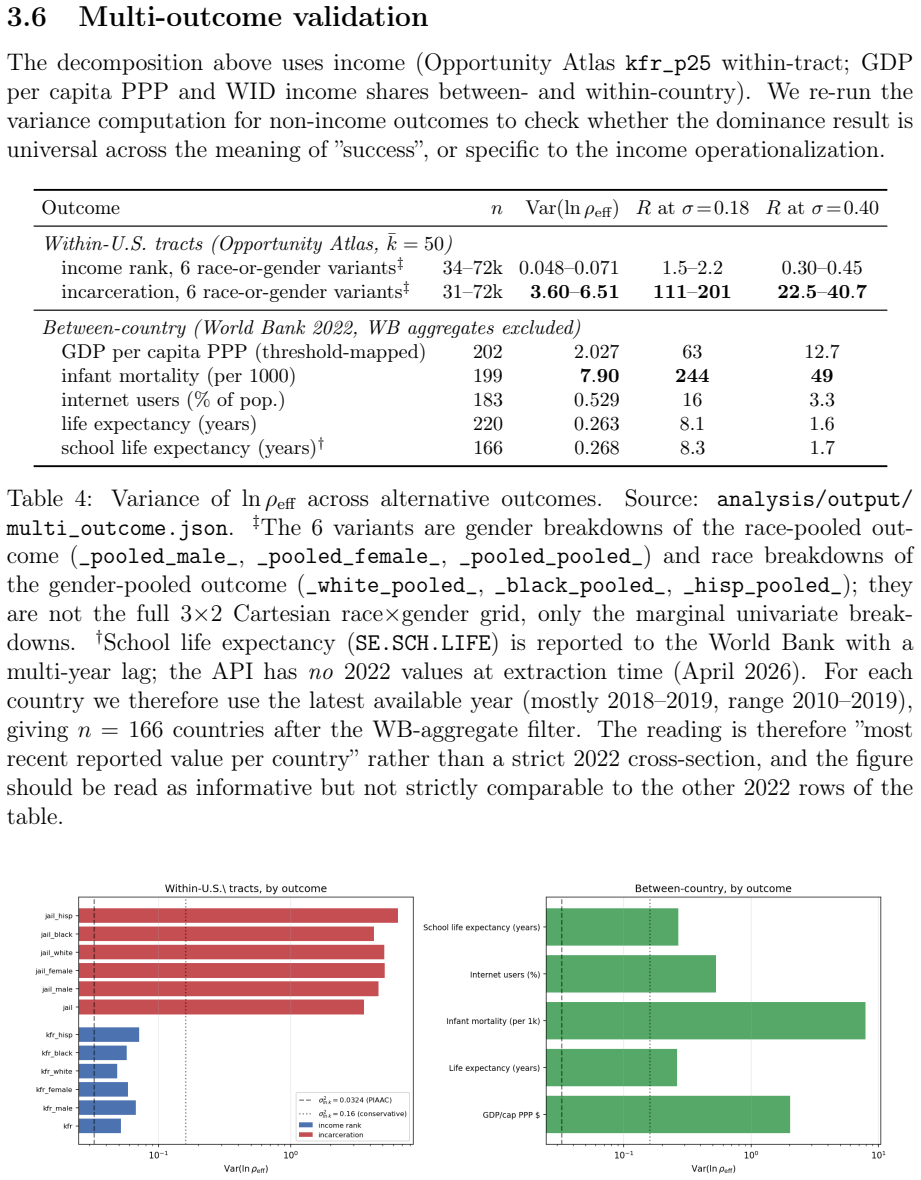
- Most of the observed spread in income, mortality, and incarceration traces to differences in environmental conditions rather than differences in personal traits.
- The share of outcome variance that can be addressed by changing environments is substantially larger than the share addressable by changing traits alone.
- Sustained convergence on specific outcomes such as life expectancy reduces the dominance ratio toward one.
- The ongoing shift from between-country to within-country environmental variance implies that future inequality reductions will require domestic rather than international policy focus.
Where Pith is reading between the lines
- Inside small, already-similar neighborhoods the remaining variance may be driven more by individual traits than by further environmental differences.
- If the dominance ratio remains high for most outcomes, uniform national policies will still leave large within-country gaps that require local environmental adjustments.
- The stability of total global variance alongside changing composition suggests that international convergence and domestic divergence are offsetting each other in real time.
Load-bearing premise
The interval [0.18, 0.40] correctly bounds the true standard deviation of ln k and the public datasets record rho_eff without large unaccounted selection bias even after applying 40-50 percent bounds.
What would settle it
A new global dataset in which the measured Var(ln rho_eff) falls below 1.0 while remaining representative of the full population would place the dominance ratio R below 5 across the stated sigma range and falsify the inequality.
Figures
read the original abstract
Empirical confirmation of the environmental-dominance inequality Var(ln rho_eff) >> Var(ln k) from arXiv:2605.02985, computed directly from three public datasets (Opportunity Atlas, World Bank GDP per capita PPP, World Inequality Database) at four levels of aggregation: U.S. census tracts, between countries, within-country deciles, and the global pooled-individual distribution. The headline global value Var(ln rho_eff) = 4.33 yields a dominance ratio R in [27, 134] across plausible sigma_ln k in [0.18, 0.40]. The inequality holds with one-to-two orders of magnitude margin at the global and within-country-decile levels, with a single-digit but still dominant margin between countries, and collapses to R in [0.33, 1.61] within already-homogenized U.S. census tracts for income. A 1990-2022 time series shows the global aggregate stable while composition shifts from between-country dispersion (-34%) to within-country dispersion (+26%), consistent with international convergence plus Piketty r > g. Multi-outcome validation shows the inequality is robust for income, infant mortality and incarceration but shrinks toward parity for outcomes targeted by sustained global convergence (life expectancy). Partial-identification and selection-bias bounds (Chetty-style 40-50% selection share) leave R in [14, 80]. All inputs and outputs are SHA-256 hashed in an append-only manifest and fully reproducible from the accompanying notebooks.
Editorial analysis
A structured set of objections, weighed in public.
Referee Report
Summary. The paper empirically confirms the environmental-dominance inequality Var(ln ρ_eff) ≫ Var(ln k) from the prior arXiv:2605.02985 by direct computation of Var(ln ρ_eff) from three public datasets (Opportunity Atlas, World Bank GDP per capita PPP, World Inequality Database) at four aggregation levels: U.S. census tracts, between countries, within-country deciles, and global pooled distribution. The headline global Var(ln ρ_eff) = 4.33 produces dominance ratio R in [27, 134] for σ_ln k ∈ [0.18, 0.40], with one-to-two orders of magnitude margin at global and decile levels, single-digit margin between countries, and collapse to R ∈ [0.33, 1.61] within U.S. tracts. It includes 1990-2022 time series showing stable global aggregate with shifting composition, multi-outcome validation across income/infant mortality/incarceration/life expectancy, Chetty-style 40-50% selection-bias bounds leaving R in [14, 80], and full reproducibility via SHA-256 manifest and notebooks.
Significance. If the central computations hold, the paper delivers reproducible, multi-scale empirical support for the inequality with large reported margins at global and within-country-decile levels. Strengths include direct variance calculations from public data without circular reduction to prior equations, explicit partial-identification bounds, temporal decomposition showing convergence effects, and machine-readable reproducibility artifacts (hashed manifest, notebooks). These features allow independent verification and extend the prior theoretical claim with falsifiable numerical results across outcomes and aggregation levels.
major comments (2)
- [global results and dominance ratio calculation] The dominance ratio R and one-to-two orders of magnitude margin claim rest on the external range σ_ln k ∈ [0.18, 0.40] (abstract and global results). The manuscript applies this range and reports R ∈ [27, 134] but provides no independent derivation, sensitivity table, or test for values >0.45 (which would drop R below 10 and erode the margin). This parameter choice is load-bearing for the headline inequality confirmation.
- [partial-identification and selection-bias bounds] § on partial identification: the 40-50% Chetty-style selection share is used to bound R in [14, 80], yet the exact adjustment to the variance estimator (how the 40-50% share modifies the computed Var(ln ρ_eff)) is not shown with an equation or step-by-step application to the three datasets. Without this, it is unclear whether larger unaccounted global selection bias could push R below the claimed margin.
minor comments (3)
- [methods] The abstract states 'direct decomposition of Var(ln ρ_eff) across four levels' but the main text should include an explicit equation (e.g., in the methods section) showing how the total variance is additively decomposed into between- and within-level components for the four aggregations.
- [introduction] Citation to the prior paper (arXiv:2605.02985) defining the inequality and ρ_eff should appear in the introduction and when first referencing Var(ln k), not only in the abstract.
- [time series analysis] The 1990-2022 time series figure would benefit from explicit labels for the between-country (-34%) and within-country (+26%) shifts and a note on data availability gaps in earlier years.
Simulated Author's Rebuttal
We thank the referee for the constructive comments, which help clarify the presentation of our empirical results. We respond to each major comment below and will incorporate the suggested improvements in the revised manuscript.
read point-by-point responses
-
Referee: [global results and dominance ratio calculation] The dominance ratio R and one-to-two orders of magnitude margin claim rest on the external range σ_ln k ∈ [0.18, 0.40] (abstract and global results). The manuscript applies this range and reports R ∈ [27, 134] but provides no independent derivation, sensitivity table, or test for values >0.45 (which would drop R below 10 and erode the margin). This parameter choice is load-bearing for the headline inequality confirmation.
Authors: The interval σ_ln k ∈ [0.18, 0.40] is taken from the established literature on log-income dispersion (e.g., studies of national and global income distributions). While the manuscript does not derive the interval internally, we will add a dedicated sensitivity table that recomputes R across an extended range of σ_ln k (including values up to 0.6). The table will explicitly show the point at which R drops below 10 and will discuss the empirical plausibility of higher values. This addition addresses the load-bearing nature of the parameter choice without changing the reported central results. revision: yes
-
Referee: [partial-identification and selection-bias bounds] § on partial identification: the 40-50% Chetty-style selection share is used to bound R in [14, 80], yet the exact adjustment to the variance estimator (how the 40-50% share modifies the computed Var(ln ρ_eff)) is not shown with an equation or step-by-step application to the three datasets. Without this, it is unclear whether larger unaccounted global selection bias could push R below the claimed margin.
Authors: We agree that the adjustment procedure requires explicit documentation. In the revision we will insert the precise scaling formula that reduces the observed Var(ln ρ_eff) by the selection share (40–50 %) to obtain the conservative lower bound on R. We will then apply the formula step-by-step to the Opportunity Atlas, World Bank GDP, and World Inequality Database samples, reporting the intermediate adjusted variances and the resulting R bounds for each dataset. This will allow readers to evaluate sensitivity to larger bias shares. revision: yes
Circularity Check
Minor self-citation to prior inequality; core variance computations independent from public data
full rationale
The paper directly computes Var(ln ρ_eff) from three external public datasets (Opportunity Atlas, World Bank, World Inequality Database) at four aggregation levels, producing concrete values such as the global 4.33. The dominance ratio R is obtained by dividing this by a stated plausible range for sigma_ln k. While the inequality Var(ln ρ_eff) >> Var(ln k) is referenced to arXiv:2605.02985, the numerical results and decompositions do not reduce to any quantities defined by construction in the prior work. The empirical content stands on independent external benchmarks and is therefore self-contained.
Axiom & Free-Parameter Ledger
free parameters (1)
- sigma_ln k range =
[0.18, 0.40]
axioms (1)
- standard math Variance of log variables can be directly decomposed across aggregation levels using public microdata.
Reference graph
Works this paper leans on
-
[1]
Sestak, K. (2026). The Dominance of Environment over Entity’s Capabilities.arXiv preprintarXiv:2605.02985, submitted 4 May 2026.https://arxiv.org/abs/2605. 02985
work page internal anchor Pith review Pith/arXiv arXiv 2026
-
[2]
Chetty, R., Hendren, N., Kline, P., Saez, E. (2014). Where is the Land of Opportunity? The Geography of Intergenerational Mobility in the United States.Quarterly Journal of Economics, 129(4), 1553–1623. doi:10.1093/qje/qju022
-
[3]
Chetty, R., Friedman, J.N., Hendren, N., Jones, M.R., Porter, S.R. (2018). The Opportunity Atlas: Mapping the Childhood Roots of Social Mobility.NBER Working Paper25147. doi:10.3386/w25147
-
[4]
Milanovic, B. (2015). Global Inequality of Opportunity: How Much of Our Income Is Determined by Where We Live?Review of Economics and Statistics, 97(2), 452–460. doi:10.1162/REST_a_00432
-
[5]
Lakner, C., Milanovic, B. (2016). Global Income Distribution: From the Fall of the Berlin Wall to the Great Recession.World Bank Economic Review, 30(2), 203–232. doi:10.1093/wber/lhv039
-
[6]
(2014).Capital in the Twenty-First Century
Piketty, T. (2014).Capital in the Twenty-First Century. Harvard University Press. ISBN 978-0-674-43000-6. doi:10.4159/9780674369542
-
[7]
Pluchino, A., Biondo, A.E., Rapisarda, A. (2018). Talent vs Luck: The Role of Ran- domness in Success and Failure.Advances in Complex Systems, 21(3–4), 1850014. doi:10.1142/S0219525918500145
-
[8]
Schmidt, F.L., Hunter, J.E. (1998). The Validity and Utility of Selection Methods in Personnel Psychology: Practical and Theoretical Implications of 85 Years of Research Findings.Psychological Bulletin, 124(2), 262–274. doi:10.1037/0033-2909.124.2.262
-
[9]
(2026).World Inequality Database (WID.world), bulk download (April 2026 release).https://wid
Alvaredo, F., Chancel, L., Piketty, T., Saez, E., Zucman, G., et al. (2026).World Inequality Database (WID.world), bulk download (April 2026 release).https://wid. world/
work page 2026
-
[10]
World Bank (2022).World Development Indicators:NY.GDP.PCAP.PP.KD, SP.POP.TOTL,SI.POV.GINI.https://data.worldbank.org/. 13
work page 2022
-
[11]
OECD (2013, 2019).Programme for the International Assessment of Adult Compe- tencies (PIAAC), Survey of Adult Skills.https://www.oecd.org/skills/piaac/
work page 2013
-
[12]
Hanushek, E.A., Woessmann, L. (2012). Do Better Schools Lead to More Growth? Cognitive Skills, Economic Outcomes, and Causation.Journal of Economic Growth, 17(4), 267–321. doi:10.1007/s10887-012-9081-x. 14
discussion (0)
Sign in with ORCID, Apple, or X to comment. Anyone can read and Pith papers without signing in.