Recognition: 2 theorem links
· Lean TheoremAcidification of Water by CO2
Pith reviewed 2026-05-13 03:34 UTC · model grok-4.3
The pith
Increasing atmospheric CO2 causes only minor pH drops in natural waters because alkalinity and dissolved carbon dioxide strongly buffer the system.
A machine-rendered reading of the paper's core claim, the machinery that carries it, and where it could break.
Core claim
Fundamental inorganic chemistry shows that increasing concentrations of atmospheric CO2 will have no harmful effect on organisms that live in the natural waters of the Earth and may well benefit them, since alkalinity and dissolved CO2 give high buffering capacity to most natural waters and minimize the change of pH from external influences; doubling atmospheric CO2 from 430 ppm to 860 ppm reduces the pH of representative seawater at 25 C from 8.18 to 7.93.
What carries the argument
The buffering capacity provided by the coupled equilibria among dissolved CO2, bicarbonate ions, carbonate ions, and total alkalinity, which limits pH response to added atmospheric CO2.
If this is right
- Doubling atmospheric CO2 produces only a 0.25-unit pH drop in typical seawater at 25 C.
- The predicted pH change equals or is smaller than natural diurnal swings from photosynthesis and respiration.
- pH already varies more across ocean latitudes, longitudes, and depths than the change from doubled CO2.
- Increased dissolved inorganic carbon from higher CO2 may benefit rather than harm aquatic organisms.
- The same buffering chemistry applies to freshwater systems and groundwater calcium carbonate transport.
Where Pith is reading between the lines
- If the buffering calculation holds, then concerns focused solely on average pH decline from atmospheric CO2 may overlook larger local drivers of pH variability.
- The small predicted change suggests that any observed biological responses in the field are more likely tied to temperature, nutrients, or pollution than to the CO2-driven pH shift itself.
- Similar equilibrium reasoning could be applied to predict pH stability in lakes or rivers under rising CO2 without needing new models.
Load-bearing premise
That a fixed representative seawater composition, constant temperature, and unchanging alkalinity accurately describe the conditions experienced by living organisms without major interference from local biological activity or other unmodeled processes.
What would settle it
Direct measurements showing that real open-ocean pH falls by substantially more than 0.25 units as atmospheric CO2 approaches 860 ppm, or controlled experiments demonstrating clear harm to representative marine organisms from exactly that 0.25-unit pH shift under otherwise natural conditions.
Figures


read the original abstract
Fundamental inorganic chemistry shows that increasing concentrations of atmospheric CO2 will have no harmful effect on organisms that live in the natural waters of the Earths, and may well benefit them. Alkalinity and dissolved CO2 give high buffering capacity to most natural waters and minimize the change of pH from external influences. For example, doubling the atmospheric concentration of CO2 from 430 ppm to 860 ppm would reduce the pH of representative sea water at a temperature of 25 C from pH = 8.18 to pH = 7.93. This change is comparable to diurnal pH changes in biologically productive surface waters, due to photosynthetic fixation of dissolved inorganic carbon during the day and respiration at night. The change is also less than the variations of pH with latitude, longitude and depth in the oceans. This paper includes a quantitative review of the carbonate chemistry of seawater and freshwater, the buffering capacity, the Revelle factor, the transport of calcium carbonate in ground water, the formation of flowstone, and the classic use of limewater to detect gaseous CO2. The paper concludes with a brief review of those parts of chemical thermodynamics that are involved in ocean acidification.
Editorial analysis
A structured set of objections, weighed in public.
Referee Report
Summary. The manuscript claims that fundamental inorganic chemistry demonstrates increasing atmospheric CO2 will have no harmful effect on organisms in natural waters and may benefit them, owing to the high buffering capacity provided by alkalinity and dissolved CO2. It calculates that doubling CO2 from 430 ppm to 860 ppm lowers representative seawater pH at 25°C from 8.18 to 7.93, a shift comparable to diurnal biological variations and smaller than spatial/depth variations in the oceans. The paper provides a quantitative review of seawater and freshwater carbonate chemistry, buffering capacity, the Revelle factor, CaCO3 transport in groundwater, flowstone formation, limewater detection of CO2, and relevant chemical thermodynamics.
Significance. If the pH calculations are accurate and the fixed-parameter assumptions hold under realistic conditions, the work could usefully highlight natural buffering and variability in the carbonate system, providing a counterpoint to some ocean-acidification impact narratives. The review of standard equilibrium concepts and the Revelle factor is a strength, but the organism-level conclusion depends on untested extrapolation from constant-alkalinity, fixed-temperature conditions.
major comments (2)
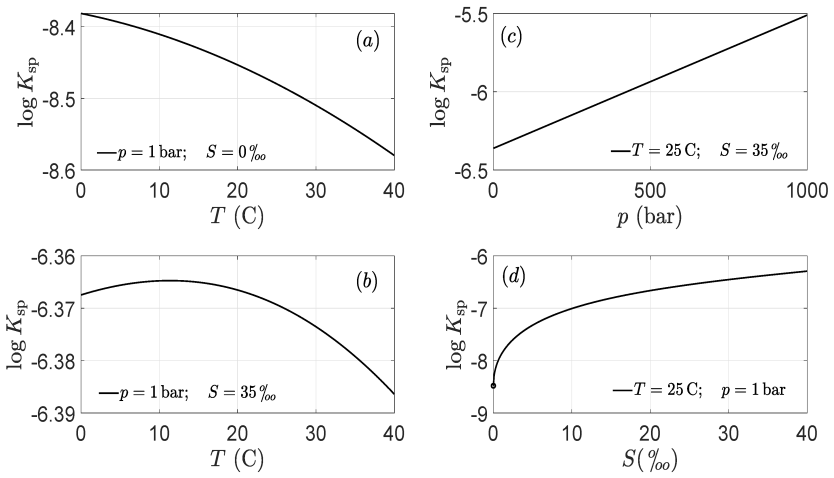
- [Abstract and quantitative review of carbonate chemistry of seawater] The central claim that the 0.25-unit pH drop implies no harm (and possible benefit) to organisms rests on the representative seawater model with fixed total alkalinity, fixed DIC speciation, and constant 25°C temperature with no biological modulation. The manuscript does not provide sensitivity tests showing the modeled pH shift remains within tolerance when alkalinity varies by ±20% or when diurnal biological DIC/alkalinity cycles are superimposed on the anthropogenic baseline.
- [Abstract and section on buffering capacity and Revelle factor] The specific pH values 8.18 and 7.93 (and the doubling calculation) are stated without explicit derivation, source equilibrium constants, or error analysis in the provided text. This makes it impossible to verify whether post-hoc choices of representative conditions affect the central numbers, as required for the no-harm conclusion.
minor comments (3)
- [Abstract] The abstract contains the typographical error 'Earths' (should be 'Earth's').
- [Quantitative review sections] Define the exact numerical values of total alkalinity, salinity, and initial DIC used for the 'representative sea water' example, and state the equilibrium constants and temperature dependence explicitly.
- [Section on the Revelle factor] Clarify whether the Revelle factor discussion includes any new calculation or is purely a review of the standard definition.
Simulated Author's Rebuttal
We thank the referee for their constructive and detailed comments, which help clarify the presentation of our quantitative review of carbonate chemistry. We address each major comment below and will revise the manuscript to enhance transparency and robustness while preserving the core focus on inorganic equilibrium calculations.
read point-by-point responses
-
Referee: The central claim that the 0.25-unit pH drop implies no harm (and possible benefit) to organisms rests on the representative seawater model with fixed total alkalinity, fixed DIC speciation, and constant 25°C temperature with no biological modulation. The manuscript does not provide sensitivity tests showing the modeled pH shift remains within tolerance when alkalinity varies by ±20% or when diurnal biological DIC/alkalinity cycles are superimposed on the anthropogenic baseline.
Authors: We agree that explicit sensitivity tests would strengthen the robustness of the representative-case illustration. The manuscript already notes that the calculated pH shift is comparable to natural diurnal biological cycles and spatial/depth variations, which implicitly encompass alkalinity differences and biological modulation. To directly respond, we will add a new subsection with sensitivity calculations: pH changes for total alkalinity varied by ±20% around the representative value, and scenarios superimposing typical diurnal DIC/alkalinity swings on the doubled-CO2 baseline. These will confirm the anthropogenic shift remains small relative to natural ranges under varied conditions. revision: yes
-
Referee: The specific pH values 8.18 and 7.93 (and the doubling calculation) are stated without explicit derivation, source equilibrium constants, or error analysis in the provided text. This makes it impossible to verify whether post-hoc choices of representative conditions affect the central numbers, as required for the no-harm conclusion.
Authors: We acknowledge that the initial submission did not include sufficient step-by-step derivation or sourcing. The values derive from standard seawater carbonate equilibria (using constants such as those compiled by Millero et al. for 25°C, salinity 35, and representative alkalinity ~2300 μmol/kg with appropriate DIC). In the revised manuscript we will insert an explicit derivation section with the full set of equilibrium equations, the precise constants and their literature sources, the input parameters chosen for the representative case, and a short error/sensitivity analysis showing how pH responds to small variations in constants or inputs. revision: yes
Circularity Check
No circularity; derivation uses independent equilibrium constants
full rationale
The paper derives pH shifts from CO2 doubling by applying standard, externally tabulated equilibrium constants for the carbonate system (K1, K2, Kw) together with the Revelle factor and fixed representative alkalinity at 25 C. These inputs are not fitted or redefined within the manuscript, nor do any equations reduce the reported pH drop (8.18 to 7.93) to a quantity constructed from the paper's own outputs. No self-citations appear in the load-bearing steps, and the quantitative review of buffering, CaCO3 transport, and thermodynamics rests on classical results rather than renaming or smuggling prior author-specific ansatzes. The central claim therefore remains self-contained against external benchmarks.
Axiom & Free-Parameter Ledger
axioms (2)
- domain assumption Equilibrium constants for the carbonate system in water apply under natural conditions
- domain assumption Natural waters maintain sufficient alkalinity to provide effective buffering
Lean theorems connected to this paper
-
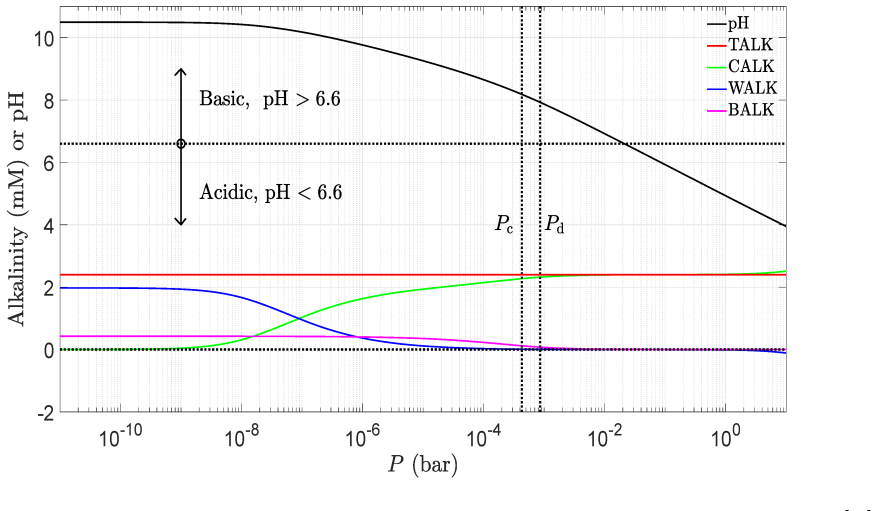
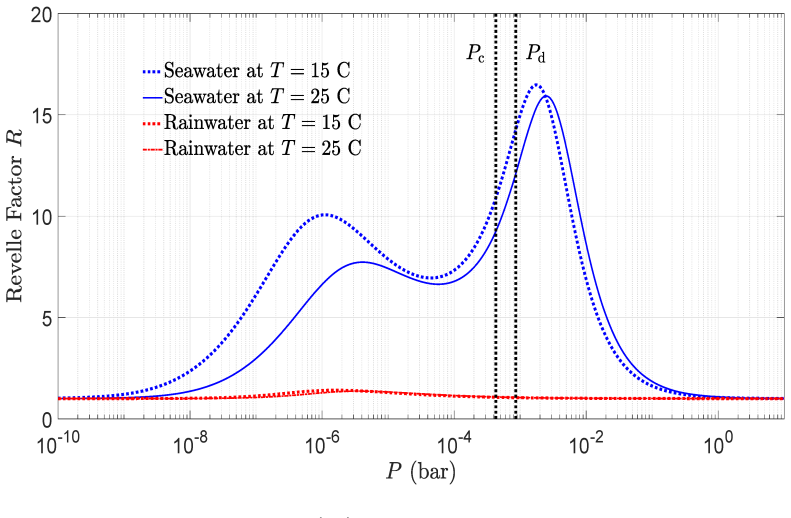
IndisputableMonolith/Cost/FunctionalEquation.leanwashburn_uniqueness_aczel unclearEq. (57) quartic seawater polynomial for [H+] given [A], [B], P; titration curves Fig. 11; Revelle factor 1/R = ∂ln[DIC]/∂lnP
-
IndisputableMonolith/Foundation/AlphaCoordinateFixation.leanJ_uniquely_calibrated_via_higher_derivative unclearBuffering coefficient β (75) and Ostwald L (90) computed from equilibrium constants at fixed T,S
Reference graph
Works this paper leans on
-
[1]
R. Cohen and W. Happer,Fundamentals of Ocean pH. https://co2coalition.org/wp-content/uploads/2021/11/ 2015-Cohen-Happer-Fundamentals-of-Ocean-pH.pdf
work page 2021
-
[2]
Kelvin on Measurement,Electrical Units of Measurements https://www.cambridge.org/core/books/abs/popular-lectures-and-addresses/ electrical-units-of-measurement/621B298BAD428F96B446A17CC2FACF4F
-
[3]
G. E. Hofmannet al.(2011),High-Frequency Dynamics of Ocean pH: A Multi-Ecosystem Comparison.PLoSONE6(12):e28983.doi:10.1371/journal.pone.0028983
-
[4]
P. L. Jokiel, C. P. Jury and I. B. Kuffner,Coral Calcification and Ocean Acidification D.K. Hubbard et al. (eds.),Coral Reefs at the Crossroads, Coral Reefs of the World6. DOI10.1007/978-94-017-7567-0_2
-
[5]
R. H. Byrneet al.,Direct observations of basin-wide acidification of the North Pacific Ocean, Geophys. Res. Lett.37, L02601 (2010). https://agupubs.onlinelibrary.wiley.com/doi/full/10.1029/2009GL040999 55
-
[6]
The Biological Pump, https://en.wikipedia.org/wiki/Biological_pump
-
[7]
The Lysocline, https://en.wikipedia.org/wiki/Lysocline
-
[8]
The Thermohaline Circulation, https://en.wikipedia.org/wiki/Thermohaline_circulation
-
[9]
J. C. Phillipset al.,The Potential for CO 2-Induced Acidification in Freshwater Lakes: A Great Lakes Case Study, Oceanography,28, 136 (2015). https://tos.org/oceanography/assets/docs/28-2_phillips.pdf
work page 2015
- [10]
-
[11]
P. Delmelle and A. Bernard,Geochemistry, minerology, and chemical modeling of the acid crater lake of Kawah Ijen Volcano, Indonesia, Geochimica et Cosmochemica Acta, 48, No. 11, p. 2445 (1994)
work page 1994
-
[12]
K. D. Duboiset al.,Isotopic constraints on alkalinity, dissolved inorganic carbon, and at- mospheric carbon dioxide fluxes in the Mississippi River, J. Geophys. Res.115, G20218 (2010). https://agupubs.onlinelibrary.wiley.com/doi/epdf/10.1029/2009JG001102
-
[13]
Surface alkalinity of the Oceans, https://en.wikipedia.org/wiki/Alkalinity
-
[14]
G. L. Macpherson,CO 2 distribution in groundwater and the impact of groundwater extraction on the global C cycle, Chemical Geology264, 328 (2009). https://www.sciencedirect.com/science/article/pii/S0009254109001399
work page 2009
-
[15]
W. F. Giggenbach,Water and gas chemistry of Lake Nyos and its bearing on the eruptive process, Journal of Volcanology and Geothermal Research,42, 337-362 (1990)
work page 1990
-
[16]
CO 2 Partial Pressure in Champagne, https://hypertextbook.com/facts/2003/PeterHui.shtml
work page 2003
-
[17]
Self-ionization of water, https://en.wikipedia.org/wiki/Self-ionization_of_water#Dependence_on_ temperature,_pressure_and_ionic_strength
-
[18]
D. K. Nordstrom, C. N. Alpers, C. J. Ptacek and D. W. Blowes,Negative pH and Extremely Acidic Mine Waters from Iron Mountain, California, Environ. Sci. Technol. 34, 254 (2000). https://www.researchgate.net/publication/231292023_Negative_pH_and_ Extremely_Acidic_Mine_Waters_from_Iron_Mountain_California 56
-
[19]
Calcium Carbonate, https://en.wikipedia.org/wiki/Calcium_carbonate
-
[20]
K. G. Schulzet al.,Determination of the rate constants for the carbon dioxide to bicar- bonate inter-conversion in pH-buffered seawater systems, Marine Chemistry,100, 53-65 (2006).https://epic.awi.de/id/eprint/13960/1/Sch2006g.pdf
work page 2006
- [21]
-
[22]
A. G. Dickson,Thermodynamics of the dissociation of boric acid in synthetic seawater from 273.15 to 318.15 K, Marine Chemistry73,113 (2001)
work page 2001
-
[23]
R. W. Clark and J. M. Bonicamp,TheK sp-Solubility Conundrum, J. Chem. Ed.,75, 1182 (2008)
work page 2008
-
[24]
Solubility equilibrium,https://en.wikipedia.org/wiki/Solubility_equilibrium
-
[25]
Aragonite Seas,https://en.wikipedia.org/wiki/Aragonite_sea
-
[26]
Calcite Sea,https://en.wikipedia.org/wiki/Calcite_sea
-
[27]
W. Broecker and J. Yu,What do we know about the evolution of Mg and Ca ratios in seawater?, Paleoceanography,26, PA3203 (2011). https://agupubs.onlinelibrary.wiley.com/doi/full/10.1029/2011PA002120
-
[28]
A. Mucci,The solubility of calcite and aragonite in seawater at various salinities, tem- peratures, and at one total atmospheric pressure, Am. Jour. Sci.283, 780 (1983)
work page 1983
- [29]
-
[30]
R. F. Weiss,Carbon Dioxide in Water and Seawater: The Solubility of a Non-ideal Gas, Marine Chemistry2, 203 (1974)
work page 1974
-
[31]
H. S. Harned and R. Davis, Jr.,The Ionization Constant of Carbonic Acid in Water and the Solubility of Carbon Dioxide in Water in Aqueous Salt Solutions from 0 to 50 ◦, J. Am. Chem. Soc.65, 2030 (1943)
work page 2030
-
[32]
H. S. Harned and S. R. Scholes, Jr.,The ionization constant of HCO − 3 from 0 to 50 ◦, J. Am. Chem. Soc.63, 2030 (1941)
work page 2030
-
[33]
C. Mehrbach, C. H. Culberson, J. E. Hawley and R. M. Pytkowicz,Measurement of the Apparent Dissociation Constants of Carbonic Acid in Seawater at Atmospheric Pressure, Limnology and Oceanography18, 897 (1973)
work page 1973
-
[34]
Solubility table,https://en.wikipedia.org/wiki/Solubility_table#C 57
-
[35]
H. Wattenberg and E. Timmermann,Die L¨ oslichkeit von Magnesiumkarbonat und Strontyiumkarbonat in Seewasser, Meeresk¨ unliche Arbeiten der Universit¨ at Kiel Nr. 23, (1937). https://oceanrep.geomar.de/id/eprint/55010/1/Wattenberg%2CH_Timmermann% 2CE_Bd.2_1937.pdf
work page 1937
-
[36]
Factors that affect solubility, https://chem.libretexts.org/Courses/Heartland_Community_College/HCC% 3A_Chem_162/17%3A_Solubility_Equilibria/17.3%3A_Factors_that_Affect_ Solubility
-
[37]
Dissolved Inorganic Carbon, https://en.wikipedia.org/wiki/Dissolved_inorganic_carbon
-
[38]
Bjerrum Plot, https://en.wikipedia.org/wiki/Bjerrum_plot
-
[39]
J. Wright and A. Colling,Seawater: Its Composition, Properties and Behavior, Butterworth-Heineman (1989), The Open University.https://www.sciencedirect. com/science/article/pii/S0048969723065385. [40]Alkalinity and Water, https://www.usgs.gov/water-science-school/science/alkalinity-and-water
work page 1989
-
[40]
T. M. Edwardset al.,Ammonia and aquatic ecosystems – A review of global sources, biogeochemical cycling and the effects on fish, Science of the Total Environment,907 167911 (2024)
work page 2024
-
[41]
Solubility of Carbon Dioxide-CO 2-in Water, https://www.engineeringtoolbox.com/gases-solubility-water-d_1148.html
-
[42]
R. M. Pytkowicz,Calcium carbonate retention in supersaturated seawater, Amer- ican Journal of Science,273, 515 (1973).https://ajsonline.org/article/ 59625-calcium-carbonate-retention-in-supersaturated-seawater.pdf
work page 1973
-
[43]
S. N. Brand˜ aoet al. Review of Ostracoda (Crustacea) living below the Carbonate Com- pensation Depth and the deepest record of a calcified ostracod, Progress in Oceanography, 178102144 (2019)
work page 2019
-
[44]
Buffering Capacity,https://www.usgs.gov/water-science-school/science/ alkalinity-and-water
-
[45]
Battino,The Ostwald coefficient of gas solubility, Fluid Phase Equilibria15, Issue 3, 231-240 (1984)
R. Battino,The Ostwald coefficient of gas solubility, Fluid Phase Equilibria15, Issue 3, 231-240 (1984)
work page 1984
-
[46]
The Revelle factor,https://en.wikipedia.org/wiki/Revelle_factor
-
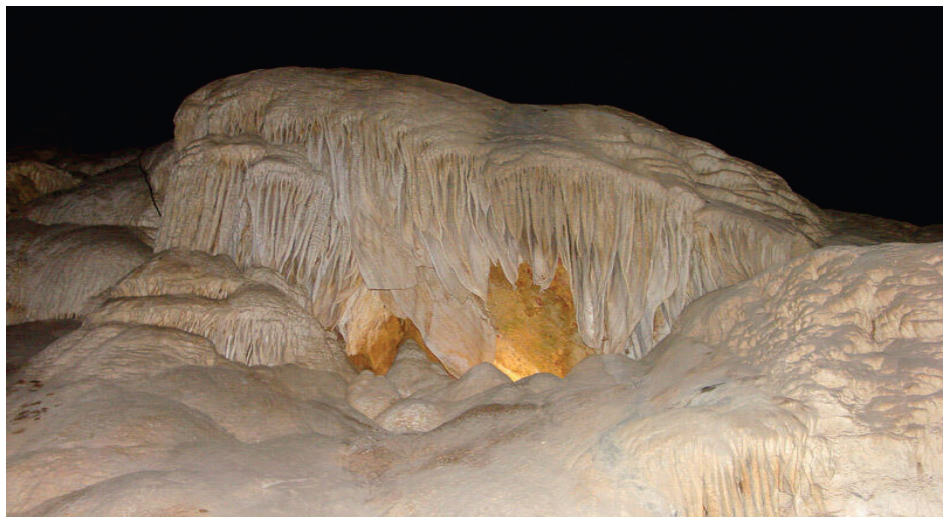
[47]
Flowstone in Carlsbad Caverns, https://www.usgs.gov/media/images/carlsbad-caverns-flowstone 58
-
[48]
CO 2 Emissions,https://www.iea.org/reports/global-energy-review-2025/ co2-emissions
work page 2025
-
[49]
Limewater-breath experiment, https://biology-igcse.weebly.com/inspired-expired-air.html
-
[50]
M. Cornell,An Experiment in Ocean Acidification: Why Buffering Matters, https://co2coalition.org/wp-content/uploads/2024/03/ Teaching-Ocean-Acidification.pdf [52]Water Quality Analysis, https://newsroom.heb.com/wp-content/uploads/2018/01/ HEB-Water-Quality-Report-English_020323-lr66.pdf [53]Bromothymol Blue Indicator Dye, https://en.wikipedia.org/wiki/Bro...
work page 2024
-
[51]
Conchiolin,https://en.wikipedia.org/wiki/Conchiolin
-
[52]
Chemical potential,https://en.wikipedia.org/wiki/Thermodynamic_activity
-
[53]
Exergonic and endorgonic reactions,https://chemistry.stackexchange.com/ questions/5568/difference-between-exothermic-and-exergonic
-
[54]
Solubility,https://en.wikipedia.org/wiki/Solubility
-
[55]
Hydrolysis of ATP,https://en.wikipedia.org/wiki/ATP_hydrolysis
-
[56]
Citric acid cycle,https://en.wikipedia.org/wiki/Citric_acid_cycle
-
[57]
Equilibrium constant,https://en.wikipedia.org/wiki/Equilibrium_constant
-
[58]
Enthalpy of hydration, https://chem.libretexts.org/Courses/Northern_Michigan_University/CH_215% 3A_Chemistry_of_the_Elements_Fall_2023/05%3A_Solids_and_Solid-State_ Chemistry/5.08%3A_Enthalpy_of_Hydration
-
[59]
B. P. Boudreau, J. J. Middleburg and F. J. R. Meysman, Carbonate compensation dynamics, Geophys. Res. Lett.37, L03603 (2010). doi:10.1029/2009GL041847
-
[60]
Le Chatelier’s principle, https://en.wikipedia.org/wiki/Le_Chatelier%27s_principle 59
discussion (0)
Sign in with ORCID, Apple, or X to comment. Anyone can read and Pith papers without signing in.