Recognition: 1 theorem link
· Lean TheoremAnalyzing the Impact of Release Season and Production Budget on Movie Revenue and Profitability
Pith reviewed 2026-05-14 21:05 UTC · model grok-4.3
The pith
Release season has limited effect on movie revenue compared to production budget and popularity.
A machine-rendered reading of the paper's core claim, the machinery that carries it, and where it could break.
Core claim
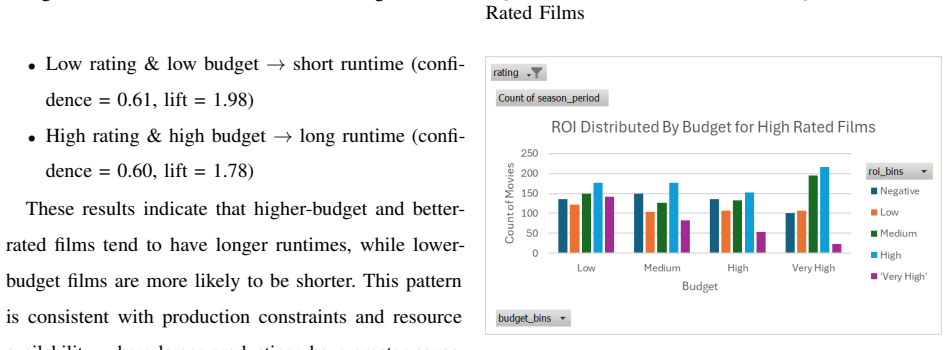
Applied to the Full TMDB Movies Dataset 2024, association rule mining links high-budget films with poor ratings to negative ROI outcomes. Random forest regression reaches an R squared of 0.652, outperforming decision trees, while SHAP analysis identifies production budget and popularity as the dominant drivers of revenue. Release-season variables contribute minimally to either revenue or ROI predictions.
What carries the argument
The combination of association rule mining and SHAP-augmented random forest regression on TMDB data, which isolates the relative influence of budget, popularity, ratings, and seasonal timing on financial outcomes.
If this is right
- Studios can de-emphasize seasonal release strategies in favor of budget allocation and popularity-building efforts.
- High-budget projects paired with low audience ratings carry elevated risk of negative returns.
- Random forest models using budget and popularity inputs can forecast revenue with moderate accuracy.
- Financial risk management should prioritize investment size and market attention over calendar placement.
Where Pith is reading between the lines
- Marketing spend aimed at raising popularity scores could yield higher returns than optimizing release timing.
- The same patterns might appear in other content industries where audience data and production costs are observable.
- Independent producers facing budget constraints may face structural disadvantages regardless of when they release.
Load-bearing premise
That the correlations observed in the TMDB dataset capture stable drivers of revenue rather than effects of omitted variables or how the data were selected and modeled.
What would settle it
A fresh sample of films in which release month or quarter remains a strong revenue predictor after controlling for budget, popularity, and ratings would undermine the limited-influence claim.
Figures


read the original abstract
The film industry is characterized by significant financial uncertainty, where large production investments do not always guarantee commercial success. This study analyzes the relationship between release season, production budget, and movie financial performance using the Full TMDB Movies Dataset 2024. A data mining framework incorporating association rule mining, clustering, machine learning, and SHAP analysis was applied to identify key drivers of revenue and profitability. The results show that release season has limited predictive influence on revenue and return on investment (ROI). In contrast, production budget, popularity, and audience ratings are significantly more influential. Association rule mining revealed that high-budget films with poor ratings are strongly associated with negative ROI outcomes. Random Forest regression achieved substantially stronger predictive performance than Decision Tree regression, with an $R^2$ value of 0.652. SHAP analysis further confirmed that budget and popularity are the dominant predictors of box office revenue, while timing-related variables contribute minimally. These findings suggest that financial success in the film industry is driven more by production investment and market attention than by seasonal release strategies, providing practical insights for budgeting, release planning, and financial risk management.
Editorial analysis
A structured set of objections, weighed in public.
Referee Report
Summary. The paper claims that analysis of the TMDB Movies Dataset using association rule mining, clustering, Random Forest and Decision Tree regression, and SHAP values shows release season has limited predictive influence on movie revenue and ROI, while production budget, popularity, and audience ratings are dominant drivers; Random Forest achieves R²=0.652 and high-budget poor-rating films are linked to negative ROI.
Significance. If the empirical associations prove robust to endogeneity and validation checks, the work would offer practical guidance for film budgeting and risk management by downplaying seasonal release strategies relative to investment and market attention factors.
major comments (3)
- [Abstract / Methods] Abstract and Methods: the Random Forest R²=0.652 is reported without cross-validation details, baseline comparisons beyond Decision Trees, error bars, or robustness checks on data exclusions or splits, leaving predictive stability unverified.
- [Results / Discussion] Results / Discussion: the headline claim that release season exerts limited influence treats budget and timing as exogenous, yet studios choose them strategically conditional on expected revenue, genre, and competition; without studio fixed effects, instruments, or pre-release covariates the SHAP rankings and null seasonal result are vulnerable to omitted-variable bias and post-release leakage in popularity/ratings.
- [Association rule mining] Association rule mining section: rules linking high-budget poor ratings to negative ROI are presented without sensitivity checks to alternative support/confidence thresholds or to sample restrictions that might alter the discovered patterns.
minor comments (2)
- Clarify the exact definition of ROI and how missing budget or revenue observations were handled in the TMDB sample.
- Add citations to prior econometric literature on movie revenue determinants for context.
Simulated Author's Rebuttal
We thank the referee for the constructive comments, which have helped strengthen the robustness and transparency of our analysis. We have revised the manuscript to incorporate additional validation details, sensitivity checks, and an expanded discussion of limitations while preserving the core predictive findings.
read point-by-point responses
-
Referee: [Abstract / Methods] the Random Forest R²=0.652 is reported without cross-validation details, baseline comparisons beyond Decision Trees, error bars, or robustness checks on data exclusions or splits, leaving predictive stability unverified.
Authors: We agree that these details strengthen the presentation. In the revised manuscript we now report 5-fold cross-validation results for the Random Forest (mean R² = 0.652, std = 0.018), add baseline comparisons with linear regression and gradient boosting, include error bars derived from the cross-validation folds, and provide appendix tables showing stability across alternative train-test splits and outlier exclusions. revision: yes
-
Referee: [Results / Discussion] the headline claim that release season exerts limited influence treats budget and timing as exogenous, yet studios choose them strategically conditional on expected revenue, genre, and competition; without studio fixed effects, instruments, or pre-release covariates the SHAP rankings and null seasonal result are vulnerable to omitted-variable bias and post-release leakage in popularity/ratings.
Authors: We acknowledge the endogeneity concern and the strategic nature of release decisions. Our analysis is predictive rather than causal; SHAP values reflect feature importance within the fitted models. We have added genre controls and a dedicated limitations paragraph noting the absence of studio fixed effects and instruments in the TMDB data. The limited seasonal contribution remains stable across specifications, but we agree this does not rule out omitted-variable bias and flag it for future work. revision: partial
-
Referee: [Association rule mining] rules linking high-budget poor ratings to negative ROI are presented without sensitivity checks to alternative support/confidence thresholds or to sample restrictions that might alter the discovered patterns.
Authors: We have performed the requested sensitivity checks. The revised section reports results for support thresholds 0.005–0.02 and confidence thresholds 0.65–0.85, plus subsample restrictions by genre and release decade. The key rule associating high-budget, low-rating films with negative ROI persists across these variations and is now accompanied by the corresponding lift and conviction metrics. revision: yes
Circularity Check
No significant circularity in empirical ML analysis
full rationale
The paper applies standard data-mining and ML techniques (association rules, clustering, Random Forest/Decision Tree regression, SHAP) directly to the TMDB cross-section. Reported results such as R^2 = 0.652, SHAP rankings, and the limited role of release season are direct outputs of fitted models on observed features; no equations, derivations, or first-principles claims are present that reduce to fitted parameters or self-citations by construction. The analysis is self-contained and reports conventional performance metrics without renaming known results or importing uniqueness theorems.
Axiom & Free-Parameter Ledger
axioms (1)
- domain assumption The Full TMDB Movies Dataset 2024 is representative of the broader film industry without systematic selection or reporting bias.
Lean theorems connected to this paper
-
IndisputableMonolith/Foundation/ArithmeticFromLogic.leanreality_from_one_distinction unclear?
unclearRelation between the paper passage and the cited Recognition theorem.
Random Forest regression achieved substantially stronger predictive performance than Decision Tree regression, with an R² value of 0.652. SHAP analysis further confirmed that budget and popularity are the dominant predictors of box office revenue, while timing-related variables contribute minimally.
What do these tags mean?
- matches
- The paper's claim is directly supported by a theorem in the formal canon.
- supports
- The theorem supports part of the paper's argument, but the paper may add assumptions or extra steps.
- extends
- The paper goes beyond the formal theorem; the theorem is a base layer rather than the whole result.
- uses
- The paper appears to rely on the theorem as machinery.
- contradicts
- The paper's claim conflicts with a theorem or certificate in the canon.
- unclear
- Pith found a possible connection, but the passage is too broad, indirect, or ambiguous to say the theorem truly supports the claim.
Reference graph
Works this paper leans on
-
[1]
Paramount on Hollywood Accounting Thirty Years Later , author=
Under the Spotlight: The Effects of Buchwald v. Paramount on Hollywood Accounting Thirty Years Later , author=
-
[2]
(No Title) , year=
Movie money: Understanding Hollywood's (creative) accounting practices , author=. (No Title) , year=
-
[3]
Anthony and Garcia, Joshua R
Movie Sequel Marketing and Predictive Analytics: An Empirical Study on Movie Sequel Marketing Analytics on Marvel’s, Wakanda Forever with Moviegoers , author=. Anthony and Garcia, Joshua R. and Olagundoye, Eniola and Tymann, Nathan , year=
-
[4]
The Box Office and the Long Tail: An Examination of the Effects of Streaming on the Distribution of Box Office Revenue , author=
-
[5]
The Economics of Movies (Revisited):
McKenzie, Jordi , date =. The Economics of Movies (Revisited):
-
[6]
Modern Economy , volume=
Modeling Influencing Factors in US Film Success (1940--2024) , author=. Modern Economy , volume=. 2024 , publisher=
1940
-
[7]
The Rand journal of economics , volume=
Seasonality in the US motion picture industry , author=. The Rand journal of economics , volume=. 2007 , publisher=
2007
-
[8]
Early Predictions of Movie Success: the Who, What, and When of Profitability
Michael T. Lash and Kang Zhao , title =. CoRR , volume =. 2015 , url =. 1506.05382 , timestamp =
work page internal anchor Pith review Pith/arXiv arXiv 2015
discussion (0)
Sign in with ORCID, Apple, or X to comment. Anyone can read and Pith papers without signing in.