Decision Support for Marketplace Policies under Incomplete Evidence: From Replay to Launch Readiness
Pith reviewed 2026-06-30 21:59 UTC · model grok-4.3
The pith
A decision-support system for RTB marketplace policies selects a margin-gated floor policy for online validation rather than direct launch when evidence on propensities and interference remains incomplete.
A machine-rendered reading of the paper's core claim, the machinery that carries it, and where it could break.
Core claim
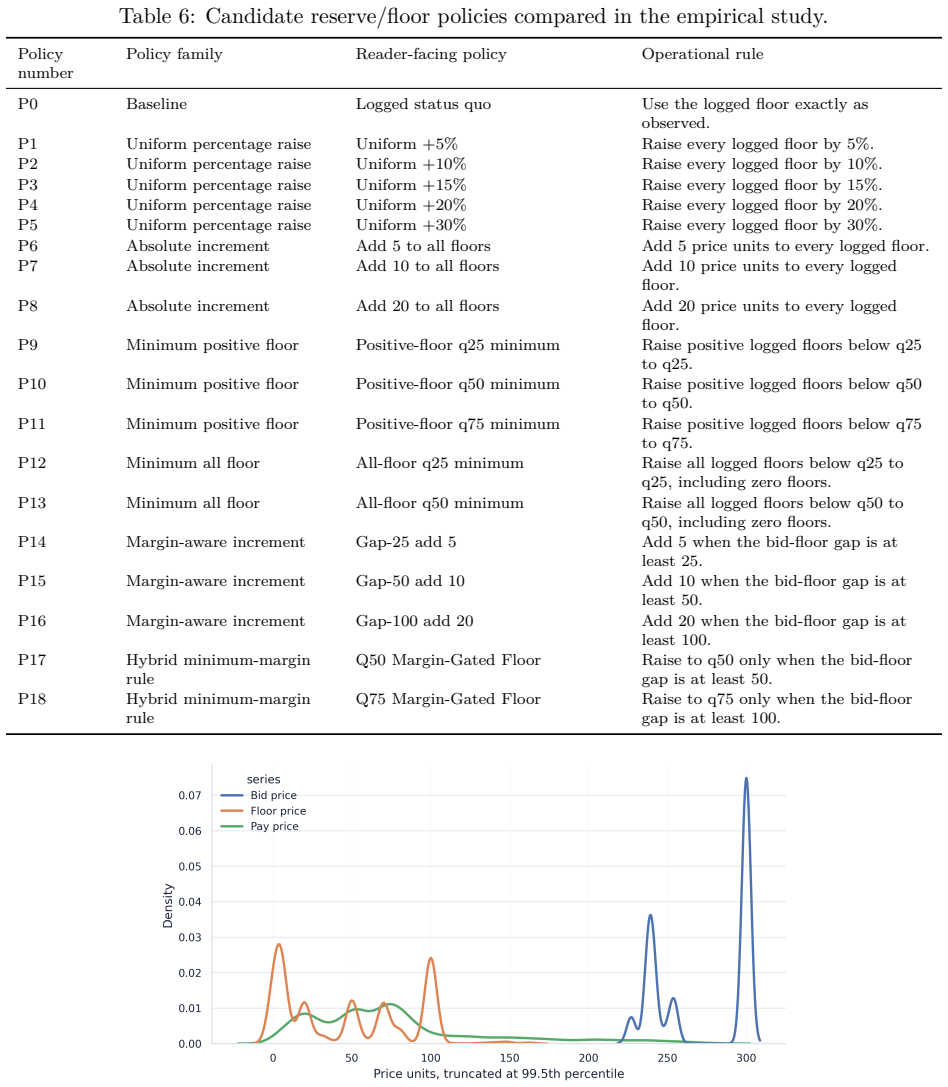
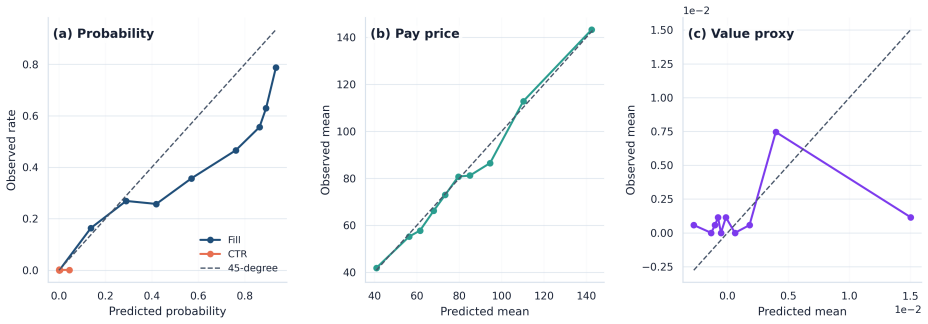
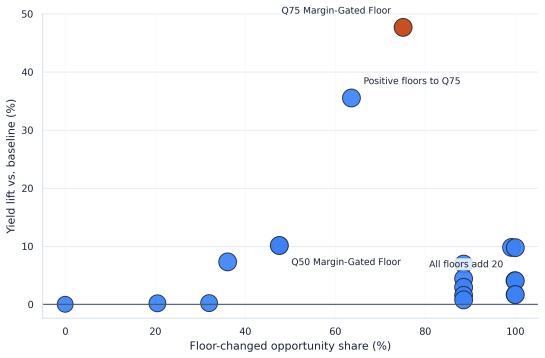
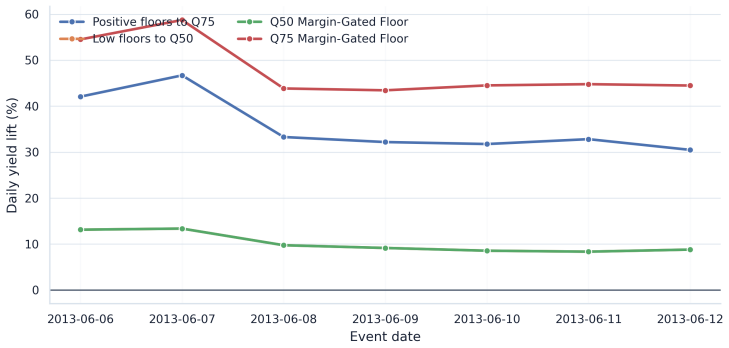
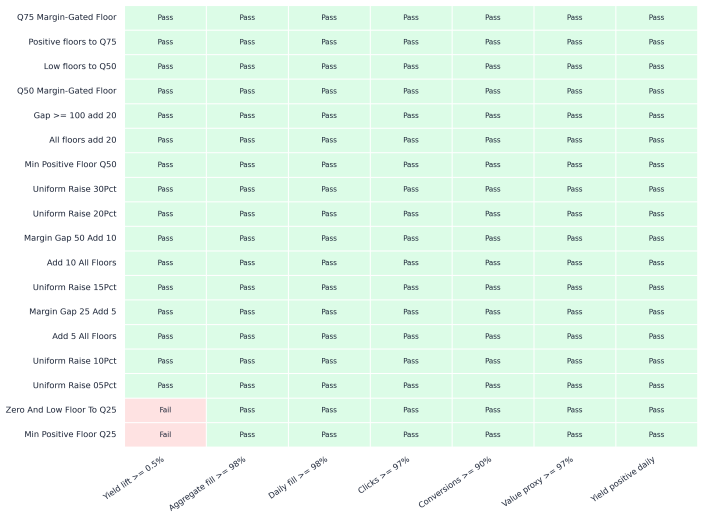
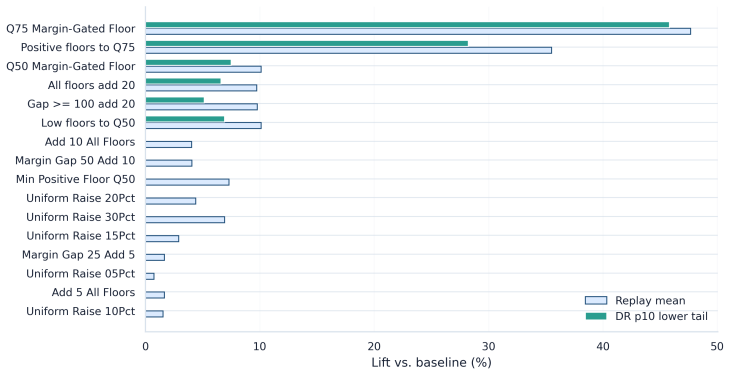
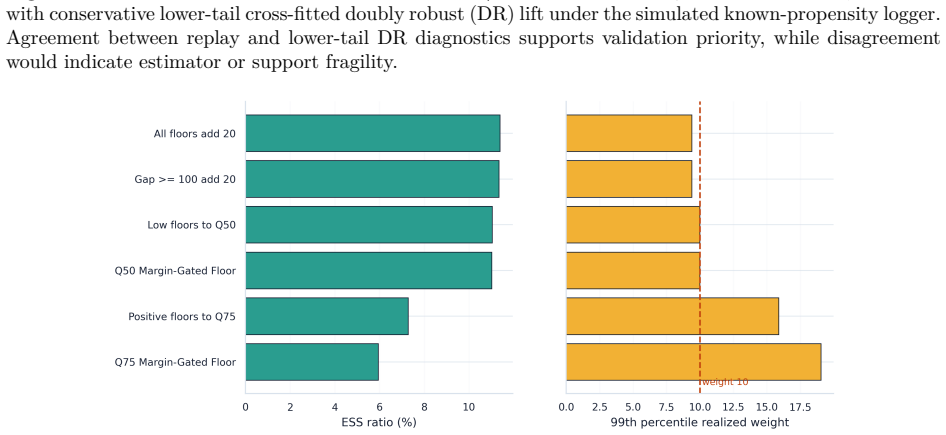
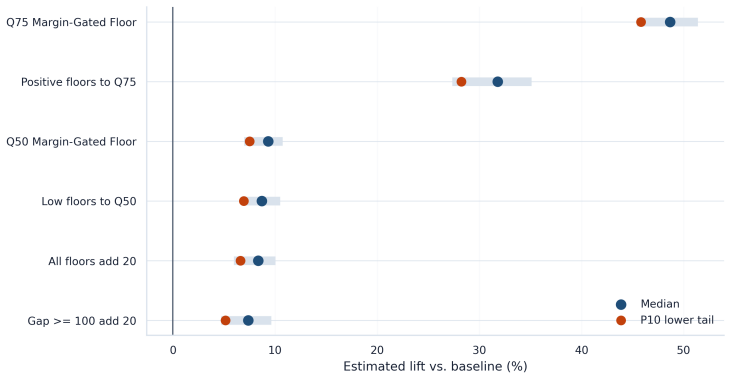
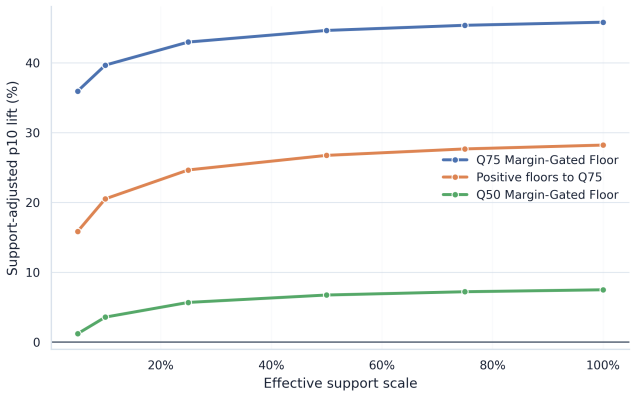
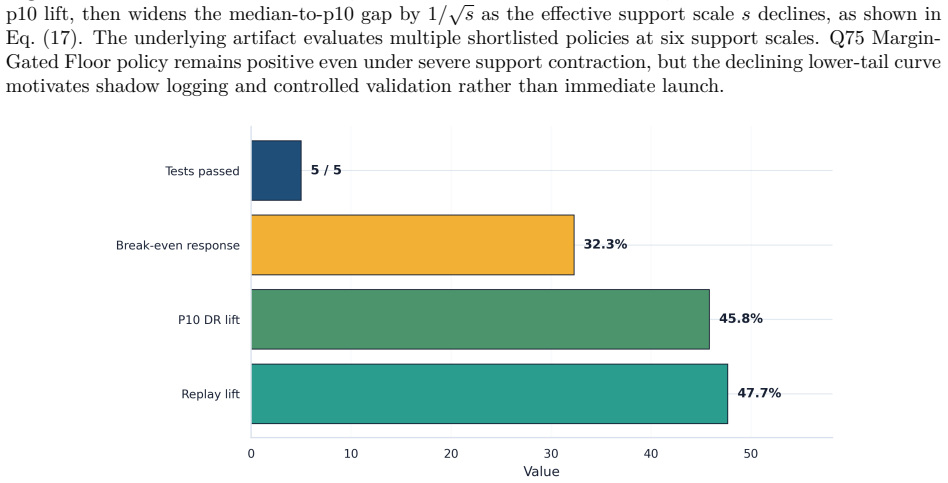
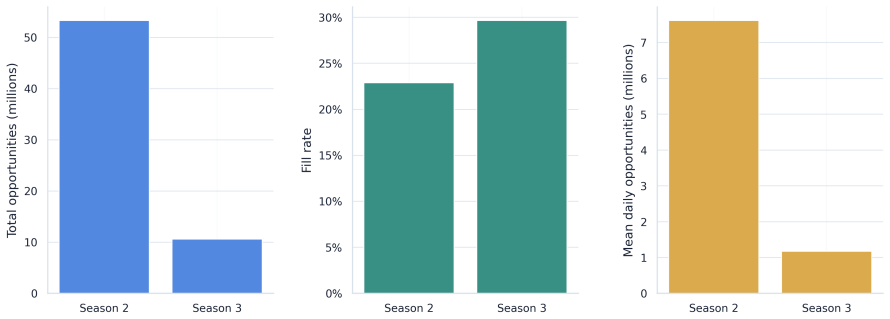
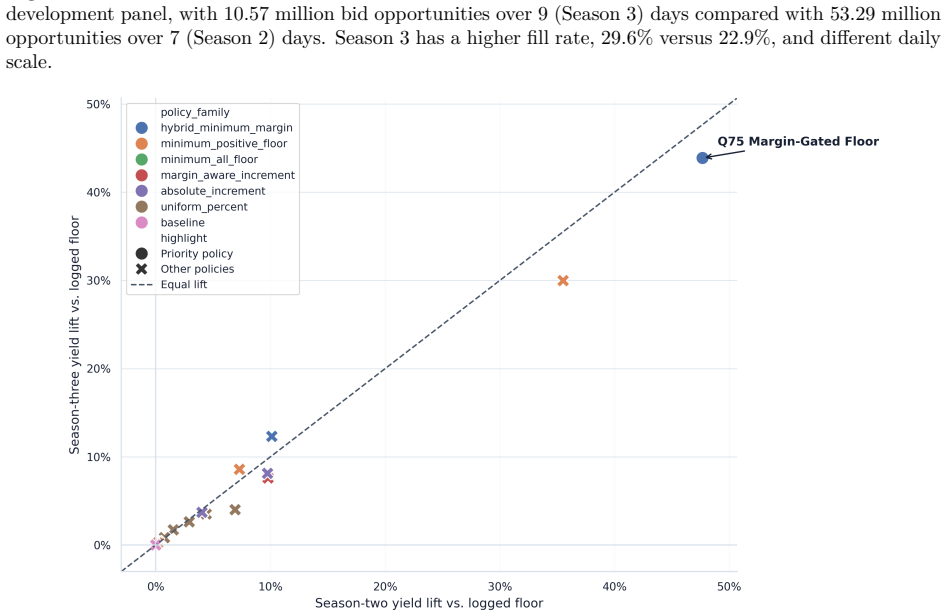
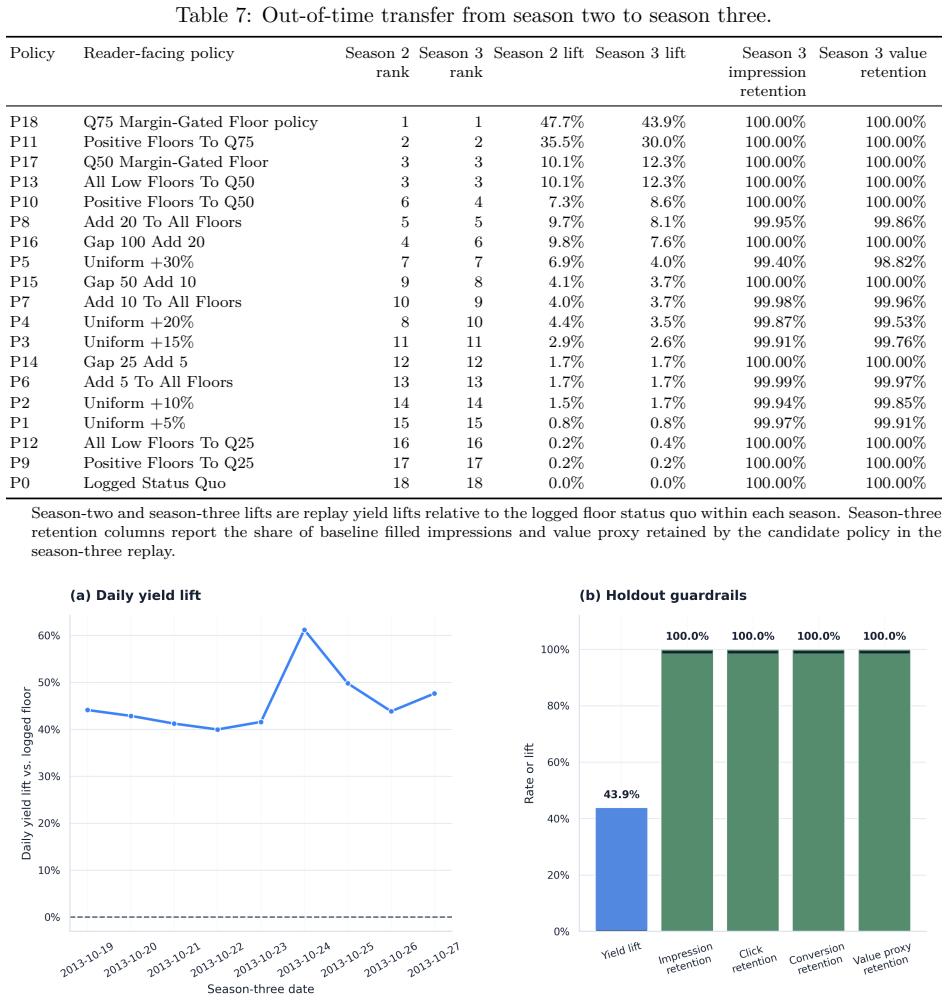
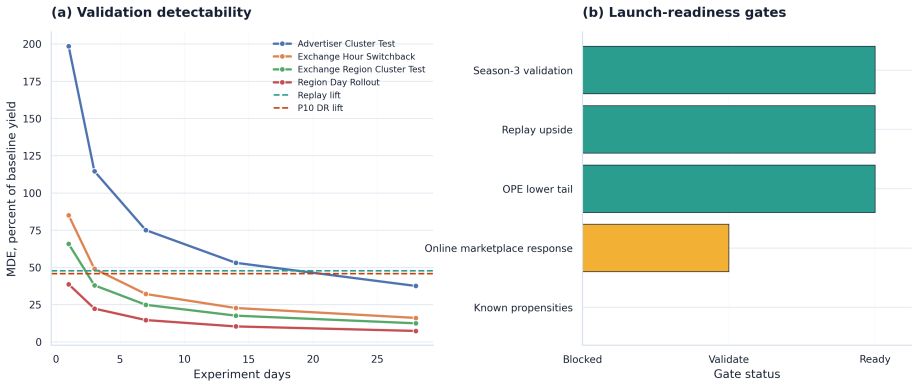
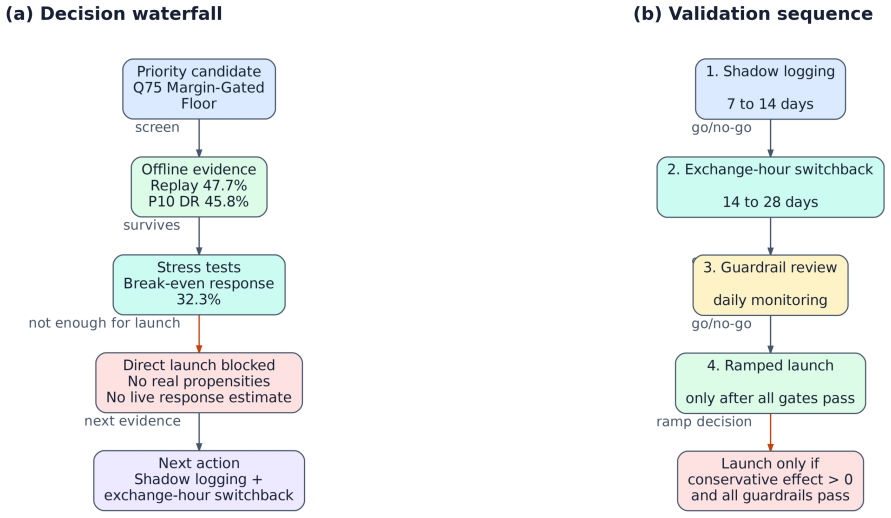
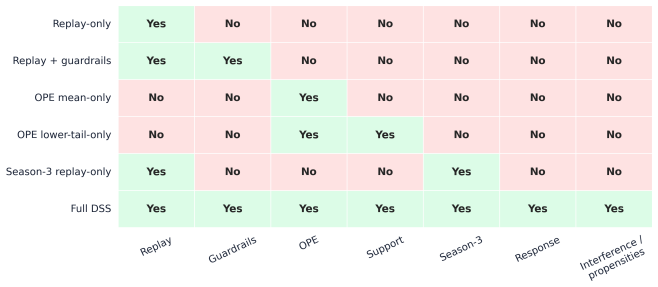
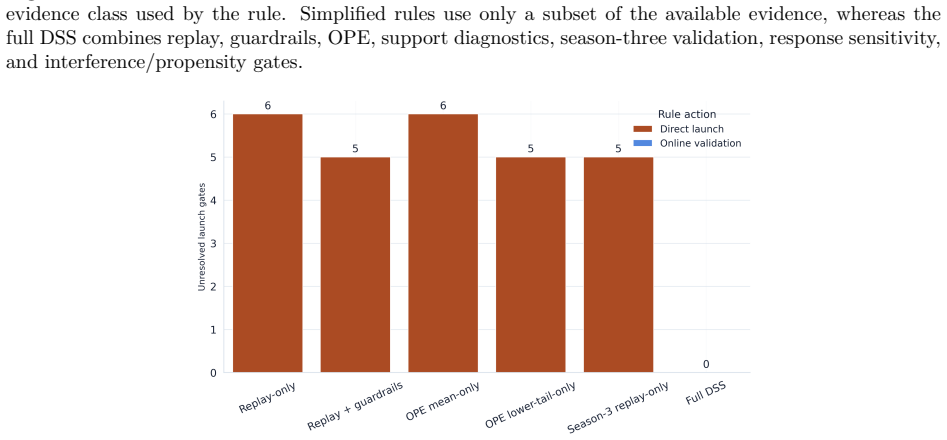
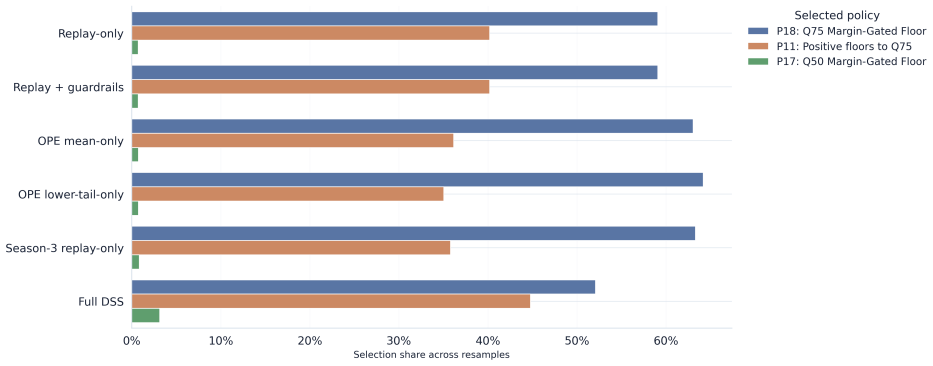
The framework integrates support-aware off-policy evaluation, conservative lower-bound ranking, multi-sided guardrails, and interference-aware validation design to produce a launch-readiness classification; when applied to iPinYou-style RTB logs it selects the margin-gated floor policy as leading candidate with 47.7 percent replay yield lift and 45.8 percent conservative lower-tail lift but does not recommend direct launch, instead requiring online validation to address missing evidence on propensities, bidder response, and interference.
What carries the argument
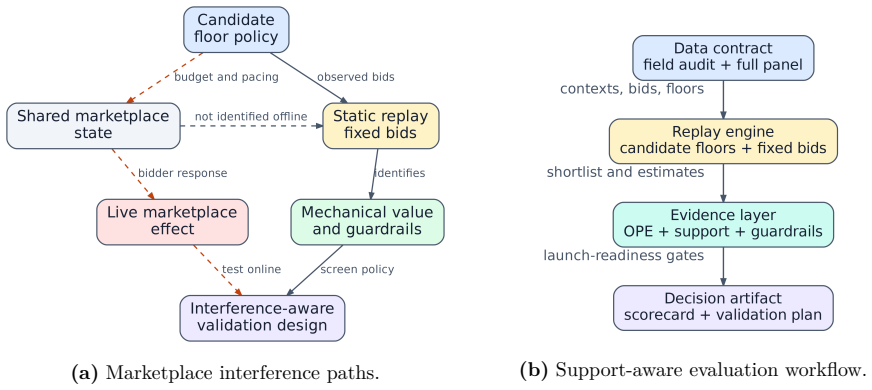
The support-aware decision-support system (DSS) that combines replay, support-aware OPE, conservative lower-bound ranking, multi-sided guardrails, out-of-time validation, sensitivity analysis, and interference-aware validation design into a pipeline outputting a launch-readiness classification.
If this is right
- Simplified pipelines reach the same policy yet incorrectly recommend deployment, leaving key causal assumptions unresolved.
- The DSS changes the action from deployment to online validation when evidence on propensities, bidder response, and interference is missing.
- The protocol converts offline evaluation into an auditable recommendation that prevents overclaim under partial identification.
- The selected policy shows stable out-of-time performance but still requires further validation steps before launch.
Where Pith is reading between the lines
- The same structure of conservative bounds plus interference-aware validation could be tested on non-RTB marketplaces that face multi-sided feedback.
- Running the framework on synthetic auction logs with known interference magnitudes would show how often it correctly withholds launch.
- The ablation implies that conservative ranking and guardrails are the components that shift the output from deploy to validate.
Load-bearing premise
The integrated pipeline of support-aware OPE, conservative lower-bound ranking, multi-sided guardrails, and interference-aware validation design can reliably separate promising evidence from actionable evidence under partial identification.
What would settle it
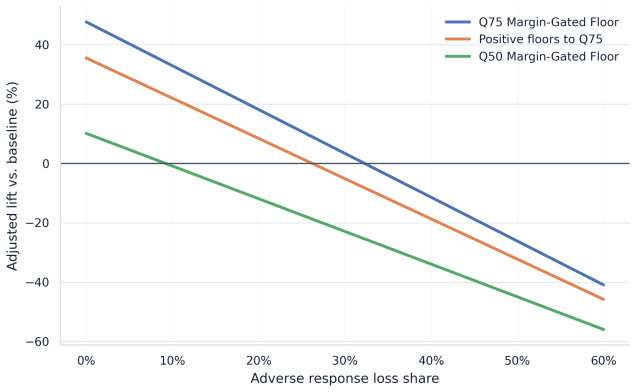
Deploy the margin-gated floor policy in a controlled online experiment and measure whether realized revenue, fill rate, and advertiser value stay within the conservative lower bounds or deviate because of unmodeled interference.
Figures
read the original abstract
Marketplace platforms routinely evaluate pricing and allocation policies using logged observational data, yet strong offline performance does not imply that a policy is safe to deploy. In real-time bidding (RTB) marketplaces, reserve-price and floor-policy changes affect not only revenue but also fill, advertiser value, budget pacing, and competition across auctions, creating feedback and interference. The central problem is therefore not to estimate whether a policy improves an offline metric, but to determine whether the available evidence justifies direct launch or only further validation. In this regard, we propose a support-aware decision-support system (DSS) that distinguishes promising from actionable evidence. The framework integrates replay, support-aware off-policy evaluation (OPE), conservative lower-bound ranking, multi-sided guardrails, out-of-time validation, sensitivity analysis, and interference-aware validation design into a claim-preserving pipeline that outputs a launch-readiness classification rather than a single performance estimate. Applying the framework to iPinYou-style RTB logs, we identify a margin-gated floor policy as the leading candidate, with a 47.7% replay yield lift, a 45.8% conservative lower-tail lift, and stable out-of-time performance. However, the framework does not recommend direct launch. A decision-rule ablation shows that simplified pipelines select the same policy but incorrectly recommend deployment, leaving key causal assumptions unresolved. In contrast, the proposed DSS selects the same policy but changes the action to online validation, reflecting missing evidence on propensities, bidder response, and interference. Overall, the contribution is a reproducible DSS protocol that prevents decision overclaim under partial identification and converts offline evaluation into an auditable, action-oriented recommendation.
Editorial analysis
A structured set of objections, weighed in public.
Referee Report
Summary. The manuscript proposes a support-aware decision-support system (DSS) for RTB marketplace policies that integrates replay, support-aware OPE, conservative lower-bound ranking, multi-sided guardrails, out-of-time validation, sensitivity analysis, and interference-aware design. The framework outputs a launch-readiness classification rather than a point estimate. On iPinYou-style logs, a margin-gated floor policy achieves a 47.7% replay yield lift and 45.8% conservative lower-tail lift with stable out-of-time performance, yet the DSS recommends online validation instead of direct launch due to unresolved evidence on propensities, bidder response, and interference. A decision-rule ablation shows that simplified pipelines select the same policy but incorrectly recommend deployment.
Significance. If the integrated pipeline reliably separates promising from actionable evidence under partial identification, the work could supply a reproducible protocol that reduces overconfident deployment decisions in marketplaces. The decision-rule ablation and emphasis on converting offline evaluation into an auditable recommendation are concrete strengths. The contribution is primarily methodological and would gain substantially from external grounding against observed post-deployment outcomes.
major comments (2)
- [Empirical evaluation] Empirical evaluation (application to iPinYou-style logs): The central claim that the DSS correctly withholds direct launch rests on the pipeline distinguishing actionable from promising evidence, yet the demonstration uses only historical logs without any ground-truth post-launch metrics (revenue, fill, or interference) for the evaluated policies. This leaves the classification untested against actual deployment outcomes.
- [Framework description] Framework integration (support-aware OPE and conservative lower-bound ranking): The abstract reports a 45.8% conservative lower-tail lift and states that the pipeline resolves key causal assumptions under partial identification, but no explicit equations or derivation steps are provided showing how the lower bounds are constructed or how they differ from standard OPE estimators; without these, it is impossible to verify whether the conservative ranking is load-bearing or reduces to a fitted threshold.
minor comments (2)
- [Abstract] Abstract: The phrase 'iPinYou-style RTB logs' should include a citation to the original dataset and a brief description of any preprocessing differences.
- [Methods] Notation: The multi-sided guardrails and interference-aware validation design would benefit from a compact table summarizing the exact thresholds or sensitivity parameters used in the reported classification.
Simulated Author's Rebuttal
We thank the referee for the constructive comments. We address each major point below, with honest acknowledgment of limitations inherent to offline evaluation.
read point-by-point responses
-
Referee: [Empirical evaluation] Empirical evaluation (application to iPinYou-style logs): The central claim that the DSS correctly withholds direct launch rests on the pipeline distinguishing actionable from promising evidence, yet the demonstration uses only historical logs without any ground-truth post-launch metrics (revenue, fill, or interference) for the evaluated policies. This leaves the classification untested against actual deployment outcomes.
Authors: We agree this is a genuine limitation: no post-deployment outcomes exist in the iPinYou-style logs, so the launch-readiness classification cannot be validated against real metrics. The paper's core contribution is precisely to demonstrate how a DSS should behave under incomplete evidence—flagging unresolved assumptions on propensities, bidder response, and interference and recommending online validation rather than launch. The decision-rule ablation supports this by showing simplified pipelines reach the opposite (incorrect) recommendation on identical data. We cannot fabricate ground-truth data; we will add explicit discussion of this offline-only constraint and its implications for future work. revision: partial
-
Referee: [Framework description] Framework integration (support-aware OPE and conservative lower-bound ranking): The abstract reports a 45.8% conservative lower-tail lift and states that the pipeline resolves key causal assumptions under partial identification, but no explicit equations or derivation steps are provided showing how the lower bounds are constructed or how they differ from standard OPE estimators; without these, it is impossible to verify whether the conservative ranking is load-bearing or reduces to a fitted threshold.
Authors: The full manuscript derives the bounds in Section 3 via support-constrained partial identification, taking the infimum of the OPE functional over propensity models consistent with observed support and a sensitivity parameter for unmeasured confounding; this produces a conservative lower tail distinct from standard IPS or DR estimators. However, we accept that the presentation may lack sufficient step-by-step clarity. We will insert a dedicated subsection with explicit equations, derivation steps, and comparison to standard OPE in the revision. revision: yes
Circularity Check
No significant circularity; framework assembles standard components into a pipeline without self-referential reduction
full rationale
The manuscript describes an integrated DSS that combines replay, support-aware OPE, conservative lower-bound ranking, multi-sided guardrails, out-of-time validation, sensitivity analysis, and interference-aware design to produce a launch-readiness classification. No equations, fitted parameters, or self-citations are exhibited that would make the output classification equivalent to its inputs by construction. The decision-rule ablation compares the proposed pipeline against simplified alternatives on historical logs, but the distinction rests on the explicit inclusion of conservative bounds and unresolved causal assumptions rather than any renaming or self-definition of results. The derivation chain therefore remains self-contained and does not reduce to fitted inputs or prior self-citations.
Axiom & Free-Parameter Ledger
Reference graph
Works this paper leans on
-
[1]
Charles, D
Leon Bottou, Jonas Peters, Joaquin Quinonero-Candela, Denis X. Charles, D. Max Chickering, Elon Portugaly, Dipankar Ray, Patrice Simard, and Ed Snelson. Counterfactual reasoning and 35 learning systems: The example of computational advertising.Journal of Machine Learning Research, 14:3207–3260, 2013. URLhttps://www.jmlr.org/papers/v14/bottou13a.html
2013
-
[2]
Real-time bidding benchmarking with iPinYou dataset
Weinan Zhang, Shuai Yuan, and Jun Wang. Real-time bidding benchmarking with iPinYou dataset. InProceedings of the 2014 KDD Workshop on Data Mining for Online Advertising, 2014
2014
-
[3]
Real-time bidding by reinforcement learning in display advertising
Han Cai, Kan Ren, Weinan Zhang, Kleanthis Malialis, Jun Wang, Yong Yu, and Defeng Guo. Real-time bidding by reinforcement learning in display advertising. InProceedings of the Tenth ACM International Conference on Web Search and Data Mining, pages 661–670, 2017. doi: 10.1145/3018661.3018702
-
[4]
Kristof Coussement and Dries F. Benoit. Interpretable data science for decision making. Decision Support Systems, 150:113664, 2021. doi: 10.1016/j.dss.2021.113664
-
[5]
Explainable AI for enhanced decision-making.Decision Support Systems, 184:114276,
Mohammad Abedin, Kristof Coussement, Mathias Kraus, Sebastian Maldonado, and Kazim Topuz. Explainable AI for enhanced decision-making.Decision Support Systems, 184:114276,
-
[6]
doi: 10.1016/j.dss.2024.114276
-
[7]
ThomasDecorte, JakobRaymaekers, andTimVerdonck. Interpretablecost-sensitiveregression through one-step boosting.Decision Support Systems, 175:114024, 2023. doi: 10.1016/j.dss. 2023.114024
-
[8]
Michael Ostrovsky and Michael Schwarz. Reserve prices in internet advertising auctions: A field experiment.Proceedings of the ACM Conference on Electronic Commerce, 2011. doi: 10.1145/1993574.1993584
-
[9]
An empirical study of reserve price optimisation in real-time bidding
Shuai Yuan, Jun Wang, Bowei Chen, Peter Mason, and Sam Seljan. An empirical study of reserve price optimisation in real-time bidding. InProceedings of the 20th ACM SIGKDD Conference on Knowledge Discovery and Data Mining, 2014
2014
-
[10]
Reserve price optimization in first- price auctions via multi-task learning, 2023
Achir Kalra, Chong Wang, Cristian Borcea, and Yi Chen. Reserve price optimization in first- price auctions via multi-task learning, 2023. URLhttps://digitalcommons.njit.edu/fac_ pubs/2172/
2023
-
[11]
Hana Choi and Carl F. Mela. Optimizing reserve prices in display advertising auctions. SSRN working paper, 2025. URLhttps://papers.ssrn.com/sol3/papers.cfm?abstract_ id=4523022
2025
-
[12]
Ye Chen, Pavel Berkhin, Bo Anderson, and Nikhil R. Devanur. Real-time bidding algorithms for performance-based display ad allocation. InProceedings of the 17th ACM SIGKDD Inter- national Conference on Knowledge Discovery and Data Mining, pages 1307–1315, 2011. doi: 10.1145/2020408.2020604
-
[13]
Bid landscape forecasting in online ad exchange marketplace
Ying Cui, Ruofei Zhang, Wei Li, and Jianchang Mao. Bid landscape forecasting in online ad exchange marketplace. InProceedings of the 17th ACM SIGKDD International Conference on Knowledge Discovery and Data Mining, pages 265–273, 2011. doi: 10.1145/2020408.2020454
-
[14]
Santiago R. Balseiro and Yonatan Gur. Learning in repeated auctions with budgets: Regret minimization and equilibrium.Management Science, 65(9):3952–3968, 2019. doi: 10.1287/ mnsc.2018.3174. 36
-
[15]
Unbiased offline evaluation of contextual-bandit-based news article recommendation algorithms
Lihong Li, Wei Chu, John Langford, and Xuanhui Wang. Unbiased offline evaluation of contextual-bandit-based news article recommendation algorithms. InProceedings of the Fourth ACM International Conference on Web Search and Data Mining, pages 297–306, 2011. doi: 10.1145/1935826.1935878
-
[16]
Doubly robust policy evaluation and learning
Miroslav Dudik, John Langford, and Lihong Li. Doubly robust policy evaluation and learning. InProceedings of the 28th International Conference on Machine Learning, 2011
2011
-
[17]
Doubly robust off-policy value evaluation for reinforcement learning
Nan Jiang and Lihong Li. Doubly robust off-policy value evaluation for reinforcement learning. InProceedings of the 33rd International Conference on Machine Learning, pages652–661, 2016. URLhttps://proceedings.mlr.press/v48/jiang16.html
2016
-
[18]
Counterfactual risk minimization: Learning from logged bandit feedback
Adith Swaminathan and Thorsten Joachims. Counterfactual risk minimization: Learning from logged bandit feedback. InProceedings of the 32nd International Conference on Machine Learning, 2015
2015
-
[19]
Optimal and adaptive off-policy evalu- ation in contextual bandits
Yu-Xiang Wang, Alekh Agarwal, and Miroslav Dudik. Optimal and adaptive off-policy evalu- ation in contextual bandits. InProceedings of the 34th International Conference on Machine Learning, 2017
2017
-
[20]
Doubly robust off-policy evaluation with shrinkage
Yi Su, Maria Dimakopoulou, Akshay Krishnamurthy, and Miroslav Dudik. Doubly robust off-policy evaluation with shrinkage. InProceedings of the 37th International Conference on Machine Learning, pages 9167–9176, 2020. URLhttps://proceedings.mlr.press/v119/ su20a.html
2020
-
[21]
Ruohan Zhan, Vitor Hadad, David A. Hirshberg, and Susan Athey. Off-policy evaluation via adaptive weighting with data from contextual bandits.arXiv preprint arXiv:2106.02029, 2021
-
[22]
Open bandit dataset and pipeline: Towards realistic and reproducible off-policy evaluation
Yuta Saito, Shunsuke Aihara, Megumi Matsutani, and Yusuke Narita. Open bandit dataset and pipeline: Towards realistic and reproducible off-policy evaluation. InAdvances in Neu- ral Information Processing Systems Datasets and Benchmarks Track, 2021. URLhttps: //openreview.net/forum?id=tyn3MYS_uDT
2021
-
[23]
David Holtz and Sinan Aral. Limiting bias from test-control interference in online marketplace experiments.arXiv preprint arXiv:2004.12162, 2020. URLhttps://arxiv.org/abs/2004. 12162
-
[24]
Weintraub
Hannah Li, Geng Zhao, Ramesh Johari, and Gabriel Y. Weintraub. Interference, bias, and variance in two-sided marketplace experimentation: Guidance for platforms.Management Science, 2022
2022
-
[25]
Weintraub
Ramesh Johari, Hannah Li, Inessa Liskovich, and Gabriel Y. Weintraub. Experimental design in two-sided platforms: An analysis of bias.Management Science, 2022
2022
-
[26]
Imbens, Lorenzo Masoero, James McQueen, Thomas S
Patrick Bajari, Brian Burdick, Guido W. Imbens, Lorenzo Masoero, James McQueen, Thomas S. Richardson, and Ido M. Rosen. Experimental design in marketplaces.Statisti- cal Science, 2023. doi: 10.1214/23-STS883
-
[27]
Ozan Candogan, Chen Chen, and Rad Niazadeh. Correlated cluster-based randomized exper- iments: Robust variance minimization.Management Science, 2023. doi: 10.1287/mnsc.2021. 02741. 37
-
[28]
Design and analysis of switchback experiments.Management Science, 2022
Iavor Bojinov, David Simchi-Levi, and Jinglong Zhao. Design and analysis of switchback experiments.Management Science, 2022
2022
-
[29]
Enhancing efficiency and robustness for switchback experiments: A practical model-assisted design and analysis.SSRN working paper, 2025
Tu Ni and Iavor Bojinov. Enhancing efficiency and robustness for switchback experiments: A practical model-assisted design and analysis.SSRN working paper, 2025. URLhttps: //papers.ssrn.com/sol3/papers.cfm?abstract_id=5229804
2025
-
[30]
Efficient switchback experiments with surrogate vari- ables: Estimation and experimental design.SSRN working paper, 2025
Hongyu Chen and David Simchi-Levi. Efficient switchback experiments with surrogate vari- ables: Estimation and experimental design.SSRN working paper, 2025. URLhttps: //papers.ssrn.com/sol3/papers.cfm?abstract_id=4436643. 38
2025
discussion (0)
Sign in with ORCID, Apple, or X to comment. Anyone can read and Pith papers without signing in.