Recognition: unknown
Apparent Ferroelectric Polarization Hysteresis and a Simple Method to Observe Piezoelectric Strain Loops with a Microphone
Pith reviewed 2026-05-14 17:50 UTC · model grok-4.3
The pith
Extra series components can create apparent ferroelectric D-E hysteresis loops even with the double-wave method.
A machine-rendered reading of the paper's core claim, the machinery that carries it, and where it could break.
Core claim
Extra components in series to non-ferroelectric capacitance produce apparent ferroelectric D-E hysteresis loops even with the double-wave method. Characteristics of these fake loops are studied with simple circuit models, and similar suspicious loops appear in published papers that used the double-wave method. Inverse piezoelectric strain reverses along with polarization under the electric field, so S-E loops are more reliable for proving ferroelectricity than D-E loops. A simple circuit extension using an inexpensive small electret microphone allows observation of S-E loops on bulk samples, and measurements on a commercial ceramic capacitor reveal that its D-E loops were apparent rather.
What carries the argument
Simple circuit models that simulate series capacitive artifacts together with an electret microphone that detects the sample's inverse piezoelectric strain.
If this is right
- D-E loops obtained by the double-wave method must be cross-checked against strain data to exclude circuit artifacts.
- S-E loops supply a more direct test of ferroelectricity because they track the physical reversal of strain.
- The microphone technique makes S-E measurements accessible without costly displacement sensors or interferometers.
- Materials whose ferroelectric claims rest solely on D-E data from the double-wave method may need re-evaluation.
Where Pith is reading between the lines
- Routine addition of low-cost strain detection could reduce false positives in ferroelectricity reports across materials labs.
- The method offers a practical way to revisit older D-E data sets that lack accompanying strain measurements.
- Frequency-dependent tests with the same microphone setup could expose whether apparent loops arise from relaxation effects.
Load-bearing premise
The circuit models capture the dominant real-world artifacts and the microphone records only the sample's strain response without adding its own electrical or mechanical distortions.
What would settle it
Applying the microphone method to the commercial ceramic capacitor and finding no S-E hysteresis while its D-E loop still shows one, or reproducing the apparent D-E loops only when known series capacitors are deliberately added in a controlled test.
Figures


read the original abstract
Extra components in series to non-ferroelectric capacitance can cause apparent ferroelectric D-E hysteresis loops even with the double-wave method (DWM). Characteristics of fake loops are studied withsimple circuit models, and suspicious loops of actual materials are found in some papers using the DWM. Inverse piezoelectric strain also reverses along with the polarization by the electric field, and S-E loops are considered more reliable to prove ferroelectricity than the D-E loops. But measurement of S-E loops usually requires expensive instruments in contrast to D-E loops with a simple circuit. A very simple method is developed to observe S-E loops of bulk samples with an inexpensive small electret microphone and a little expansion to the circuit for D-E loops. S-E loops of a commercial ceramic capacitor by this method reveal that its D-E loops apparent.
Editorial analysis
A structured set of objections, weighed in public.
Referee Report
Summary. The manuscript claims that extra series capacitance connected to non-ferroelectric samples can produce apparent ferroelectric D-E hysteresis loops even when the double-wave method (DWM) is employed. This is supported by simple circuit models that generate fake loops, identification of suspicious loops in some published papers, and a proposed low-cost technique using an electret microphone to measure inverse piezoelectric S-E strain loops, demonstrated on a commercial ceramic capacitor whose D-E loops are shown to be artifacts.
Significance. If the central claims hold after validation, the work is significant for materials science because it identifies a plausible source of measurement artifacts in ferroelectric characterization and provides an accessible, inexpensive method to observe S-E loops. This could reduce false-positive ferroelectric claims and lower barriers to verifying piezoelectric response.
major comments (3)
- [Abstract / Circuit models] Abstract and circuit-model section: the manuscript states that suspicious loops appear in some DWM papers but supplies no specific citations, no quantitative error analysis, and no direct overlays comparing modeled fake-loop shapes and magnitudes to the cited experimental data.
- [Microphone method] Microphone-method description: the S-E measurement is presented without characterization of the electret microphone’s frequency response, mechanical coupling, or possible electromagnetic pickup, so it is unclear whether the reported loops are free of additional phase or amplitude artifacts.
- [Results / Demonstration] Demonstration on commercial capacitor: the claim that the capacitor’s D-E loops are apparent rests on a single example without full experimental parameters, comparison to standard S-E instruments, or statistical assessment of loop reproducibility.
minor comments (1)
- [Abstract] The abstract would benefit from explicit references to the specific papers whose D-E loops are flagged as suspicious.
Simulated Author's Rebuttal
We thank the referee for the constructive feedback on our manuscript. We have addressed each major comment below and will incorporate revisions to strengthen the presentation of our circuit models, the microphone method, and the experimental demonstration.
read point-by-point responses
-
Referee: Abstract / Circuit models: the manuscript states that suspicious loops appear in some DWM papers but supplies no specific citations, no quantitative error analysis, and no direct overlays comparing modeled fake-loop shapes and magnitudes to the cited experimental data.
Authors: We agree that explicit citations and quantitative comparisons would improve clarity. In the revised manuscript we will add specific references to published DWM studies containing loops with the characteristic features of our modeled artifacts, include a quantitative error analysis of the series-capacitance effect, and provide direct overlay figures comparing the simulated fake loops to the experimental data from those papers. revision: yes
-
Referee: Microphone-method description: the S-E measurement is presented without characterization of the electret microphone’s frequency response, mechanical coupling, or possible electromagnetic pickup, so it is unclear whether the reported loops are free of additional phase or amplitude artifacts.
Authors: The referee correctly identifies the need for additional characterization. We will expand the methods section to report the measured frequency response of the electret microphone, describe the mechanical mounting and coupling to the sample, and include tests for electromagnetic pickup (e.g., shielded vs. unshielded runs and phase checks). These additions will confirm that the observed S-E loops are not dominated by instrumental artifacts. revision: yes
-
Referee: Results / Demonstration: the claim that the capacitor’s D-E loops are apparent rests on a single example without full experimental parameters, comparison to standard S-E instruments, or statistical assessment of loop reproducibility.
Authors: We acknowledge that a single demonstration limits robustness. The revised manuscript will supply the complete set of experimental parameters (voltage amplitude, frequency, sample dimensions, microphone gain settings), add a direct comparison of the microphone-derived S-E loops against measurements obtained with a commercial laser vibrometer on the same capacitor, and include repeated measurements on multiple devices with statistical metrics (standard deviation of loop area and coercive field) to demonstrate reproducibility. revision: yes
Circularity Check
No circularity; models and method are independent
full rationale
The paper constructs its central claims from explicit linear circuit models (series capacitance added to a non-ferroelectric capacitor) whose equations are written out and solved directly, plus a hardware description of an electret-microphone extension to a standard D-E circuit. These elements are derived from basic circuit theory and a commercial-capacitor test; no parameter is fitted to the suspicious literature loops, no self-citation supplies a uniqueness theorem, and no quantity is renamed as a prediction. The derivation chain therefore remains self-contained against external benchmarks.
Axiom & Free-Parameter Ledger
axioms (1)
- domain assumption Simple lumped-element circuit models suffice to represent dominant measurement artifacts in real D-E setups
Reference graph
Works this paper leans on
-
[1]
Introduction Ferroelectrics are materials which have the macro- scopic polarization P at the external electric field E = 0 and the remanent polarization Pr can be inverted by the E. Ferroelectricity is characterized by P–E or D– E hysteresis loops with P or the electric flux density D = P + ϵ0E. Principles of D–E loop measurement are not changed from a tr...
work page internal anchor Pith review Pith/arXiv arXiv 2026
-
[2]
Output of an EM proportional to the pressure change and S is measured as a charge through a capacitor CM, and a pair of two switches is used to choose D and S signals
Experiments Figure 1 shows a circuit for measuring D–E and S – E loops. Output of an EM proportional to the pressure change and S is measured as a charge through a capacitor CM, and a pair of two switches is used to choose D and S signals. (Although C0 is also changed for D or S , its switch is omitted in the figure.) I–V curves are also mea- sured instea...
-
[3]
Single” in the figure. The reason is unknown, and S –E loops later are measured by continu- ous triangular waves as “Cont
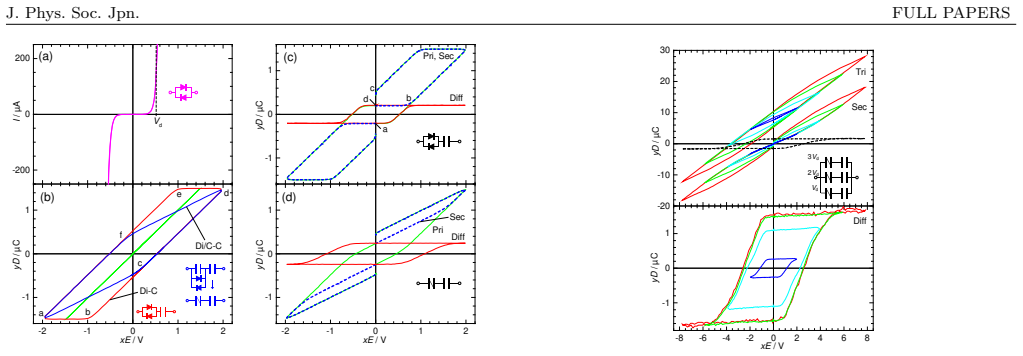
Results and discussion 3.1 DWM D–E loops of a PZT and an MLCC At first, Fig. 3(a) shows true ferroelectric D–E loops of a PZT sample by the DWM. In the figures, although y is area and x is thickness for a plate-like sample, yD and 2 J. Phys. Soc. Jpn. FULL PAPERS -2 -1 0 1 2 -1 0 1 f e d c ba Di/C-C Di-C xE / V yD / µC -1 0 1 Pri, Sec Diffd c b a yD / µC ...
-
[4]
Fake D–E loops can be made with various circuit models, and it is recommended that users of the DWM try
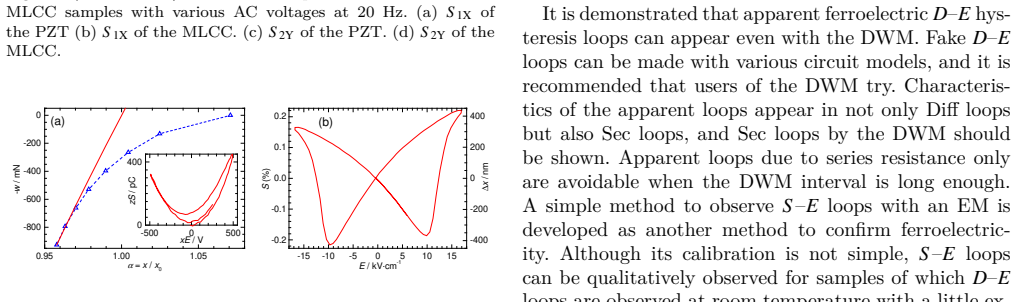
Conclusions It is demonstrated that apparent ferroelectric D–E hys- teresis loops can appear even with the DWM. Fake D–E loops can be made with various circuit models, and it is recommended that users of the DWM try. Characteris- tics of the apparent loops appear in not only Diff loops but also Sec loops, and Sec loops by the DWM should be shown. Apparent...
-
[5]
C. B. Sawyer and C. H. Tower, Phys. Rev. 35 269 (1930)
1930
-
[6]
J. F. Scott, J. Phys.: Condens. Matter 20, 021001 (2008)
2008
-
[7]
Fukunaga and Y
M. Fukunaga and Y. Noda, J. Phys. Soc. Jpn. 77, 064706 (2008)
2008
-
[8]
J. F. Scott, C. A. Araujo, H. B. Meadows, L. D. McMillan, and A. Shawabkeh, J. Appl. Phys. 66, 1444 (1989)
1989
-
[9]
Pintilie and M
L. Pintilie and M. Alexe, Appl. Phys. Lett. 87, 112903 (2005)
2005
-
[10]
Kliem and B
H. Kliem and B. Martin, J. Phys.: Condens. Matter 20, 321001 (2008)
2008
-
[11]
Fukunaga and Y
M. Fukunaga and Y. Uesu, Jpn. J. Appl. Phys. 42, 6115 (2003)
2003
-
[12]
Dossetti-Romero, J
V. Dossetti-Romero, J. A. Méndez-Bermúdez, and E López- Cruz, J. Phys.: Condens. Matter 14, 9725 (2002)
2002
-
[13]
Y. Yuan, M. Kotiuga, T. J. Park, R. K. Patel, Y. Ni, A. Saha, H. Zhou, J. T. Sadowski, A. Al-Mahboob, H. Yu, K. Du, M. Zhu, S. Deng, R. S. Bisht, X. Lyu, C.-T. M. Wu, P. D. Ye, A. Sengupta, S.-W. Cheong, X. Xu, K. M. Rabe, and S. Ramanathan, Nat. Comm. 15, 4717 (2024)
2024
-
[14]
X. Li, L. Yang, C. F. Li, M. F. Liu, Z. Fan, Y. L. Xie, C. L. Lu, L. Lin, Z. B. Yan, Z. Zhang, J. Y. Dai, J.-M. Liu, and S. W. Cheong, Appl. Phys. Lett. 110, 042901 (2017)
2017
-
[15]
V. K. Shukla and S. Mukhopadhyay, J. Appl. Phys. 120, 154102 (2016)
2016
-
[16]
Fukunaga, Y
M. Fukunaga, Y. Uesu, and G. Li, Ferroelectrics 354, 106 (2007)
2007
-
[17]
Nagata, P.-E
T. Nagata, P.-E. Janolin, M. Fukunaga, B. Roman, K. Fuji- wara, H. Kimura, J.-M. Kiat, and N. Ikeda, Appl. Phys. Lett. 110, 052901 (2017)
2017
-
[18]
T. D. Usher, K. R. Cousins, R. Zhang, and S. Ducharme, Polym. Int. 67, 790 (2018). 5
2018
discussion (0)
Sign in with ORCID, Apple, or X to comment. Anyone can read and Pith papers without signing in.