Recognition: unknown
Stochastic Modeling of Power-Grid Frequency Fluctuations in Low-Inertia Systems via a Gaussian-Core Potential and Superstatistics
Pith reviewed 2026-05-14 19:09 UTC · model grok-4.3
The pith
A Gaussian-core potential plus superstatistics reproduces the bimodal frequency distributions observed in low-inertia power grids.
A machine-rendered reading of the paper's core claim, the machinery that carries it, and where it could break.
Core claim
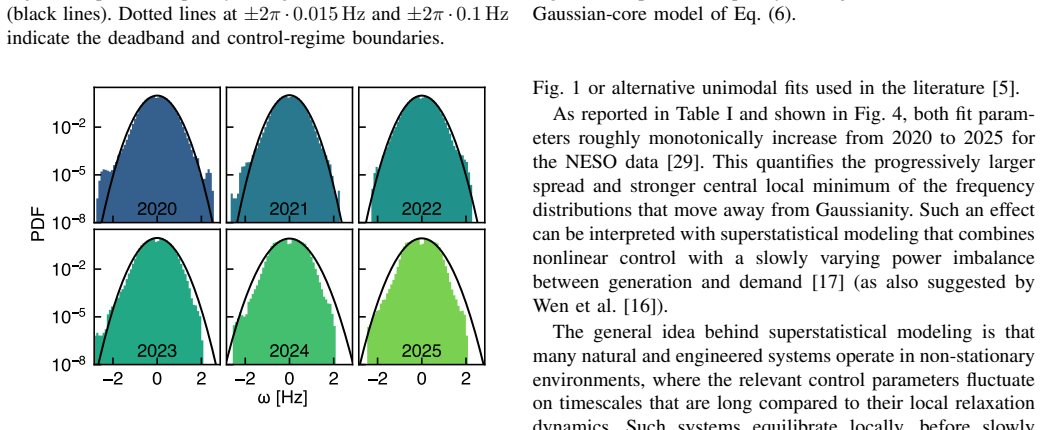
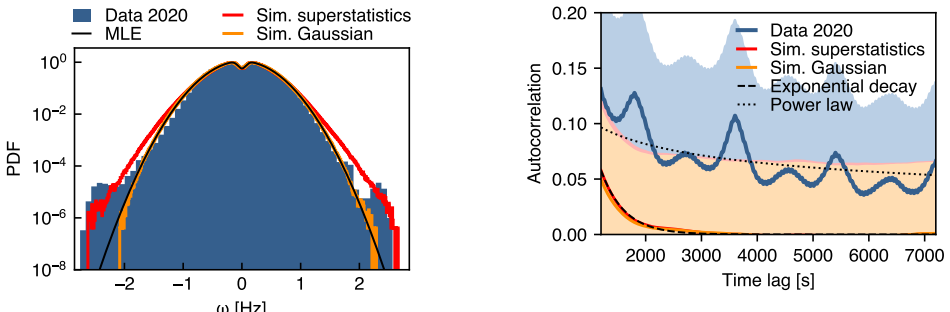
The authors construct a data-driven stochastic process that combines a Gaussian-core potential, which imposes a restoring force with a central barrier, and superstatistical averaging over a lognormal distribution of the drift amplitude. Fitting the resulting process to one-second frequency measurements from the Great Britain grid shows that the central barrier parameter increases substantially between 2020 and 2025 as system inertia falls, while the model simultaneously reproduces the empirical bimodality, heavy tails, and autocorrelation decay.
What carries the argument
The Gaussian-core potential, which adds a central barrier to the restoring force, combined with superstatistical sampling of the drift amplitude from a lognormal distribution.
If this is right
- The model reproduces the characteristic double-peak structure and heavy tails of empirical frequency distributions.
- The central barrier parameter rises as inertia decreases, providing a quantitative link between renewable penetration and frequency statistics.
- Euler-Maruyama discretization with lognormal sampling of the drift amplitude generates realistic time series that match measured autocorrelation decay.
- The same framework can be applied to other grids to track how the barrier evolves with changing inertia.
Where Pith is reading between the lines
- The approach offers a practical tool for projecting frequency statistics under still lower inertia levels expected in the coming decade.
- Similar barrier mechanisms may govern fluctuations in other engineered or natural systems that exhibit central suppression.
- Applying the model to continental European or North American grids would test whether the barrier-increase trend is geographically general.
Load-bearing premise
The coefficients that govern grid dynamics are assumed to fluctuate slowly enough to permit superstatistical treatment with a lognormal distribution for the drift amplitude.
What would settle it
New frequency recordings from the same grid after 2025 that show no continued rise in the fitted central barrier parameter despite further measured drops in inertia, or that the model fails to reproduce the observed bimodality and tails in those later data.
Figures


read the original abstract
Power grid frequency stability is fundamental to the secure operation of modern energy systems, yet the growing penetration of renewables and the associated reduction of system inertia have made frequency fluctuations increasingly non-Gaussian and difficult to model. Existing stochastic models based on standard Ornstein--Uhlenbeck-type restoring terms yield a unimodal frequency distribution and therefore fail to reproduce the bimodal structure, central suppression, and heavy tails widely observed in empirical data. Here, we propose a data-driven stochastic process that combines a Gaussian-core potential with superstatistical modeling, assuming slowly fluctuating coefficients for the grid dynamics. The Gaussian-core potential captures the potential barrier that gives rise to the characteristic double-peak structure of frequency distributions. Fitting the model to frequency data resolved at one-second intervals from the Great Britain grid, we find that the central barrier parameter increases substantially from 2020 to 2025 as the grid inertia progressively decreases. To simulate superstatistics, we use an Euler--Maruyama discretization and sample the drift amplitude from a lognormal distribution, thereby successfully reproducing empirical bimodality and heavy tails, as well as the autocorrelation decay. Our results establish a compact and interpretable model for characterizing the evolving complexity of low-inertia grid frequency dynamics.
Editorial analysis
A structured set of objections, weighed in public.
Referee Report
Summary. The paper proposes a stochastic model for power-grid frequency fluctuations in low-inertia systems that combines a Gaussian-core potential (to capture the central barrier responsible for bimodality) with superstatistical modeling (assuming slowly fluctuating coefficients whose drift amplitude is drawn from a lognormal distribution). Fitting the central barrier parameter to one-second GB grid frequency data, the authors report a substantial increase from 2020 to 2025 as inertia declines; Euler–Maruyama simulations are then used to reproduce the observed bimodality, heavy tails, and autocorrelation decay.
Significance. If the central claim holds after addressing the fitting and validation issues, the work supplies a compact, physically interpretable framework for tracking how declining inertia alters frequency statistics, which could inform stability assessments in renewable-dominated grids. The explicit use of superstatistics to generate non-Gaussian features is a methodological strength, provided the timescale-separation assumption can be independently verified.
major comments (3)
- [fitting/results] The central barrier parameter is fitted directly to the same GB grid frequency statistics whose bimodality and tails it is then invoked to explain; consequently the reported increase from 2020 to 2025 is a fitted trend rather than an independent prediction or test of the model (see abstract and the fitting/results section).
- [model/superstatistics] The superstatistical construction rests on the assumption that grid-dynamics coefficients fluctuate slowly relative to the 1 s frequency correlation time, allowing a fixed lognormal distribution for the drift amplitude; no explicit test of this timescale separation (e.g., via autocorrelation of estimated parameters or comparison of fluctuation versus observation timescales) is provided, leaving open the possibility that the extracted barrier trend is an artifact of the modeling choice.
- [simulation/results] The abstract states that Euler–Maruyama simulations with lognormal sampling successfully reproduce bimodality, heavy tails, and autocorrelation, yet no quantitative error metrics (e.g., Kolmogorov–Smirnov distances, tail-index errors, or autocorrelation RMSE), cross-validation, or systematic comparison against alternative potentials (standard OU, etc.) are reported, so the reproduction claim remains only qualitatively supported.
minor comments (1)
- [model] The explicit functional form of the Gaussian-core potential and the precise definition of its central barrier parameter should be stated as an equation in the main text rather than left implicit.
Simulated Author's Rebuttal
We thank the referee for the constructive and detailed comments. We agree that several aspects of the presentation require clarification and strengthening, particularly regarding the nature of the fitting, validation of modeling assumptions, and quantitative evaluation of results. We will revise the manuscript accordingly. Our point-by-point responses follow.
read point-by-point responses
-
Referee: [fitting/results] The central barrier parameter is fitted directly to the same GB grid frequency statistics whose bimodality and tails it is then invoked to explain; consequently the reported increase from 2020 to 2025 is a fitted trend rather than an independent prediction or test of the model (see abstract and the fitting/results section).
Authors: We agree that the central barrier parameter is obtained by fitting to the empirical frequency distributions from the GB grid data. The model is phenomenological, with the Gaussian-core potential chosen to reproduce the observed central suppression and bimodality; the reported increase from 2020 to 2025 therefore reflects the evolution of the fitted statistics as inertia declines. To address the concern, we will revise the abstract and results section to explicitly describe the procedure as data-driven fitting, clarify that the trend is not an a priori prediction, and add discussion linking the barrier parameter to independent estimates of system inertia decline. revision: yes
-
Referee: [model/superstatistics] The superstatistical construction rests on the assumption that grid-dynamics coefficients fluctuate slowly relative to the 1 s frequency correlation time, allowing a fixed lognormal distribution for the drift amplitude; no explicit test of this timescale separation (e.g., via autocorrelation of estimated parameters or comparison of fluctuation versus observation timescales) is provided, leaving open the possibility that the extracted barrier trend is an artifact of the modeling choice.
Authors: The superstatistical ansatz assumes a clear separation between the fast frequency dynamics (correlation time ~1 s) and slower fluctuations in the drift amplitude. While this is a standard modeling choice in superstatistics, we did not provide an explicit verification in the submitted manuscript. In the revision we will add an analysis of the timescale separation, for example by estimating the drift amplitude over successive time windows, computing its autocorrelation function, and comparing the resulting correlation time to the 1 s frequency autocorrelation time. revision: yes
-
Referee: [simulation/results] The abstract states that Euler–Maruyama simulations with lognormal sampling successfully reproduce bimodality, heavy tails, and autocorrelation, yet no quantitative error metrics (e.g., Kolmogorov–Smirnov distances, tail-index errors, or autocorrelation RMSE), cross-validation, or systematic comparison against alternative potentials (standard OU, etc.) are reported, so the reproduction claim remains only qualitatively supported.
Authors: We acknowledge that the reproduction of empirical features was demonstrated only qualitatively. In the revised manuscript we will augment the simulation results with quantitative metrics, including Kolmogorov–Smirnov distances between simulated and empirical distributions, errors in the estimated tail indices, and RMSE values for the autocorrelation functions. We will also include a systematic comparison against the standard Ornstein–Uhlenbeck model to quantify the improvement provided by the Gaussian-core potential and superstatistics. revision: yes
Circularity Check
Fitted central barrier parameter trend presented as independent result on same GB data
specific steps
-
fitted input called prediction
[Abstract]
"Fitting the model to frequency data resolved at one-second intervals from the Great Britain grid, we find that the central barrier parameter increases substantially from 2020 to 2025 as the grid inertia progressively decreases."
The barrier parameter is obtained by fitting the Gaussian-core potential to the empirical frequency histograms of the identical GB dataset; the year-to-year increase is therefore the direct numerical output of that fit and cannot constitute an independent prediction or first-principles result about inertia reduction.
full rationale
The paper's central claim reduces to fitting the Gaussian-core barrier parameter directly to the same 1-second GB frequency time series whose statistics (bimodality, tails) the model is then said to explain. The reported 2020–2025 increase is therefore the output of the fit itself rather than an independent prediction or derivation. The superstatistical construction (slowly fluctuating coefficients sampled from lognormal) is an ansatz whose timescale-separation assumption is not validated against the data's correlation times, but the load-bearing circularity is the fitted-parameter-as-finding step. No self-citation chain or uniqueness theorem is invoked; the model reproduces features by construction once parameters are tuned to the target distributions.
Axiom & Free-Parameter Ledger
free parameters (2)
- central barrier parameter
- lognormal distribution parameters for drift amplitude
axioms (1)
- domain assumption coefficients for the grid dynamics fluctuate slowly
invented entities (1)
-
Gaussian-core potential
no independent evidence
Reference graph
Works this paper leans on
-
[1]
Kundur, N
P. Kundur, N. J. Balu, and M. G. Lauby,Power System Stability and Control. New York, NY , USA: McGraw-Hill, 1994, vol. 7
1994
-
[2]
Electricity markets around the world,
K. Mayer and S. Tr ¨uck, “Electricity markets around the world,”Journal of Commodity Markets, vol. 9, pp. 77–100, 2018. [Online]. Available: https://www.sciencedirect.com/science/article/pii/S2405851318300059
2018
-
[3]
Data-driven load profiles and the dynamics of residential electricity consumption,
M. Anvari, E. Proedrou, B. Sch ¨afer, C. Beck, H. Kantz, and M. Timme, “Data-driven load profiles and the dynamics of residential electricity consumption,”Nature Communications, vol. 13, no. 1, p. 4593, Aug
-
[4]
Available: https://doi.org/10.1038/s41467-022-31942-9
[Online]. Available: https://doi.org/10.1038/s41467-022-31942-9
-
[5]
Future low-inertia power systems: Requirements, issues, and solutions - A review,
K. S. Ratnam, K. Palanisamy, and G. Yang, “Future low-inertia power systems: Requirements, issues, and solutions - A review,” Renewable and Sustainable Energy Reviews, vol. 124, p. 109773, 2020. [Online]. Available: https://www.sciencedirect.com/science/article/pii/ S1364032120300691
2020
-
[6]
Non- Gaussian power grid frequency fluctuations characterized by L´evy-stable laws and superstatistics,
B. Sch ¨afer, C. Beck, K. Aihara, D. Witthaut, and M. Timme, “Non- Gaussian power grid frequency fluctuations characterized by L´evy-stable laws and superstatistics,”Nature Energy, vol. 3, no. 2, pp. 119–126, Feb
-
[7]
Available: https://doi.org/10.1038/s41560-017-0058-z
[Online]. Available: https://doi.org/10.1038/s41560-017-0058-z
-
[8]
Isolating the Impact of Trading on Grid Frequency Fluctuations,
B. Schafer, M. Timme, and D. Witthaut, “Isolating the Impact of Trading on Grid Frequency Fluctuations,” in2018 IEEE PES Innovative Smart Grid Technologies Conference Europe (ISGT-Europe), 2018, pp. 1–5
2018
-
[9]
Deadbands, Droop, and Inertia Impact on Power System Frequency Distribution,
P. V orobev, D. M. Greenwood, J. H. Bell, J. W. Bialek, P. C. Taylor, and K. Turitsyn, “Deadbands, Droop, and Inertia Impact on Power System Frequency Distribution,”IEEE Transactions on Power Systems, vol. 34, no. 4, pp. 3098–3108, 2019
2019
-
[10]
Stochastic properties of the frequency dynamics in real and synthetic power grids,
M. Anvari, L. R. Gorj ˜ao, M. Timme, D. Witthaut, B. Sch ¨afer, and H. Kantz, “Stochastic properties of the frequency dynamics in real and synthetic power grids,”Phys. Rev. Res., vol. 2, p. 013339, Mar 2020. [Online]. Available: https://link.aps.org/doi/10.1103/PhysRevResearch. 2.013339
-
[11]
Effects of inertia, load damping and dead-bands on frequency histograms and frequency control of power systems,
D. del Giudice, A. Brambilla, S. Grillo, and F. Bizzarri, “Effects of inertia, load damping and dead-bands on frequency histograms and frequency control of power systems,”International Journal of Electrical Power & Energy Systems, vol. 129, p. 106842, 2021. [Online]. Available: https://www.sciencedirect.com/science/article/pii/S014206152100082X
2021
-
[12]
Data-Driven Model of the Power-Grid Frequency Dynamics,
L. Rydin Gorj ˜ao, M. Anvari, H. Kantz, C. Beck, D. Witthaut, M. Timme, and B. Sch ¨afer, “Data-Driven Model of the Power-Grid Frequency Dynamics,”IEEE Access, vol. 8, pp. 43 082–43 097, 2020
2020
-
[13]
Open database analysis of scaling and spatio-temporal properties of power grid frequencies,
L. Rydin Gorj ˜ao, R. Jumar, H. Maass, C. Beck, J. Kurths, C. M. Winkel- mann, D. Witthaut, M. Timme, and B. Sch ¨afer, “Open database analysis of scaling and spatio-temporal properties of power grid frequencies,” Nature Communications, vol. 11, p. 6362, 2020
2020
-
[14]
Phase and Amplitude Synchronization in Power-Grid Frequency Fluctuations in the Nordic Grid,
L. Rydin Gorj ˜ao, L. Vanfretti, D. Witthaut, C. Beck, and B. Sch ¨afer, “Phase and Amplitude Synchronization in Power-Grid Frequency Fluctuations in the Nordic Grid,”IEEE Access, vol. 10, pp. 18 065–18 073, 2021. [Online]. Available: https://api.semanticscholar. org/CorpusID:233481482
2021
-
[15]
The stochastic nature of power- grid frequency in south africa,
L. Rydin Gorj ˜ao and J. Maritz, “The stochastic nature of power- grid frequency in south africa,”Journal of Physics: Complexity, vol. 4, no. 1, p. 015007, feb 2023. [Online]. Available: https: //doi.org/10.1088/2632-072X/acb629
-
[16]
Propagation of wind-power-induced fluctuations in power grids,
H. Haehne, K. Schmietendorf, S. Tamrakar, J. Peinke, and S. Kettemann, “Propagation of wind-power-induced fluctuations in power grids,”Phys. Rev. E, vol. 99, p. 050301, May 2019. [Online]. Available: https://link.aps.org/doi/10.1103/PhysRevE.99.050301
-
[17]
Towards Realistic Statistical Models of the Grid Frequency,
D. Kraljic, “Towards Realistic Statistical Models of the Grid Frequency,” IEEE Transactions on Power Systems, vol. 38, no. 1, pp. 256–266, 2023
2023
-
[18]
Nonstandard power grid frequency statistics across continents,
X. Wen, M. Anvari, L. Rydin Gorj ˜ao, G. C. Yalcin, V . Hagenmeyer, and B. Sch ¨afer, “Nonstandard power grid frequency statistics across continents,”Scientific Reports, vol. 15, no. 1, p. 38470, Nov 2025. [Online]. Available: https://doi.org/10.1038/s41598-025-25334-4
-
[19]
Understanding the complexity of frequency and phase angle fluctuations in power grids
A. Lonardi, J. M. Maritz, L. R. Gorj ˜ao, and C. Beck, “Understanding the complexity of frequency and phase angle fluctuations in power grids,” 2026. [Online]. Available: https://arxiv.org/abs/2604.03133
work page internal anchor Pith review Pith/arXiv arXiv 2026
-
[20]
Non-linear, bivariate stochastic modelling of power- grid frequency applied to islands,
U. Oberhofer, L. R. Gorjao, G. C. Yalcin, O. Kamps, V . Hagenmeyer, and B. Schafer, “Non-linear, bivariate stochastic modelling of power- grid frequency applied to islands,” in2023 IEEE Belgrade PowerTech, 2023, pp. 1–1
2023
-
[21]
Nonlinear Stochastic Modeling of the South Korean Power Grid Frequency Dynamics,
U. Oberhofer, X. Wen, J. Lee, H. Kim, V . Hagenmeyer, and B. Sch ¨afer, “Nonlinear Stochastic Modeling of the South Korean Power Grid Frequency Dynamics,” in2025 IEEE Kiel PowerTech, 2025, pp. 1–6
2025
-
[22]
Dynamical foundations of nonextensive statistical mechanics,
C. Beck, “Dynamical foundations of nonextensive statistical mechanics,” Phys. Rev. Lett., vol. 87, p. 180601, Oct 2001. [Online]. Available: https://link.aps.org/doi/10.1103/PhysRevLett.87.180601
-
[23]
Superstatistics,
C. Beck and E. Cohen, “Superstatistics,”Physica A: Statistical Mechanics and its Applications, vol. 322, pp. 267–275, 2003. [Online]. Available: https://www.sciencedirect.com/science/article/pii/ S0378437103000190
2003
-
[24]
Phase transitions in the gaussian core system,
F. H. Stillinger, “Phase transitions in the gaussian core system,”The Journal of Chemical Physics, vol. 65, no. 10, pp. 3968–3974, 11 1976. [Online]. Available: https://doi.org/10.1063/1.432891
-
[25]
Fluid and solid phases of the Gaussian core model,
A. Lang, C. N. Likos, M. Watzlawek, and H. L ¨owen, “Fluid and solid phases of the Gaussian core model,”Journal of Physics: Condensed Matter, vol. 12, no. 24, p. 5087, jun 2000. [Online]. Available: https://doi.org/10.1088/0953-8984/12/24/302
-
[26]
Thermodynamic geometry of the gaussian core model fluid,
G. Ruppeiner, P. Mausbach, and H.-O. May, “Thermodynamic geometry of the gaussian core model fluid,”Fluid Phase Equilibria, vol. 542-543, p. 113033, 2021. [Online]. Available: https://www.sciencedirect.com/ science/article/pii/S0378381221000959
2021
-
[27]
Impact of low rotational inertia on power system stability and operation,
A. Ulbig, T. S. Borsche, and G. Andersson, “Impact of low rotational inertia on power system stability and operation,”IFAC Proceedings Volumes, vol. 47, no. 3, pp. 7290–7297, 2014
2014
-
[28]
Decision on Dynamic Regulation, Dynamic Moderation, and Dynamic Containment in relation to an update to the Terms and Conditions related to Balancing,
Ofgem, “Decision on Dynamic Regulation, Dynamic Moderation, and Dynamic Containment in relation to an update to the Terms and Conditions related to Balancing,” 2023
2023
-
[29]
Fokker-planck equation,
H. Risken, “Fokker-planck equation,” inThe Fokker-Planck equation: methods of solution and applications. Springer, 1989, pp. 63–95
1989
-
[30]
For MLE, we use the open-source code available at https://github.com/aleable/power-grid-complexity
-
[31]
System frequency,
National Energy System Operator, “System frequency,” [Online]. Avail- able: https://www.neso.energy/data-portal/system-frequency-data, 2025, accessed: 2026-04-21
2025
-
[32]
A survey of frequency and voltage control ancillary services—part i: Technical features,
Y . G. Rebours, D. S. Kirschen, M. Trotignon, and S. Rossignol, “A survey of frequency and voltage control ancillary services—part i: Technical features,”IEEE Transactions on Power Systems, vol. 22, no. 1, pp. 350–357, 2007
2007
-
[33]
Annual Trading Results of 2024 - Power Trading on EPEX SPOT reaches all-time high,
EPEX SPOT, “Annual Trading Results of 2024 - Power Trading on EPEX SPOT reaches all-time high,” 2024
2024
-
[34]
Statistics of Three-Dimensional Lagrangian Turbulence,
C. Beck, “Statistics of Three-Dimensional Lagrangian Turbulence,” Phys. Rev. Lett., vol. 98, p. 064502, Feb 2007. [Online]. Available: https://link.aps.org/doi/10.1103/PhysRevLett.98.064502
discussion (0)
Sign in with ORCID, Apple, or X to comment. Anyone can read and Pith papers without signing in.