The fine structure of electricity price volatility
Pith reviewed 2026-06-30 21:49 UTC · model grok-4.3
The pith
Leverage effects in electricity price volatility disappear after conditioning on state variables.
A machine-rendered reading of the paper's core claim, the machinery that carries it, and where it could break.
Core claim
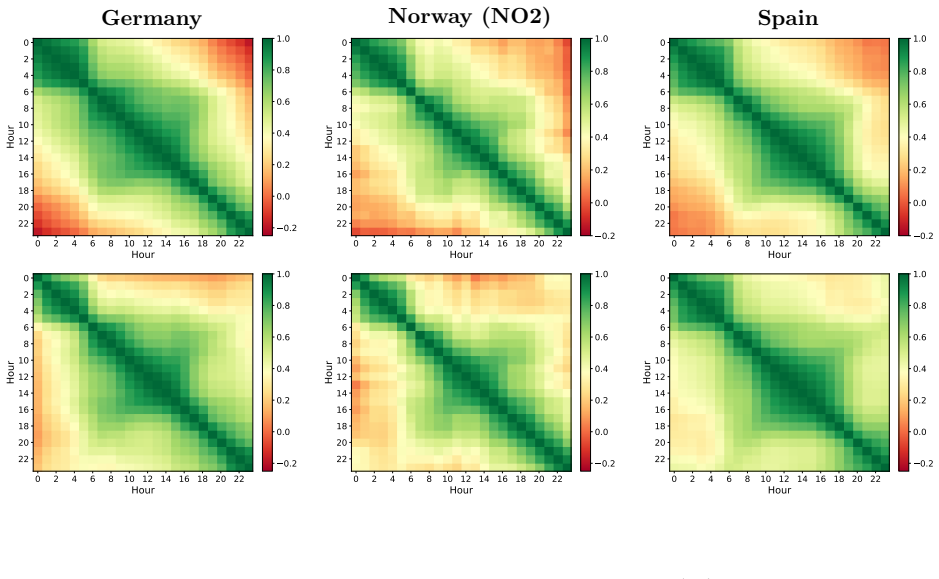
Interpreting day-ahead electricity prices as local averages of a latent process governed by a stochastic partial differential equation, the authors construct estimators for weekly integrated variance that correct for mean-reversion and semigroup effects. Decomposition of estimates across German, Norwegian, and Spanish markets shows distinct volatility drivers per zone with differing generation impacts. Leverage effects vanish upon conditioning on suitable state variables, establishing that electricity price volatility lacks general asymmetric responses to price shocks.
What carries the argument
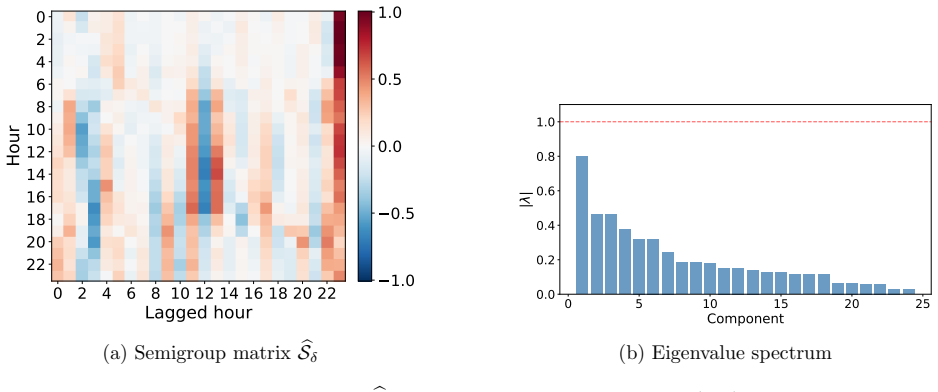
Estimators of weekly integrated variance derived from an SPDE latent price process, adjusted for mean-reversion and semigroup-smoothing.
If this is right
- Each generation zone has very different drivers of volatility.
- The impact of generation variables on volatility differs considerably across zones.
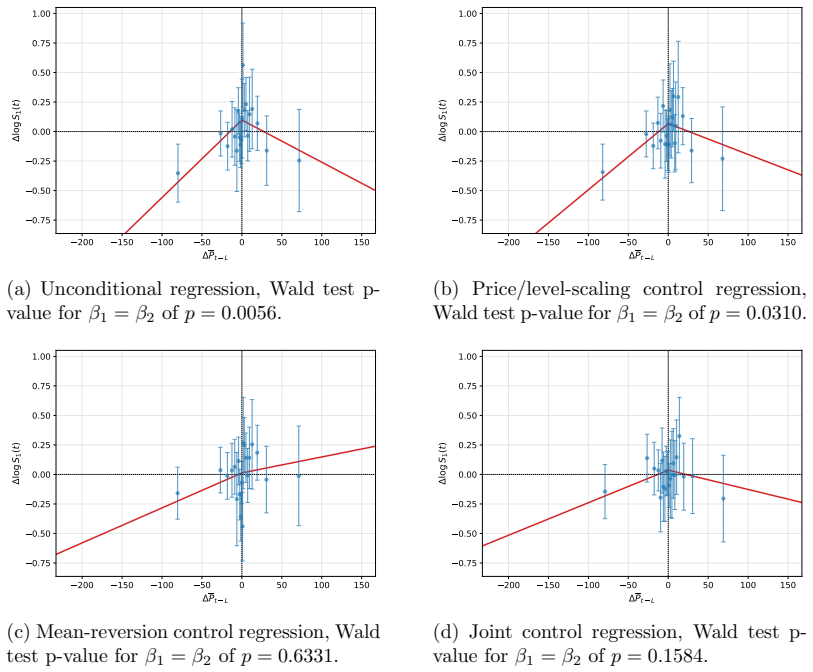
- Leverage effects do not persist once suitable state variables are conditioned on.
- Volatility estimation in this setting requires explicit handling of the infinite-dimensional SPDE complications.
Where Pith is reading between the lines
- Standard models that assume persistent leverage in power prices may need to incorporate conditioning on observable state variables instead.
- Risk management practices in electricity markets could shift focus toward the identified state variables for better volatility forecasts.
- The averaging interpretation of day-ahead prices may apply to volatility studies in other markets with similar auction structures.
Load-bearing premise
Day-ahead prices can be treated as local averages of a latent price process governed by a stochastic partial differential equation so the estimators recover true weekly integrated variance.
What would settle it
If leverage effects remain statistically significant after conditioning on the identified state variables using the same or new price panels, the claim of no general asymmetric response would fail.
Figures


read the original abstract
We conduct the first rigorous study of electricity price volatility for the full panel of electricity prices across three European generation zones. By interpreting the observed day-ahead prices as local averages of a latent price process governed by a stochastic partial differential equation, we develop estimators of the weekly integrated variance. The inherently infinite dimensional setting introduce several complications that are not relevant in the conventional finite dimensional semimartingale setting, and we spend considerable effort in dealing with these. In particular, we must account for both mean-reversion in prices and semigroup-smoothing in the estimated variance. We provide a detailed decomposition and interpretation of the empirical estimates across three vastly different European generation zones, namely Germany, Norway, and Spain. Our findings indicate that each zone has very different drivers of volatility, and that the impact of generation variables differs considerably. We document that leverage effects appear to be present at first sight, but disappear once we condition on suitable state variables, thereby showing that electricity price volatility does not generally exhibit asymmetric responses to price shocks.
Editorial analysis
A structured set of objections, weighed in public.
Referee Report
Summary. The manuscript conducts the first rigorous study of electricity price volatility across the full panel of day-ahead prices in three European generation zones (Germany, Norway, Spain). By modeling observed prices as local averages of a latent price process governed by a stochastic partial differential equation (SPDE), the authors derive estimators for weekly integrated variance that explicitly account for mean-reversion and semigroup-smoothing in the infinite-dimensional setting. They provide a detailed decomposition of the resulting estimates, document zone-specific volatility drivers, and show that apparent leverage effects disappear once suitable state variables are conditioned on, implying that electricity price volatility does not generally exhibit asymmetric responses to price shocks.
Significance. If the SPDE-based estimators are valid, the work is significant for challenging the conventional presence of leverage effects in electricity markets and for highlighting heterogeneous, generation-driven volatility dynamics across zones. The explicit handling of infinite-dimensional complications (mean-reversion and semigroup-smoothing) and the provision of a detailed empirical decomposition represent strengths that could inform both academic modeling and practical risk management in power markets.
minor comments (3)
- [Abstract and §1] The abstract and introduction would benefit from a brief statement of the precise form of the SPDE and the key estimator equations to orient readers before the detailed derivations.
- [§5] Clarify the exact construction of the conditioning state variables (e.g., which generation or load variables are included) so that the disappearance of leverage effects can be directly replicated from the reported estimates.
- [Figures 1–4] Figure captions should explicitly note the sample period and any data filtering applied to the day-ahead price series for each zone.
Simulated Author's Rebuttal
We thank the referee for the positive and accurate summary of our manuscript, the assessment of its significance for electricity market volatility modeling, and the recommendation of minor revision. The report correctly identifies our core contributions: the first rigorous panel study across three European zones using SPDE-based estimators that handle mean-reversion and semigroup smoothing, the zone-specific volatility decompositions, and the finding that apparent leverage effects vanish after state-variable conditioning.
Circularity Check
No significant circularity in SPDE estimator development or leverage effect analysis
full rationale
The paper's derivation proceeds by positing an SPDE model for a latent price process, interpreting day-ahead prices as local averages thereof, and constructing explicit estimators for weekly integrated variance that adjust for mean-reversion and semigroup-smoothing. These estimators are then applied to empirical data across zones to produce volatility decompositions and conditional leverage analyses. No step reduces a reported finding or prediction to an input parameter by construction, nor does any load-bearing claim rest on a self-citation chain; the central empirical conclusion follows from the data analysis rather than tautological re-expression of fitted quantities.
Axiom & Free-Parameter Ledger
Forward citations
Cited by 1 Pith paper
-
Forecasting of volatility and risk premia in electricity markets
Matrix-HAR model with multi-horizon lags and renewable generation inputs improves one-week forecasts of realized covariation and spread risk premia versus standard backward-looking volatility methods in electricity markets.
Reference graph
Works this paper leans on
-
[1]
Andersen, T. G., & Bollerslev, T. (1998). Answering the skeptics: Yes, standard volatility models do provide accurate forecasts.International Economic Review,39(4), 885–905. https://doi. org/https://doi.org/10.2307/2527343 Andersen, T. G., Bollerslev, T., Diebold, F. X., & Ebens, H. (2001). The distribution of realized stock return volatility.Journal of F...
-
[2]
https://doi.org/https://doi.org/10.1016/j.spa.2021.12.011 Chen, Y., & Li, B. (2017). An adaptive functional autoregressive forecast model to predict electricity price curves.Journal of Business & Economic Statistics,35(3), 371–388. https://doi.org/ 10.1080/07350015.2015.1092976 Chen, Y., Marron, J. S., & Zhang, J. (2019). Modeling seasonality and serial d...
-
[3]
By the Itˆ o isometry for cylindrical noise (Da Prato & Zabczyk, 2014, see, e.g., ), it follows that E MnM ∗ n | F tn−1 =E "Z tn tn−1 S(t n −s)Σ sS(t n −s) ∗ ds Ftn−1 #
It remains to identify the conditional second moment ofM n. By the Itˆ o isometry for cylindrical noise (Da Prato & Zabczyk, 2014, see, e.g., ), it follows that E MnM ∗ n | F tn−1 =E "Z tn tn−1 S(t n −s)Σ sS(t n −s) ∗ ds Ftn−1 # . Premultiplying and postmultiplying byAandA ∗ yields (6). The coordinate-wise identity follows by taking (i, j) entries and usi...
2014
-
[4]
Consequently, E[A(B1 +D 1)(B1 +D 1)∗A∗] =O(δ 2α)
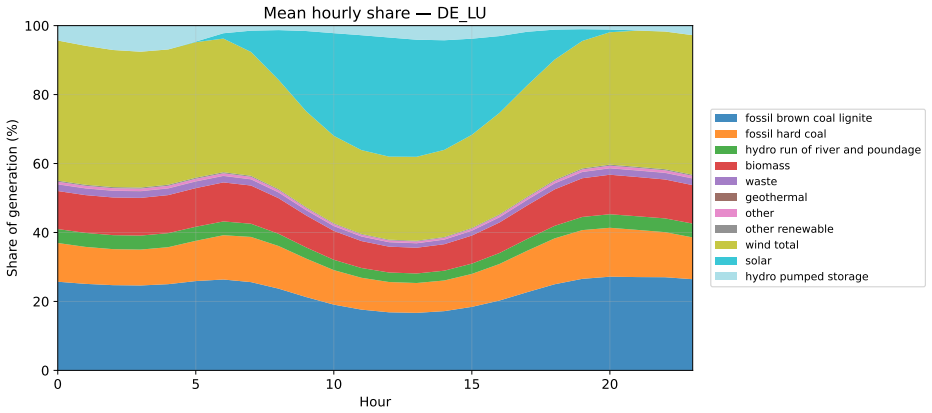
and is thus of no larger order. Consequently, E[A(B1 +D 1)(B1 +D 1)∗A∗] =O(δ 2α). B Data description The spot price data is gathered via the ENTSO-E transparency platform https://transparency.entsoe.eu/. In addition to the price data, there is also data on forecasted load (demand), wind production and solar production. These forecasts are available and us...
2020
discussion (0)
Sign in with ORCID, Apple, or X to comment. Anyone can read and Pith papers without signing in.