Recent advances in statistical methodology applied to the Hjort liver index time series (1859-2012) and associated influential factors
Pith reviewed 2026-05-15 02:25 UTC · model grok-4.3
The pith
Recent statistical methods can fruitfully analyze the 150-year Hjort liver index time series for Atlantic cod and its environmental interactions.
A machine-rendered reading of the paper's core claim, the machinery that carries it, and where it could break.
Core claim
Certain recent advances in statistical methodology have promising potential for fruitful use in general biology and the fisheries sciences, as illustrated through accurate modelling via focused model selection techniques, dynamic goodness-of-fit testing of processes evolving over time, finding break points for phenomena experiencing changes, prediction uncertainty, and optimal combination of information across diverse sources via confidence distributions, applied to the Hjort liver quality index time series from 1859-2012 and its relations to associated factors like Kola winter temperatures, length distribution parameters, cod mortality, and food availability.
What carries the argument
The Hjort liver quality index time series, reconstructed from 1859 to 2012, serves as the central object, with the statistical machinery of focused model selection, dynamic goodness-of-fit tests, break point finding, and confidence distributions carrying the analysis of its temporal evolution and factor interactions.
If this is right
- The liver index series can be accurately modeled and its changes over time tested dynamically.
- Break points in the cod liver quality phenomena can be identified.
- Prediction uncertainty for the index and related factors can be quantified.
- Information from the series and associated factors can be combined optimally using confidence distributions.
- These methods offer detailed examination of how the liver index interacts with temperatures, mortality, and food availability.
Where Pith is reading between the lines
- Applying these methods to other historical fisheries data could reveal similar long-term trends influenced by climate factors.
- The insights into energy allocation patterns might help predict future cod population responses to warming seas.
- Further extensions could incorporate additional variables like ocean acidification or fishing pressure into the models.
- Validation with independent modern data sets would strengthen the applicability to current fisheries management.
Load-bearing premise
The historical liver index series and associated factors are sufficiently accurate and complete for the advanced dynamic and focused-model techniques to yield reliable inferences without substantial measurement error or selection bias in the archival reconstruction.
What would settle it
Reconstructing the liver index series using alternative archival methods and finding substantially different break points or factor relationships would falsify the reliability of the inferences from the current reconstruction.
Figures


read the original abstract
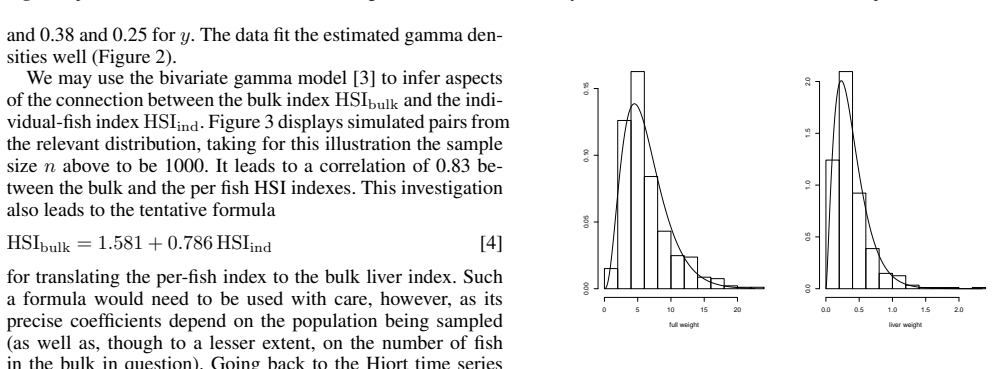
Certain recent advances in statistical methodology have promising potential for fruitful use in general biology and the fisheries sciences. This paper reviews and discusses some of the relevant themes, including accurate modelling via focused model selection techniques, dynamic goodness-of-fit testing of processes evolving over time, finding break points for phenomena experiencing changes, prediction uncertainty, and optimal combination of information across diverse sources via confidence distributions. The methods are illustrated for the Hjort liver quality index time series. Its roots lie in the classic Hjort (`Fluctuations in the Great Fisheries of Northern Europe, Viewed in the Light of Biological Research', 1914), where liver quality of the Atlantic cod {\it (Gadus morhua)} for 1880--1912 is reported on and studied, along with related factors, making it one of the first teleost time series ever published. Diligent work by Kjesbu et al. (`Making use of Johan Hjort's `unknown' legacy: reconstruction of a 150-year coastal time-series on northeast Arctic cod (Gadus morhua) liver data reveals long-term trends in energy allocation patterns', 2014), involving both archival and calibration efforts, have extended the series both backwards and forwards in time, to 1859--2012, yielding one of the longest time series of marine science. Our study offers a detailed examination of this series and how it relates to and interacts with associated factors, including Kola winter temperatures, length distribution parameters, cod mortality, and a certain index related to availability of food.
Editorial analysis
A structured set of objections, weighed in public.
Referee Report
Summary. The paper reviews recent statistical advances such as focused model selection, dynamic goodness-of-fit testing, break-point detection, prediction uncertainty quantification, and confidence distributions, arguing for their promising potential in biology and fisheries sciences. These methods are illustrated through a detailed examination of the reconstructed Hjort liver quality index time series for Atlantic cod (Gadus morhua) spanning 1859–2012, originally rooted in Hjort (1914) and extended via archival and calibration work in Kjesbu et al. (2014), along with its interactions with covariates including Kola winter temperatures, length distribution parameters, cod mortality, and a food availability index.
Significance. If the data reconstruction proves reliable and the methods are applied with full diagnostics and validation, the work could usefully demonstrate how modern statistical tools handle long-term ecological time series in fisheries, potentially aiding inference on energy allocation patterns and environmental drivers. However, the absence of any quantitative results, error bars, model diagnostics, or cross-validation in the abstract (and by extension the visible framing) limits the ability to evaluate whether the illustration substantiates the claimed fruitful applications.
major comments (2)
- [Abstract] Abstract: The central claim that the statistical methods have 'promising potential for fruitful use' rests on an illustration of the Hjort series, yet the abstract (and visible framing) contains no quantitative results, fitted models, error bars, goodness-of-fit statistics, or validation steps, leaving the demonstration unsupported.
- [Data reconstruction] Data section (referenced via Kjesbu et al. 2014 reconstruction): The 1859–2012 liver index series is load-bearing for all reported interactions with Kola temperatures, length distributions, mortality, and food availability, but no sensitivity analyses, error propagation from archival calibration, or cross-validation against independent proxies are described; if reconstruction artifacts dominate, the interactions are not reliable demonstrations of the methods.
minor comments (2)
- [Abstract] The abstract mentions 'a certain index related to availability of food' without naming or citing the specific index, which reduces clarity for readers unfamiliar with the fisheries literature.
- [Methods illustration] No mention is made of software, code availability, or reproducibility steps for the dynamic GOF testing and confidence distribution methods, which would strengthen the illustration.
Simulated Author's Rebuttal
We thank the referee for the constructive comments. We address each major comment point by point below, indicating revisions where appropriate.
read point-by-point responses
-
Referee: [Abstract] Abstract: The central claim that the statistical methods have 'promising potential for fruitful use' rests on an illustration of the Hjort series, yet the abstract (and visible framing) contains no quantitative results, fitted models, error bars, goodness-of-fit statistics, or validation steps, leaving the demonstration unsupported.
Authors: We agree that the abstract would benefit from including key quantitative elements from the illustration to better support the claims. Although the manuscript is primarily a review of statistical methods with the Hjort series as an illustrative case study, we will revise the abstract to incorporate specific findings such as breakpoint locations, model selection results, and brief references to diagnostics performed. revision: yes
-
Referee: [Data reconstruction] Data section (referenced via Kjesbu et al. 2014 reconstruction): The 1859–2012 liver index series is load-bearing for all reported interactions with Kola temperatures, length distributions, mortality, and food availability, but no sensitivity analyses, error propagation from archival calibration, or cross-validation against independent proxies are described; if reconstruction artifacts dominate, the interactions are not reliable demonstrations of the methods.
Authors: The liver index reconstruction, including archival and calibration details, is fully described and validated in the cited Kjesbu et al. (2014) paper. Our work applies the reviewed statistical methods to this established series rather than re-validating the data source. We will add explicit cross-references in the data section to the validation procedures in Kjesbu et al. and note limitations of the reconstruction. New sensitivity analyses or cross-validations cannot be performed here, as they would require the original raw archival materials. revision: partial
- Conducting new sensitivity analyses, error propagation, or independent cross-validation on the Hjort liver index reconstruction, since these require access to raw archival data not available in this study
Circularity Check
No circularity: external methods applied to cited reconstruction
full rationale
The paper reviews standard statistical techniques (focused model selection, dynamic GOF, breakpoint detection, confidence distributions) and applies them to the Hjort liver index series. The series itself originates from the 2014 Kjesbu et al. reconstruction (self-cited by one co-author), but the paper presents no equations, derivations, or 'predictions' that reduce to fitted inputs or self-referential definitions. The central claim is simply that these methods have potential for biology/fisheries, illustrated via application; the reconstruction accuracy is an external assumption, not a load-bearing step that collapses by construction. No self-citation chain justifies a uniqueness theorem or ansatz. This is a normal non-circular application paper.
Axiom & Free-Parameter Ledger
axioms (1)
- domain assumption The extended Hjort liver index time series and its associated factors (temperatures, length distributions, mortality, food index) are accurate and representative of the underlying biological processes.
Lean theorems connected to this paper
-
IndisputableMonolith/Cost/FunctionalEquation.leanwashburn_uniqueness_aczel unclear?
unclearRelation between the paper passage and the cited Recognition theorem.
focused model selection techniques, dynamic goodness-of-fit testing... break points... confidence distributions
-
IndisputableMonolith/Foundation/RealityFromDistinction.leanreality_from_one_distinction unclear?
unclearRelation between the paper passage and the cited Recognition theorem.
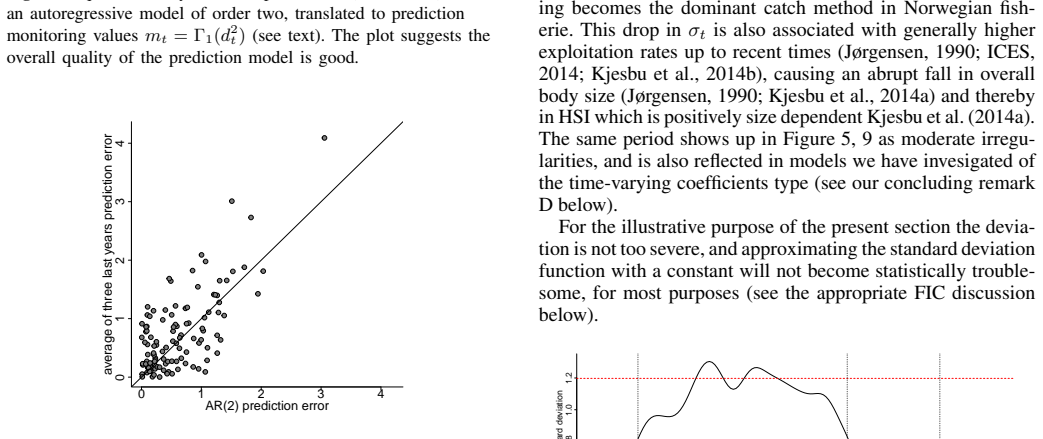
autoregressive model of order two... monitoring bridge plot... Brownian bridge
What do these tags mean?
- matches
- The paper's claim is directly supported by a theorem in the formal canon.
- supports
- The theorem supports part of the paper's argument, but the paper may add assumptions or extra steps.
- extends
- The paper goes beyond the formal theorem; the theorem is a base layer rather than the whole result.
- uses
- The paper appears to rely on the theorem as machinery.
- contradicts
- The paper's claim conflicts with a theorem or certificate in the canon.
- unclear
- Pith found a possible connection, but the passage is too broad, indirect, or ambiguous to say the theorem truly supports the claim.
Reference graph
Works this paper leans on
-
[1]
Aalen, O. O. and Borgan,. Survival and Event History Analysis: A Process Point of View , publisher =
-
[2]
Selected Papers of Hirotugu Akaike , pages=
Information theory and an extension of the maximum likelihood principle , author=. Selected Papers of Hirotugu Akaike , pages=. 1998 , publisher=
work page 1998
-
[3]
Annals of the institute of Statistical Mathematics , volume=
Fitting autoregressive models for prediction , author=. Annals of the institute of Statistical Mathematics , volume=
-
[4]
Brillinger, D. R. , title =
-
[5]
Brockwell, P. J. and Davis, R.A. , title =
-
[6]
Banerjee, M. and McKeague, I. , title =. Annals of Statistics , volume =. 2007 , pages =
work page 2007
- [7]
- [8]
-
[9]
Boitsov, V. D. and Karsakov, A. L. and Trofimov, A. G. , title =. ICES Journal of Marine Science , volume =
-
[10]
Statistical Science , volume =
Statistical modeling: the two cultures [with discussion and a rejoinder] , author =. Statistical Science , volume =
- [11]
-
[12]
Claeskens, G. and Hjort, N. L. , title =. Journal of the American Statistical Association , volume =
- [13]
- [14]
-
[15]
Journal of the American Statistical Association , volume =
Distribution of the estimators for autoregressive time series with a unit root , author =. Journal of the American Statistical Association , volume =
- [16]
-
[17]
Frigessi, A. and Hjort, N. L. , title =. Journal of Nonparametric Statistics , volume =. 2002 , pages =
work page 2002
-
[18]
The jump information criterion , institution =
Gr. The jump information criterion , institution =
-
[19]
Hansen, B. E. , title =. Journal of Econometrics , volume =
- [20]
-
[21]
Hermansen, G. H. and Hjort, N. L. , institution =. A new approach to
-
[22]
Submitted for publication , year =
Focused information criteria for time series , author=. Submitted for publication , year =
-
[23]
Hermansen, G. H. and Hjort, N. L. , title =. Submitted for publication , year =
- [24]
- [25]
- [26]
- [27]
-
[28]
Hjort, J. and Jahn, G. and Ottestad, P. , title =. Hvalr dets skrifter: Scientific results of marine biological research , year =
-
[29]
Hjort, N. L. , title =. Statistical Models and Methods for Biomedical and Technical Systems , editor =
-
[30]
Hjort, N. L. and Claeskens, G. , title =. Journal of the American Statistical Association , volume =
-
[31]
Hjort, N. L. and Koning, A. J. , title =. Journal of Nonparametric Statistics , volume =
-
[32]
Hjort, N. L. and Omre, H. , title =. Scandinavian Journal of Statistics , volume =
-
[33]
Nansen: Oppdageren [The Explorer] , publisher =
J. Nansen: Oppdageren [The Explorer] , publisher =
- [34]
-
[35]
Long-term changes in age at sexual maturity of
J. Long-term changes in age at sexual maturity of. Journal du Conseil: ICES Journal of Marine Science , volume =
-
[36]
Effects of periodic starvation on reproductive investment in first-time spawning
Karlsen,. Effects of periodic starvation on reproductive investment in first-time spawning. Aquaculture , volume =
-
[37]
Kjesbu, O. S. and Solemdal, P. and Bratland, P. and Fonn, M. , title =. Canadian Journal of Fisheries and Aquatic Sciences , volume =
-
[38]
Kjesbu, O. S. and Witthames, P. R. and Solemdal, P. and Greer Walker, M. , title =. Journal of Sea Research , volume =
-
[39]
Kjesbu, O. S. and Righton, D. and Kr. Thermal dynamics of ovarian maturation in. Canadian Journal of Fisheries and Aquatic Sciences , volume =
-
[40]
Kjesbu, O. S. and Opdal, A. F. and Korsbrekke, K. and Devine, J. A. and Skj. Making use of. ICES Journal of Marine Science , notes =
-
[41]
Kjesbu, O. S. and Bogstad, B. and Devine, J. A. and Gj. Synergies between climate and management for. PNAS , volume =
-
[42]
Krivobok, M. N. and Tokareva, G. I. , title =. Fisheries Research Board of Canada [Translation Series No. 2722] , pages =
- [43]
-
[44]
Linhart, H. and G\". On a Criterion for selection of models for stationary time series , journal =. 1985 , volume =
work page 1985
-
[45]
Ljungman, A. V. , title =. Tidskrift for Fiskeri , volume =
-
[46]
Ljungman, A. V. , title =. Report of the United States Fish Commission , volume =
-
[47]
Marshall, C. T. and Yaragina, N. A. and Lambert, Y. and Kjesbu, O. S. , title =. Nature , volume =
-
[48]
Marshall, C. T. and Kjesbu, O. S. and Yaragina, N. A. and Solemdal, P. and Ulltang,. Is spawner biomass a sensitive measure of the reproductive and recruitment potential of. Canadian Journal of Fisheries and Aquatic Sciences , volume =
-
[49]
Canadian Journal of Fisheries and Aquatic Sciences , volume=
Fish behavioral types and their ecological consequences , author=. Canadian Journal of Fisheries and Aquatic Sciences , volume=. 2014 , publisher=
work page 2014
-
[50]
Mjanger, H. and Hestenes, K. and Olsen, E. and Svendsen, B. V. and de lange Wenneck, T. , title =
-
[51]
Myers, R. A. , title =. ICES Journal of Marine Science , volume =
-
[52]
Opdal, A. F. and J. Long-term change in a behavioural trait: truncated spawning distribution and demography in. Global Change Biology , volume =
-
[53]
Ottersen, G. and Hjermann, D. Changes in spawning stock structure strengthen the link between climate and recruitment in a heavily fished cod (. Fisheries Oceanography , volume =
-
[54]
Spectral Analysis and Time Series , author=
-
[55]
Sandeman, L. R. and Yaragina, N. A. and Marshall, C. T. , title =. Journal of Animal Ecology , volume =
-
[56]
Schweder, T. and Hjort, N. L. , title =. Reports of the International Whaling Commission , volume =
-
[57]
Schweder, T. and Hjort, N. L. , title =. Scandinavian Journal of Statistics , volume =
- [58]
-
[59]
Statistical Science , volume =
To explain or to predict? , author =. Statistical Science , volume =
-
[60]
Mechanisms regulating oocyte recruitment and skipped spawning in the
Skj. Mechanisms regulating oocyte recruitment and skipped spawning in the. Canadian Journal of Fisheries and Aquatic Science , volume =
-
[61]
Frequent skipped spawning in the world's largest cod population , journal =
Skj. Frequent skipped spawning in the world's largest cod population , journal =
-
[62]
Annals of Statistics , volume=
Estimating the dimension of a model , author=. Annals of Statistics , volume=
-
[63]
Smith, T. D. , title =
-
[64]
Stearns, S. C. , title =
-
[65]
Tyler, C. R. and Sumpter, J. P. , title =. Reviews in Fish Biology and Fisheries , volume =
- [66]
- [67]
discussion (0)
Sign in with ORCID, Apple, or X to comment. Anyone can read and Pith papers without signing in.