Recognition: no theorem link
Analysis of DQZ White Dwarf Evolution through Procyon
Pith reviewed 2026-05-15 02:42 UTC · model grok-4.3
The pith
Procyon A and B models using MESA tracks indicate higher core overshoot parameters best reproduce the observed masses, temperatures, and luminosities, giving a system age of 2.23 billion years.
A machine-rendered reading of the paper's core claim, the machinery that carries it, and where it could break.
Core claim
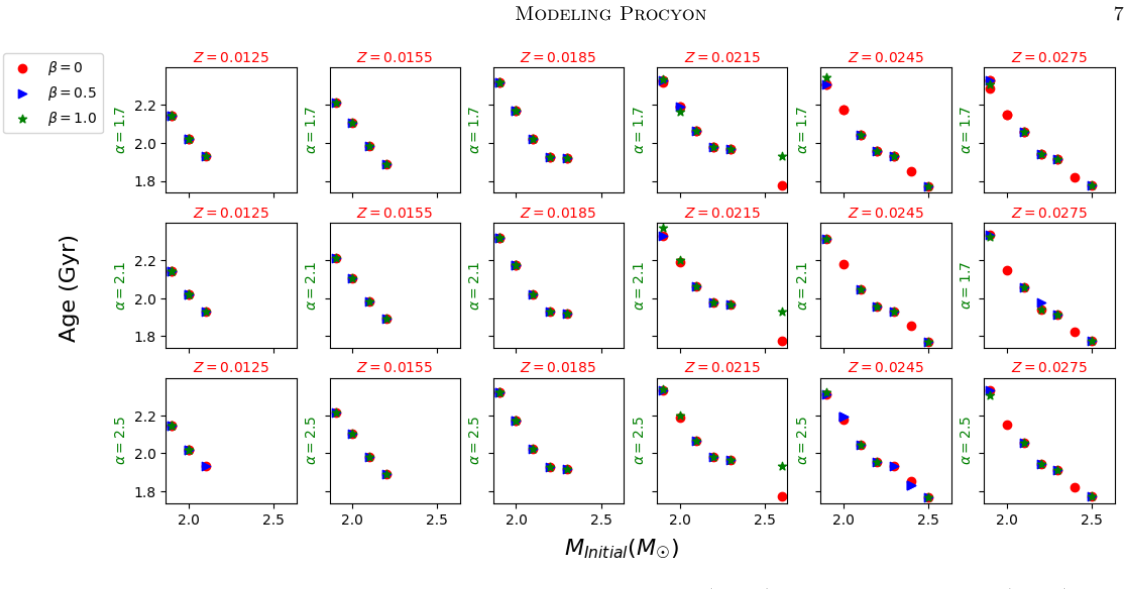
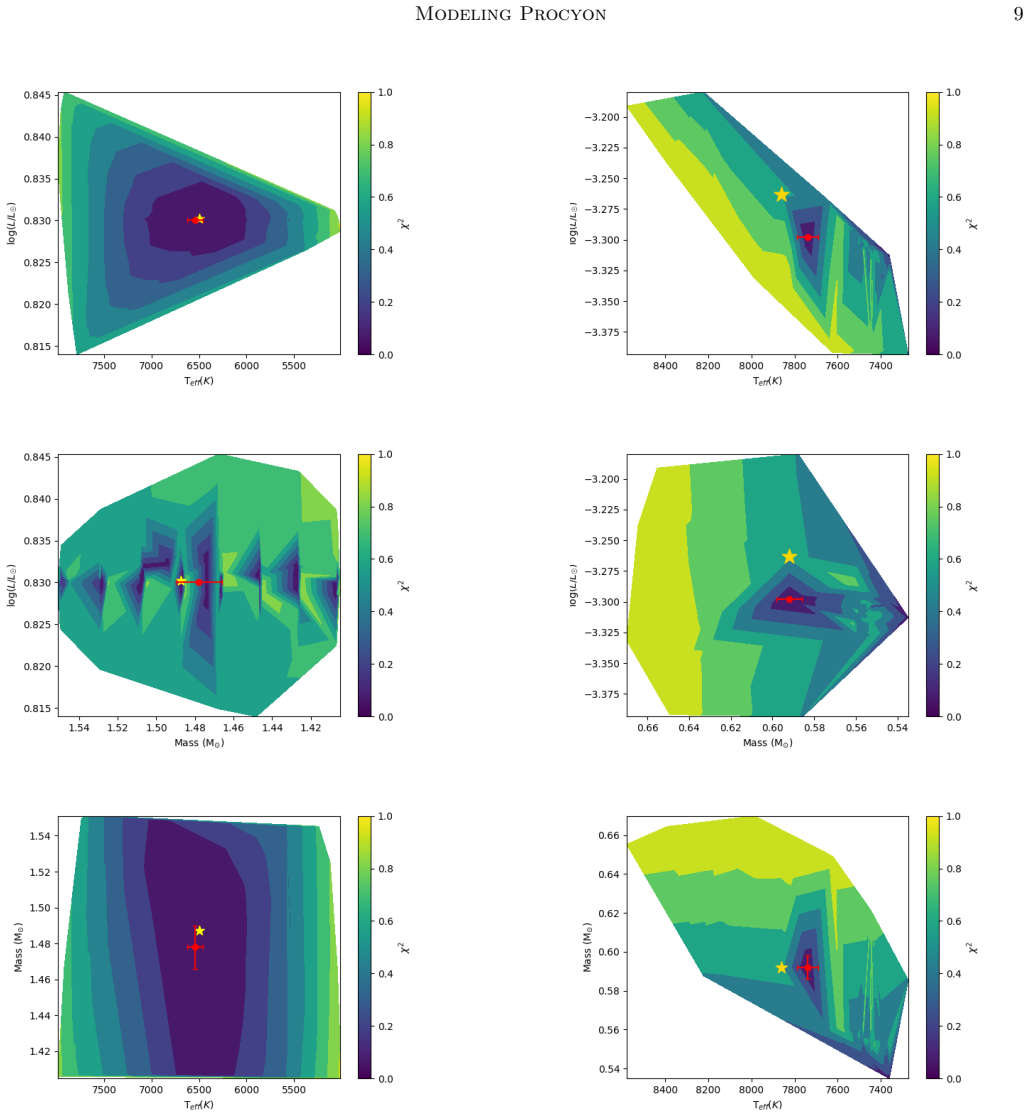
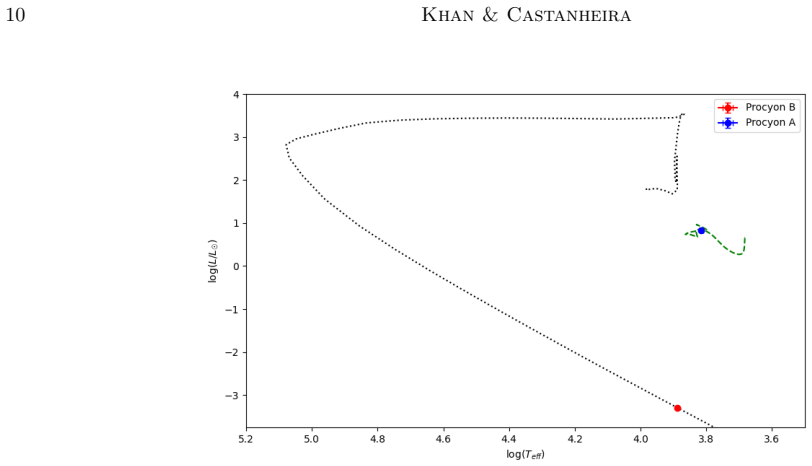
The authors present an extensive grid of MESA evolutionary tracks for Procyon A and B. They systematically vary initial metallicity, mixing length, and core overshoot to match the stars' positions on the H-R diagram. The best-fit models give masses of 1.487 solar masses for A and 0.592 solar masses for B, a system age of 2.23 Gyr, and a white dwarf cooling age of 1.20 Gyr for B. These point to core overshoot parameters between 0.5 and 1.0, higher than the standard range, and map Procyon B to the initial-to-final mass relationship for H-deficient white dwarfs.
What carries the argument
A grid of MESA evolutionary tracks varying metallicity Z, mixing length alpha, and core overshoot beta, used to fit observed properties and derive an initial-to-final mass relationship for the white dwarf.
If this is right
- The system age is constrained to 2.23 ± 0.90 Gyr, consistent with independent measurements.
- Procyon B's progenitor mass lies in the 1.9-2.6 solar mass range on the initial-to-final mass relation for H-deficient white dwarfs.
- Core overshoot values of beta = 0.5-1.0 provide the best fits to the data.
- The white dwarf cooling age of 1.20 ± 0.49 Gyr matches other determinations.
- Accretion of heavy metals can be modeled to fit isotopic abundances in the DQZ white dwarf.
Where Pith is reading between the lines
- Similar modeling grids could be applied to other non-interacting binaries to test if higher core overshoot is needed more broadly in stellar evolution.
- If confirmed, these overshoot values would affect age estimates for other white dwarf systems and their progenitors.
- Future high-precision observations of Procyon could further refine the mixing parameters.
- The metal accretion modeling may help interpret pollution in other DQZ white dwarfs.
Load-bearing premise
That adjusting only metallicity, mixing length, and core overshoot within the MESA code captures all necessary physics without additional effects like rotation or magnetic fields.
What would settle it
A precise measurement of the white dwarf's cooling age or surface abundances that falls significantly outside the ranges predicted by the best-fit models, such as a cooling age below 0.7 Gyr or above 1.7 Gyr.
Figures


read the original abstract
Procyon is a great system to probe stellar evolution of non-interacting binaries. We present an extensive grid of MESA (Modules for Experiments in Stellar Astrophysics) evolutionary tracks to constrain the evolution of Procyon A and B. We systematically vary the initial parameters of our grid anchored by precise dynamical masses and spectroscopic determinations of effective temperature (T$_{eff}$) and luminosity ($L$) to match the stars' positions on the H-R Diagram. Our goal is two-fold: (i) to quantify how the inferred system age and the progenitor mass of Procyon B depend on metallicity ($Z$), mixing length ($\alpha$), and core overshoot ($\beta$), and (ii) to determine the best fitting model of Procyon B within a model-based initial-to-final mass relationship (IMFR) for hydrogen-deficient white dwarfs. Our best-fit models reproduce the observed properties for both components, yielding $M_\mathrm{A}=1.487 \pm 0.095$ M$_{\odot}$, $M_\mathrm{B}=0.592\pm 0.082$ M$_{\odot}$, a system age of $2.23 \pm 0.90$ Gyr, and a white dwarf cooling age of $1.20\pm0.49$ Gyr for Procyon B, consistent with independent determinations. Our results point to higher core overshoot than the standard adopted range, with the best fits ranging from $\beta=0.5-1.0$. From our model grid, we map Procyon B to the initial-to-final mass relationship for H-deficient white dwarfs in the $1.9\!-\!2.6$ M$_{\odot}$ progenitor range. Additionally, we implement the accretion of heavy metals onto the surface of the WD and fit our isotopic abundances to spectroscopic observations. We outline the physics used in our analysis.
Editorial analysis
A structured set of objections, weighed in public.
Referee Report
Summary. The manuscript presents a grid of MESA evolutionary tracks for the Procyon A/B binary system. Anchored by dynamical masses and spectroscopic T_eff and L values, the authors vary metallicity Z, mixing length α, and core overshoot β to match the components' HR-diagram positions. Best-fit models give M_A = 1.487 ± 0.095 M_⊙, M_B = 0.592 ± 0.082 M_⊙, system age 2.23 ± 0.90 Gyr, and Procyon B white-dwarf cooling age 1.20 ± 0.49 Gyr. The work concludes that core overshoot must be raised to β = 0.5–1.0 (above the standard 0.1–0.25 range), maps the progenitor to the initial-to-final mass relation for H-deficient white dwarfs in the 1.9–2.6 M_⊙ range, and models heavy-metal accretion onto the DQZ surface to fit observed abundances.
Significance. If the central result holds, the analysis supplies a useful empirical constraint on core overshoot for ~2 M_⊙ stars that evolve into DQZ white dwarfs, using a binary with independent dynamical masses. The derived ages being consistent with independent determinations and the explicit modeling of metal accretion on the white dwarf are strengths. The work also illustrates how a modest three-parameter grid can be used to explore the initial-to-final mass relation in a well-characterized system.
major comments (2)
- [Abstract/grid-search description] Abstract and grid-search description: The claim that β = 0.5–1.0 is required rests on the assumption that varying only Z, α, and β captures the dominant physics. Because rotation, magnetic braking, and detailed element diffusion are held at default values, any compensatory effect they exert on main-sequence lifetime or surface abundances is absorbed into the reported β range. This is load-bearing for the central conclusion that higher overshoot is needed; a sensitivity test fixing β at standard values (0.1–0.25) while allowing limited variation in rotation or diffusion would directly test whether the elevated β is necessary or an artifact of the restricted parameter space.
- [Results] Results (age and mass uncertainties): The quoted system age uncertainty of ±0.90 Gyr is comparable to the central value itself. It is unclear how the fitting metric (match to HR-diagram position plus dynamical-mass anchors) propagates the input uncertainties on dynamical masses and spectroscopic T_eff/L into the final error bars, or whether any data points were excluded. Explicit definition of the goodness-of-fit statistic and a table of χ² or residual values for the best-fit models versus standard-β models would allow assessment of whether the high-β solutions are statistically preferred.
minor comments (2)
- [Methods] Notation: The overshoot parameter is denoted β; the manuscript should state explicitly whether this is the step-overshoot or exponential-overshoot implementation in MESA and give the precise definition used in the grid.
- [Abstract/Results] The abstract states that the best-fit models reproduce the observed properties; a short table comparing observed versus model T_eff, L, and mass for the adopted best-fit track would improve clarity.
Simulated Author's Rebuttal
We thank the referee for the constructive and detailed comments. We address each major point below and describe the revisions that will be incorporated.
read point-by-point responses
-
Referee: Abstract and grid-search description: The claim that β = 0.5–1.0 is required rests on the assumption that varying only Z, α, and β captures the dominant physics. Because rotation, magnetic braking, and detailed element diffusion are held at default values, any compensatory effect they exert on main-sequence lifetime or surface abundances is absorbed into the reported β range. This is load-bearing for the central conclusion that higher overshoot is needed; a sensitivity test fixing β at standard values (0.1–0.25) while allowing limited variation in rotation or diffusion would directly test whether the elevated β is necessary or an artifact of the restricted parameter space.
Authors: We agree that the three-parameter grid does not explore the full range of possible physics and that rotation or diffusion could in principle compensate for lower overshoot. Our analysis is explicitly limited to the parameters Z, α, and β as stated in the methods, and within this space the data require β = 0.5–1.0 for acceptable fits. We will add a dedicated paragraph in the discussion acknowledging this restriction and noting that future expanded grids including rotation and diffusion would be needed to test whether the elevated β remains necessary. Performing such a sensitivity test lies beyond the scope of the present study. revision: partial
-
Referee: Results (age and mass uncertainties): The quoted system age uncertainty of ±0.90 Gyr is comparable to the central value itself. It is unclear how the fitting metric (match to HR-diagram position plus dynamical-mass anchors) propagates the input uncertainties on dynamical masses and spectroscopic T_eff/L into the final error bars, or whether any data points were excluded. Explicit definition of the goodness-of-fit statistic and a table of χ² or residual values for the best-fit models versus standard-β models would allow assessment of whether the high-β solutions are statistically preferred.
Authors: We will revise the results section to explicitly define the goodness-of-fit statistic as a reduced χ² constructed from the residuals in T_eff, luminosity, and dynamical mass for both components. We will also add a table that reports the χ² values and individual residuals for the best-fit high-β models versus models computed with standard overshoot (β = 0.1–0.25). The large age uncertainty arises from propagating the observational errors on dynamical masses and spectroscopic parameters through the discrete grid; this propagation procedure will be described in the revised text. No data points were excluded from the fit. revision: yes
Circularity Check
No significant circularity; standard grid fitting to external data
full rationale
The paper generates MESA evolutionary tracks by varying initial metallicity Z, mixing length α, and core overshoot β, then identifies best-fit models by direct comparison to independently measured dynamical masses, spectroscopic T_eff, and luminosities for both Procyon components. Reported values for system age, white dwarf cooling age, progenitor mass, and preferred β range (0.5-1.0) are outputs of this matching procedure against external constraints. No load-bearing step reduces by construction to a self-definition, fitted input renamed as prediction, or self-citation chain; the derivation remains self-contained as numerical models are calibrated to observations without tautological re-derivation of inputs from outputs.
Axiom & Free-Parameter Ledger
free parameters (3)
- metallicity Z
- mixing length alpha
- core overshoot beta
axioms (1)
- domain assumption MESA evolutionary tracks with standard input physics accurately represent the evolution of non-interacting binary stars when anchored by dynamical masses and spectroscopy
Reference graph
Works this paper leans on
-
[1]
Alcock, C., Fristrom, C. C., & Siegelman, R. 1986, ApJ, 302, 462, doi: 10.1086/164005 Allende Prieto, C., Asplund, M., Garc´ ıa L´ opez, R. J., &
-
[2]
Lambert, D. L. 2002, ApJ, 567, 544, doi: 10.1086/338248 Allende Prieto, C., Barklem, P. S., Lambert, D. L., &
-
[3]
2004, A&A, 420, 183, doi: 10.1051/0004-6361:20035801
Cunha, K. 2004, A&A, 420, 183, doi: 10.1051/0004-6361:20035801
-
[4]
Arentoft, T., Kjeldsen, H., Bedding, T. R., et al. 2008, ApJ, 687, 1180, doi: 10.1086/592040
-
[5]
Asplund, M., Grevesse, N., Sauval, A. J., & Scott, P. 2009, ARA&A, 47, 481, doi: 10.1146/annurev.astro.46.060407.145222
-
[6]
Aufdenberg, J. P., Ludwig, H. G., & Kervella, P. 2005, ApJ, 633, 424, doi: 10.1086/452622
-
[7]
K., Thomas Armstrong, J., Clark, J
Baines, E. K., Thomas Armstrong, J., Clark, J. H., et al. 2021, AJ, 162, 198, doi: 10.3847/1538-3881/ac2431
-
[8]
Barnett, J. W., Williams, K. A., B´ edard, A., & Bolte, M. 2021, AJ, 162, 162, doi: 10.3847/1538-3881/ac1423
-
[9]
Bedding, T. R., Kjeldsen, H., Campante, T. L., et al. 2010, ApJ, 713, 935, doi: 10.1088/0004-637X/713/2/935
-
[10]
1995, PASP, 107, 1047, doi: 10.1086/133661
Bergeron, P., Wesemael, F., & Beauchamp, A. 1995, PASP, 107, 1047, doi: 10.1086/133661
-
[11]
Bessel, F. W. 1844, MNRAS, 6, 136, doi: 10.1093/mnras/6.11.136
-
[12]
1995, A&A, 299, 755 B¨ ohm-Vitense, E
Bloecker, T. 1995, A&A, 299, 755 B¨ ohm-Vitense, E. 1958, ZA, 46, 108
work page 1995
-
[13]
Bond, H. E., Gilliland, R. L., Schaefer, G. H., et al. 2015, ApJ, 813, 106, doi: 10.1088/0004-637X/813/2/106
-
[14]
2012, A&A, 540, A5, doi: 10.1051/0004-6361/201118652
Chiavassa, A., Bigot, L., Kervella, P., et al. 2012, A&A, 540, A5, doi: 10.1051/0004-6361/201118652
-
[15]
2018, ApJ, 866, 21, doi: 10.3847/1538-4357/aadfd6
Ramirez-Ruiz, E., & Choi, J. 2018, ApJ, 866, 21, doi: 10.3847/1538-4357/aadfd6
-
[16]
Straka, C. W. 2008, Ap&SS, 316, 31, doi: 10.1007/s10509-007-9698-y
-
[17]
Drake, S. A., Simon, T., & Brown, A. 1993, ApJ, 406, 247, doi: 10.1086/172436
-
[18]
Ferguson, J. W., Alexander, D. R., Allard, F., et al. 2005, ApJ, 623, 585, doi: 10.1086/428642
-
[19]
2006, AJ, 131, 1015, doi: 10.1086/498894
Gatewood, G., & Han, I. 2006, AJ, 131, 1015, doi: 10.1086/498894
-
[20]
2012, ApJS, 199, 29, doi: 10.1088/0067-0049/199/2/29
Giammichele, N., Bergeron, P., & Dufour, P. 2012, ApJS, 199, 29, doi: 10.1088/0067-0049/199/2/29
-
[21]
Girard, T. M., Wu, H., Lee, J. T., et al. 2000, AJ, 119, 2428, doi: 10.1086/301353
-
[22]
B., Demarque, P., & Gruberbauer, M
Guenther, D. B., Demarque, P., & Gruberbauer, M. 2014, ApJ, 787, 164, doi: 10.1088/0004-637X/787/2/164
-
[23]
Holberg, J. B., Oswalt, T. D., & Sion, E. M. 2002, ApJ, 571, 512, doi: 10.1086/339842
-
[24]
Holberg, J. B., Oswalt, T. D., Sion, E. M., & McCook, G. P. 2016, MNRAS, 462, 2295, doi: 10.1093/mnras/stw1357
-
[25]
Iglesias, C. A., & Rogers, F. J. 1996, ApJ, 464, 943, doi: 10.1086/177381 Jofr´ e, P., Heiter, U., Soubiran, C., et al. 2014, A&A, 564, A133, doi: 10.1051/0004-6361/201322440
-
[26]
Johnson, H. L., & Morgan, W. W. 1953, ApJ, 117, 313, doi: 10.1086/145697
- [27]
-
[28]
2004, A&A, 413, 251, doi: 10.1051/0004-6361:20031527
Kervella, P., Th´ evenin, F., Morel, P., et al. 2004, A&A, 413, 251, doi: 10.1051/0004-6361:20031527
-
[29]
Khan, M. Y., & Castanheira, B. G. 2024, ApJ, 977, 41, doi: 10.3847/1538-4357/ad8dd6
-
[30]
2013, ApJ, 769, 7, doi: 10.1088/0004-637X/769/1/7
Arnett, D. 2013, ApJ, 769, 7, doi: 10.1088/0004-637X/769/1/7
-
[31]
S., Zhang, X., Bi, S., & Li, T
Liu, Z., Jeffery, C. S., Zhang, X., Bi, S., & Li, T. 2025, ApJ, 995, 114, doi: 10.3847/1538-4357/ae182d
-
[32]
2022, Universe, 8, 243, doi: 10.3390/universe8040243
Marigo, P. 2022, Universe, 8, 243, doi: 10.3390/universe8040243
-
[33]
Marigo, P., Cummings, J. D., Curtis, J. L., et al. 2020, Nature Astronomy, 4, 1102, doi: 10.1038/s41550-020-1132-1 Miller Bertolami, M. M., Althaus, L. G., Serenelli, A. M., &
-
[34]
Panei, J. A. 2006, A&A, 449, 313, doi: 10.1051/0004-6361:20053804 Montalb´ an, J., Miglio, A., Noels, A., et al. 2013, The Astrophysical Journal, 766, 118, doi: 10.1088/0004-637X/766/2/118
-
[35]
2011, ApJS, 192, 3, doi: 10.1088/0067-0049/192/1/3
Paxton, B., Bildsten, L., Dotter, A., et al. 2011, ApJS, 192, 3, doi: 10.1088/0067-0049/192/1/3
-
[36]
2013, ApJS, 208, 4, doi: 10.1088/0067-0049/208/1/4 10
Paxton, B., Cantiello, M., Arras, P., et al. 2013, ApJS, 208, 4, doi: 10.1088/0067-0049/208/1/4 Modeling Procyon13
work page internal anchor Pith review doi:10.1088/0067-0049/208/1/4 2013
-
[37]
2015, ApJS, 220, 15, doi: 10.1088/0067-0049/220/1/15
Paxton, B., Marchant, P., Schwab, J., et al. 2015, ApJS, 220, 15, doi: 10.1088/0067-0049/220/1/15
work page internal anchor Pith review doi:10.1088/0067-0049/220/1/15 2015
-
[38]
Paxton, B., Schwab, J., Bauer, E. B., et al. 2018, ApJS, 234, 34, doi: 10.3847/1538-4365/aaa5a8
-
[39]
2019, ApJS, 243, 10, doi: 10.3847/1538-4365/ab2241
Paxton, B., Smolec, R., Schwab, J., et al. 2019, ApJS, 243, 10, doi: 10.3847/1538-4365/ab2241
-
[40]
Provencal, J. L., Shipman, H. L., Koester, D., Wesemael, F., & Bergeron, P. 2002, ApJ, 568, 324, doi: 10.1086/338769
-
[41]
Provencal, J. L., Shipman, H. L., Wesemael, F., et al. 1997, ApJ, 480, 777, doi: 10.1086/304003
-
[42]
1975, Memoires of the Societe Royale des Sciences de Liege, 8, 369
Reimers, D. 1975, Memoires of the Societe Royale des Sciences de Liege, 8, 369
work page 1975
-
[43]
Schaeberle, J. M. 1896, PASP, 8, 314, doi: 10.1086/121125
-
[44]
Tremblay, P. E., Ludwig, H. G., Steffen, M., & Freytag, B. 2013, A&A, 559, A104, doi: 10.1051/0004-6361/201322318 van Leeuwen, F. 2007, A&A, 474, 653, doi: 10.1051/0004-6361:20078357
-
[45]
Walker, G. A., Walker, A. R., Racine, R., Fletcher, M. J., & McClure, R. D. 1994, PASP, 106, 356, doi: 10.1086/133385
-
[46]
Zhang, E.-H., Robinson, E. L., & Nather, R. E. 1986, ApJ, 305, 740, doi: 10.1086/164288
discussion (0)
Sign in with ORCID, Apple, or X to comment. Anyone can read and Pith papers without signing in.