Recognition: no theorem link
Architecture-Aware Explanation Auditing for Industrial Visual Inspection
Pith reviewed 2026-05-15 02:38 UTC · model grok-4.3
The pith
The faithfulness of heatmap explanations is bounded by structural distance to the model's native decision mechanism.
A machine-rendered reading of the paper's core claim, the machinery that carries it, and where it could break.
Core claim
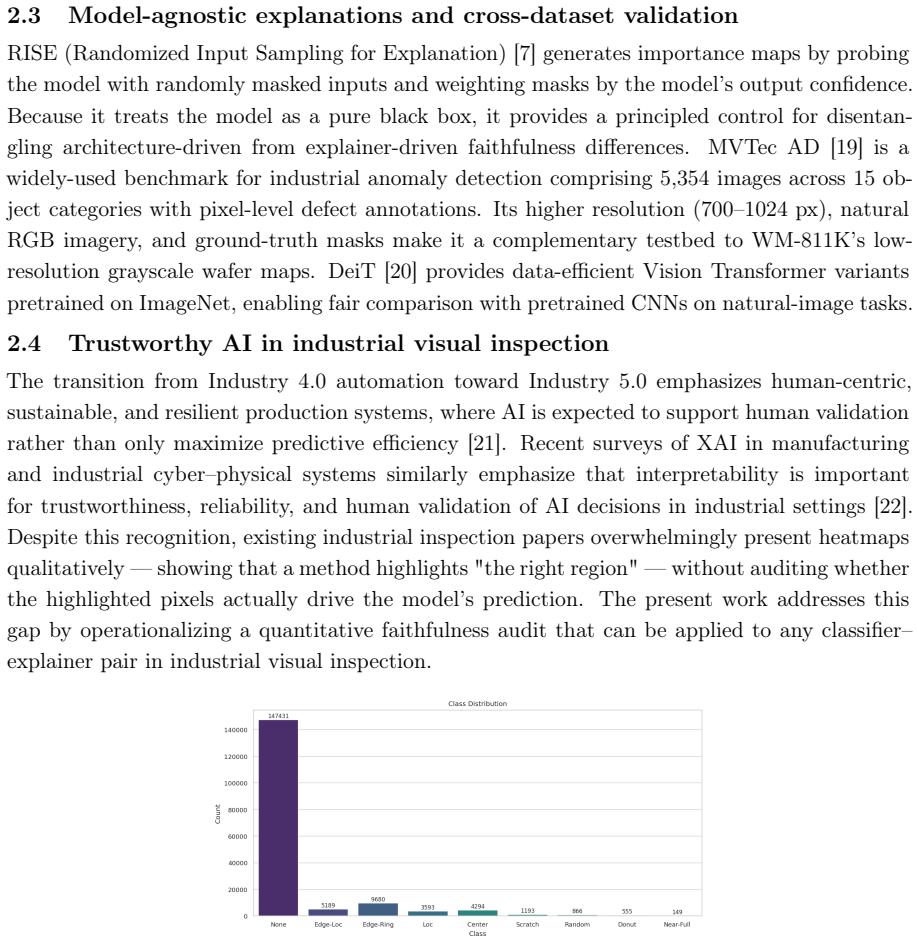
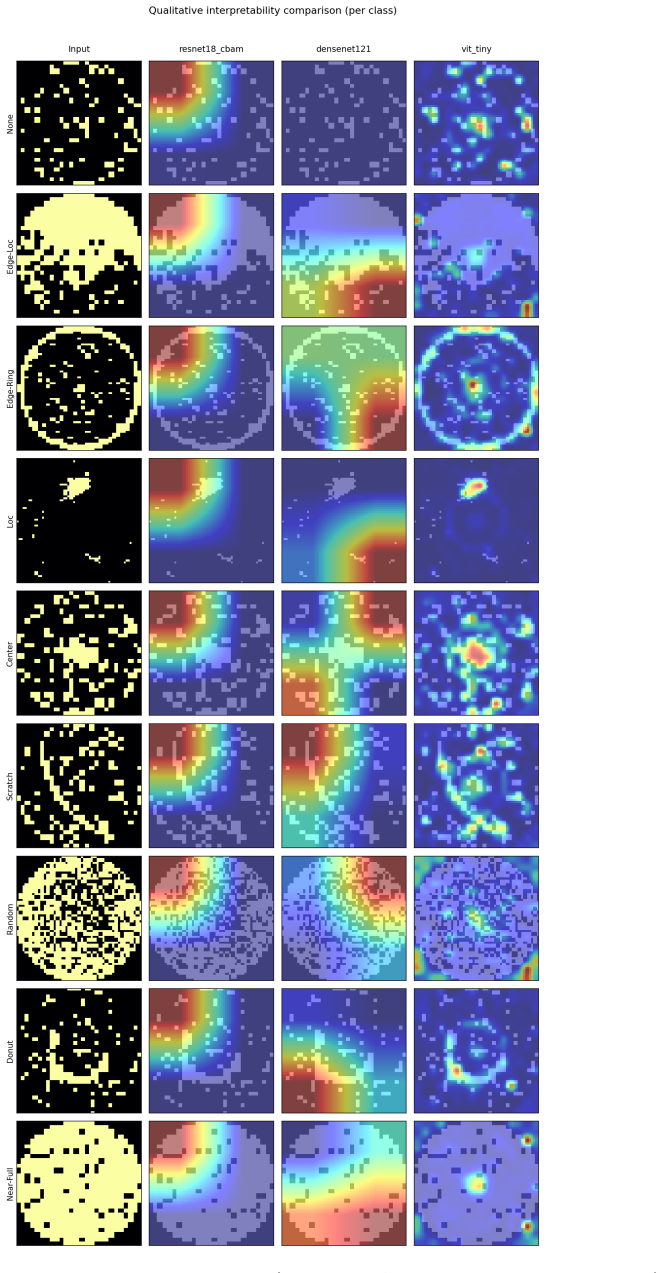
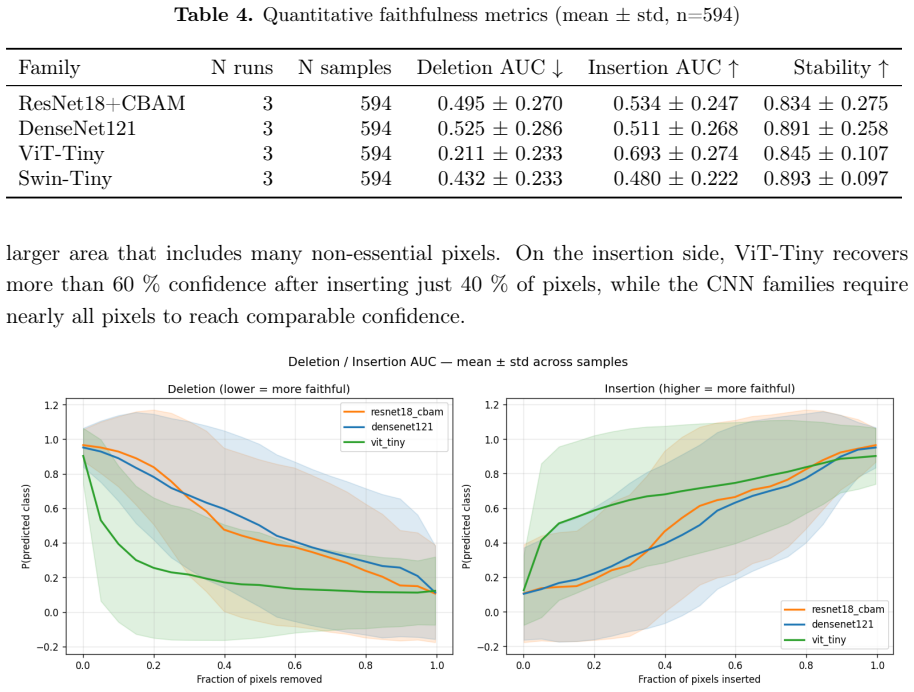
The native-readout hypothesis holds that perturbation-based faithfulness of an explanation is bounded by its structural distance from the model's native decision mechanism. On WM-811K wafer maps under zero-fill perturbation, ViT-Tiny plus Attention Rollout reached Deletion AUC 0.211 while Swin-Tiny, ResNet18+CBAM, and DenseNet121+Grad-CAM ranged from 0.432 to 0.525. Swin-Tiny's spatial feature-map hierarchy made it compatible with Grad-CAM despite its transformer architecture, isolating readout structure as the operative factor. A model-agnostic RISE baseline compressed all families to roughly 0.1 AUC, and blur-fill perturbation reversed the ordering, confirming that rankings are joint over,
What carries the argument
the native-readout hypothesis, which treats faithfulness as limited by structural alignment between explainer and model's internal decision pathway
If this is right
- Explanation methods must be chosen according to readout compatibility with the target model rather than architecture family alone.
- Deployed heatmaps should be reported with quantitative faithfulness scores instead of visual plausibility alone.
- Model and explainer design should be co-ordinated around readout structure to maintain audit reliability.
- Multiple perturbation baselines are required because single-protocol rankings are not stable.
Where Pith is reading between the lines
- Industrial pipelines could reduce inspection errors by requiring readout-matched explainers during model selection.
- The same audit protocol might expose similar compatibility issues in medical or autonomous-driving image models.
- When native compatibility is low, model-agnostic methods may become the default choice rather than an exception.
- Dataset shifts could change which readout structures count as native, requiring periodic re-audits.
Load-bearing premise
The chosen zero-fill and blur-fill perturbation protocols measure faithfulness without introducing systematic artifacts that favor particular readout structures.
What would settle it
A finding that a structurally distant explainer consistently achieves lower deletion AUC than a native one across both zero-fill and blur-fill protocols on the same dataset would falsify the bound.
Figures


read the original abstract
Industrial visual inspection systems increasingly rely on deep classifiers whose heatmap explanations may appear visually plausible while failing to identify the image regions that actually drive model decisions. This paper operationalizes an architecture-aware explanation audit protocol grounded in the native-readout hypothesis: the perturbation-based faithfulness of an explanation method is bounded by its structural distance from the model's native decision mechanism. On WM-811K wafer maps (9 classes, 172k images) under a three-seed zero-fill perturbation protocol, ViT-Tiny + Attention Rollout attains Deletion AUC 0.211 against 0.432-0.525 for Swin-Tiny / ResNet18+CBAM / DenseNet121 + Grad-CAM (abs(Cohen's d) > 1.1), despite lower classification accuracy. Swin-Tiny disentangles architecture family from readout structure: despite being a Transformer, its spatial feature-map hierarchy makes it Grad-CAM compatible, showing that the operative factor is readout structure rather than architecture family. A model-agnostic control (RISE) compresses all families to Deletion AUC about 0.1, indicating the gap arises from the explainer pathway; notably, RISE outperforms all native methods, so native readout is a compatibility principle rather than an optimality guarantee. A blur-fill sensitivity analysis shows that the family ordering reverses under a different perturbation baseline, reinforcing that faithfulness rankings are joint properties of (model, explainer, perturbation operator) triples. An exploratory boundary-condition study on MVTec AD (pretrained models) indicates that audit results are dataset/task dependent and identifies conditions requiring qualification. The protocol yields actionable guidance: explanation pathways should be co-designed with model architectures based on readout structure, and deployed heatmaps should be accompanied by quantitative faithfulness metrics.
Editorial analysis
A structured set of objections, weighed in public.
Referee Report
Summary. The paper operationalizes an architecture-aware explanation audit protocol based on the native-readout hypothesis: perturbation-based faithfulness of an explanation is bounded by its structural distance from the model's native decision mechanism. Large-scale experiments on the WM-811K wafer-map dataset (172k images, 9 classes) across ViT-Tiny, Swin-Tiny, ResNet18+CBAM and DenseNet121 compare native readouts (Attention Rollout, Grad-CAM) against a model-agnostic control (RISE) under zero-fill Deletion AUC, with a blur-fill sensitivity analysis and an exploratory MVTec AD study.
Significance. If the central empirical correlations hold, the work supplies concrete, actionable guidance for co-designing explanation pathways with model architectures in industrial visual inspection and demonstrates that native readout is a compatibility principle rather than an optimality guarantee. The scale of the WM-811K experiments, inclusion of architecture-family controls (Swin-Tiny), RISE baseline, and perturbation-operator sensitivity analysis are genuine strengths that make the protocol reproducible and falsifiable.
major comments (3)
- [Abstract / Results section] The central claim that faithfulness is bounded by structural distance to the native readout rests on the assumption that zero-fill (and blur-fill) perturbation protocols are neutral with respect to readout structure. The reported reversal of model ordering under blur-fill directly challenges this neutrality, yet no quantitative test of the model-explanation-perturbation interaction (e.g., two-way ANOVA or permutation test on the three-seed Deletion AUC values) is supplied to isolate readout compatibility from operator artifact.
- [Introduction / Methods] No formal definition, metric, or bound is given for 'structural distance' from the native decision mechanism. The claim therefore reduces to an observed correlation (ViT-Tiny + Attention Rollout Deletion AUC 0.211 vs. 0.432-0.525 for mismatched readouts, |Cohen's d| > 1.1) without an independent, testable quantity that could be computed from architecture alone.
- [Experiments / Results] While RISE is shown to compress all families to Deletion AUC ~0.1 and outperform native methods, the paper does not report whether this superiority is statistically significant after correction for multiple comparisons across the four model families and two perturbation operators, which is load-bearing for the conclusion that native readout is merely compatibility rather than optimality.
minor comments (2)
- [Abstract] The abstract states 'abs(Cohen's d) > 1.1' for the main comparison but does not specify whether the effect size is computed on per-image or per-seed aggregated AUC values; clarify the exact aggregation level.
- [Discussion] The exploratory MVTec AD boundary-condition study is described only at high level; adding a short table summarizing the conditions under which audit results change would improve clarity.
Simulated Author's Rebuttal
We thank the referee for the constructive feedback, which has prompted us to enhance the statistical analysis and clarify key concepts in the manuscript. We address each major comment point by point below.
read point-by-point responses
-
Referee: [Abstract / Results section] The central claim that faithfulness is bounded by structural distance to the native readout rests on the assumption that zero-fill (and blur-fill) perturbation protocols are neutral with respect to readout structure. The reported reversal of model ordering under blur-fill directly challenges this neutrality, yet no quantitative test of the model-explanation-perturbation interaction (e.g., two-way ANOVA or permutation test on the three-seed Deletion AUC values) is supplied to isolate readout compatibility from operator artifact.
Authors: We agree that the reversal under blur-fill demonstrates an interaction between model, explainer, and perturbation operator. In the revised manuscript, we have added a two-way ANOVA on the three-seed Deletion AUC values with model family and perturbation operator as factors. The analysis yields a significant interaction term (p < 0.01), confirming that faithfulness rankings are joint properties of the triple rather than isolated effects. This is reported in the Results section alongside the existing blur-fill sensitivity analysis. revision: yes
-
Referee: [Introduction / Methods] No formal definition, metric, or bound is given for 'structural distance' from the native decision mechanism. The claim therefore reduces to an observed correlation (ViT-Tiny + Attention Rollout Deletion AUC 0.211 vs. 0.432-0.525 for mismatched readouts, |Cohen's d| > 1.1) without an independent, testable quantity that could be computed from architecture alone.
Authors: We acknowledge that structural distance was previously described qualitatively. The revised Methods section now provides an operational definition: structural distance is the degree of mismatch between the explainer's native readout structure (e.g., attention maps for ViT vs. spatial feature maps for CNNs) and the model's decision mechanism, which can be assessed from architecture specifications alone. While a closed-form theoretical bound is beyond the current scope, this definition enables testable predictions, as validated by the Swin-Tiny control experiment. The Introduction has been updated to reference this definition explicitly. revision: partial
-
Referee: [Experiments / Results] While RISE is shown to compress all families to Deletion AUC ~0.1 and outperform native methods, the paper does not report whether this superiority is statistically significant after correction for multiple comparisons across the four model families and two perturbation operators, which is load-bearing for the conclusion that native readout is merely compatibility rather than optimality.
Authors: We have added the requested statistical analysis. Paired t-tests on per-seed AUC values with Bonferroni correction for the eight comparisons (4 models × 2 operators) confirm that RISE's superiority remains significant (adjusted p < 0.01 in all cases). These results are now included in the Experiments section and support the interpretation that native readout is a compatibility principle rather than an optimality guarantee. revision: yes
Circularity Check
No circularity: empirical comparisons without self-referential derivations
full rationale
The paper conducts direct experimental comparisons of Deletion AUC under zero-fill and blur-fill protocols across model-explanation pairs on WM-811K and MVTec AD. No equations, predictions, or bounds are derived that reduce by construction to fitted parameters, self-citations, or ansatzes within the paper itself. The native-readout hypothesis is tested via observable performance gaps and sensitivity analyses rather than proven from internal definitions, rendering the work self-contained against external benchmarks.
Axiom & Free-Parameter Ledger
axioms (1)
- domain assumption native-readout hypothesis: perturbation-based faithfulness of an explanation method is bounded by its structural distance from the model's native decision mechanism
Reference graph
Works this paper leans on
-
[1]
He, K., Zhang, X., Ren, S., & Sun, J.Deep Residual Learning for Image Recognition. CVPR, 2016.https://www.cv-foundation.org/openaccess/content_cvpr_2016/pap ers/He_Deep_Residual_Learning_CVPR_2016_paper.pdf
work page 2016
-
[2]
CBAM: Convolutional Block Attention Module
Woo, S., Park, J., Lee, J.-Y., & Kweon, I. S.CBAM: Convolutional Block Attention Module. ECCV, 2018.https://arxiv.org/abs/1807.06521
work page internal anchor Pith review Pith/arXiv arXiv 2018
-
[3]
Q.Densely Connected Convo- lutional Networks
Huang, G., Liu, Z., van der Maaten, L., & Weinberger, K. Q.Densely Connected Convo- lutional Networks. CVPR, 2017.https://openaccess.thecvf.com/content_cvpr_201 7/papers/Huang_Densely_Connected_Convolutional_CVPR_2017_paper.pdf
work page 2017
-
[4]
et al.An Image Is Worth 16×16 Words: Transformers for Image Recogni- tion at Scale
Dosovitskiy, A. et al.An Image Is Worth 16×16 Words: Transformers for Image Recogni- tion at Scale. ICLR, 2021.https://dblp.org/rec/conf/iclr/DosovitskiyB0WZ21 33
work page 2021
-
[5]
Selvaraju, R. R. et al.Grad-CAM: Visual Explanations from Deep Networks via Gradient- Based Localization. ICCV, 2017.https://openaccess.thecvf.com/content_ICCV_201 7/papers/Selvaraju_Grad-CAM_Visual_Explanations_ICCV_2017_paper.pdf
work page 2017
-
[6]
ACL, 2020.ht tps://arxiv.org/abs/2005.00928
Abnar, S., & Zuidema, W.Quantifying Attention Flow in Transformers. ACL, 2020.ht tps://arxiv.org/abs/2005.00928
-
[7]
RISE: Randomized Input Sampling for Explanation of Black-box Models
Petsiuk, V., Das, A., & Saenko, K.RISE: Randomized Input Sampling for Explanation of Black-Box Models. BMVC, 2018.https://arxiv.org/abs/1806.07421
work page internal anchor Pith review Pith/arXiv arXiv 2018
-
[8]
On the Robustness of Interpretability Methods
Alvarez-Melis, D., & Jaakkola, T. S.On the Robustness of Interpretability Methods. ICML Workshop, 2018.https://arxiv.org/abs/1806.08049
work page internal anchor Pith review Pith/arXiv arXiv 2018
-
[9]
Jain, S., & Wallace, B. C.Attention Is Not Explanation. NAACL, 2019.https://doi.or g/10.48550/arXiv.1902.10186
work page internal anchor Pith review Pith/arXiv arXiv doi:10.48550/arxiv.1902.10186 2019
-
[10]
CVPR, 2021.https://www.computer.org/csdl/proceedings-article/cvpr/20 21/450900a782/1yeIsbbCMO4
Chefer, H., Gur, S., & Wolf, L.Transformer Interpretability Beyond Attention Visualiza- tion. CVPR, 2021.https://www.computer.org/csdl/proceedings-article/cvpr/20 21/450900a782/1yeIsbbCMO4
work page 2021
-
[11]
Axiomatic Attribution for Deep Networks
Sundararajan, M., Taly, A., & Yan, Q.Axiomatic Attribution for Deep Networks(Inte- grated Gradients). ICML, 2017.https://arxiv.org/abs/1703.01365
work page internal anchor Pith review Pith/arXiv arXiv 2017
-
[12]
D., & Fergus, R.Visualizing and Understanding Convolutional Networks(Oc- clusion sensitivity)
Zeiler, M. D., & Fergus, R.Visualizing and Understanding Convolutional Networks(Oc- clusion sensitivity). ECCV, 2014.https://cs.nyu.edu/~fergus/papers/zeilerECCV2 014.pdf Recent wafer-map defect classification and XAI (2024–2026)
work page 2014
-
[13]
Khatun, M. R., Farid, F. A., Dhar, S., Islam, M. S., Uddin, J., & Abdul Karim, H.CBAM- Enhanced Lightweight CNN for Wafer Map Defect Classification. Frontiers in Electronics, 7:1750707, 2026.https://www.frontiersin.org/journals/electronics/articles/10 .3389/felec.2026.1750707/full
-
[14]
Micromachines, 16(9):1057, 2025.https://www.mdpi.com/2072-666X/16/9 /1057
Lee, J., Ju, Y., Lim, J., Hong, S., Baek, S.-W., & Lee, J.Enhancing Confidence and Inter- pretability of a CNN-Based Wafer Defect Classification Model Using Temperature Scaling and LIME. Micromachines, 16(9):1057, 2025.https://www.mdpi.com/2072-666X/16/9 /1057
work page 2025
-
[15]
IEEE Access, 13, 2025.ht tps://ieeexplore.ieee.org/iel8/6287639/10820123/11145756.pdf
Lee, C.-Y., Pleva, M., Hládek, D., Lee, C.-W., & Su, M.-H.Ensemble Learning for Wafer Defect Pattern Classification in the Semiconductor Industry. IEEE Access, 13, 2025.ht tps://ieeexplore.ieee.org/iel8/6287639/10820123/11145756.pdf
work page 2025
-
[16]
Park, S. Y., & Kim, T. S.Fuzzy Inference System for Interpretable Classification of Wafer Map Defect Patterns. Electronics, 15(1):130, 2026.https://www.mdpi.com/2079-9292/ 15/1/130
work page 2026
-
[17]
Pilli, V. S. R. R.Intelligent Model to Detect and Classify Silicon Wafer Map Images. M.Sc. Thesis, Purdue University, 2024.https://hammer.purdue.edu/ndownloader/files/49 412641 34 Benchmark dataset
work page 2024
-
[18]
Wu, M.-J., Jang, J.-S. R., & Chen, J.-L.Wafer Map Failure Pattern Recognition and Similarity Ranking for Large-Scale Data Sets. IEEE Transactions on Semiconductor Man- ufacturing, 28(1):1–12, 2015.https://ui.adsabs.harvard.edu/abs/2015ITSM...28S42 37W/abstract Boundary-condition dataset and pretrained models
work page 2015
-
[19]
Bergmann, P., Fauser, M., Sattlegger, D., & Steger, C.MVTec AD — A Comprehensive Real-World Dataset for Unsupervised Anomaly Detection. CVPR, 2019.https://openac cess.thecvf.com/content_CVPR_2019/papers/Bergmann_MVTec_AD_--_A_Comprehens ive_Real-World_Dataset_for_Unsupervised_Anomaly_CVPR_2019_paper.pdf
work page 2019
-
[20]
Touvron, H., Cord, M., Douze, M., Massa, F., Sablayrolles, A., & Jégou, H.Training Data-Efficient Image Transformers & Distillation Through Attention(DeiT). ICML, 2021. https://arxiv.org/abs/2012.12877 Trustworthy industrial AI
-
[21]
Breque, M., De Nul, L., & Petridis, A.Industry 5.0: Towards a Sustainable, Human- Centric and Resilient European Industry. European Commission, Directorate-General for Research and Innovation, 2021.https://op.europa.eu/publication/manifestation_i dentifier/PUB_KIBD20021ENN
work page 2021
-
[22]
Moosavi, S., Farajzadeh-Zanjani, M., Razavi-Far, R., Palade, V., & Saif, M.Explain- able AI in Manufacturing and Industrial Cyber–Physical Systems: A Survey. Electronics, 13(17):3497, 2024.https://www.mdpi.com/2079-9292/13/17/3497 Hierarchical vision transformers
work page 2024
-
[23]
ICCV, 2021.https://arxiv.or g/abs/2103.14030 35 Supplementary Material S1
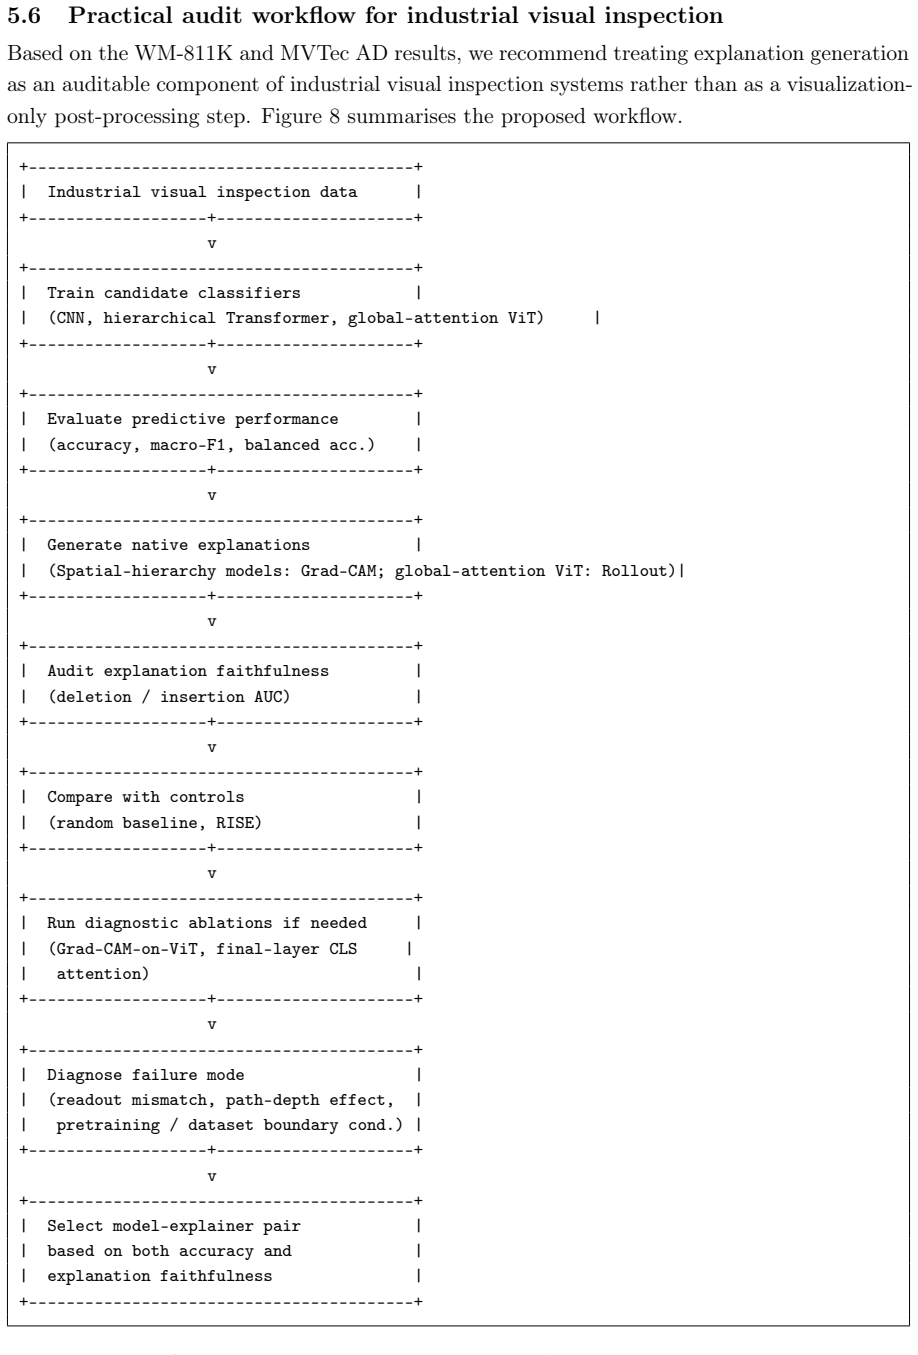
Liu, Z., Lin, Y., Cao, Y., Hu, H., Wei, Y., Zhang, Z., Lin, S., & Guo, B.Swin Transformer: Hierarchical Vision Transformer using Shifted Windows. ICCV, 2021.https://arxiv.or g/abs/2103.14030 35 Supplementary Material S1. Experimental workflow The full pipeline proceeds in four stages, from raw data ingestion through to the final re- port. Each stage is au...
discussion (0)
Sign in with ORCID, Apple, or X to comment. Anyone can read and Pith papers without signing in.