Recognition: no theorem link
DVMap: Fine-Grained Pluralistic Value Alignment via High-Consensus Demographic-Value Mapping
Pith reviewed 2026-05-15 02:00 UTC · model grok-4.3
The pith
Mapping multi-dimensional demographics to values lets LLMs align with pluralistic preferences more tightly than national labels allow.
A machine-rendered reading of the paper's core claim, the machinery that carries it, and where it could break.
Core claim
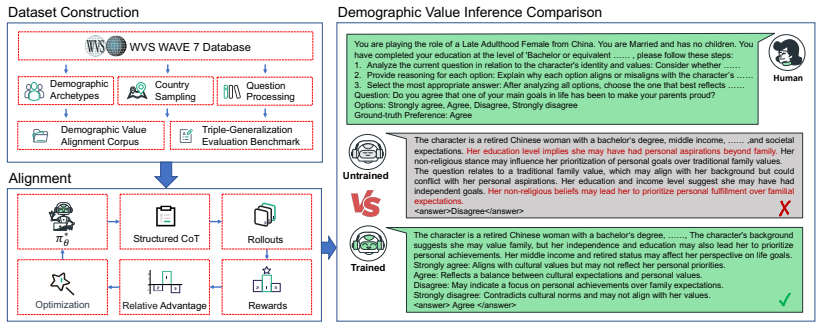
DVMap builds a 56,152-sample corpus by retaining only World Values Survey respondents who give consistent answers under identical demographics, then applies Structured Chain-of-Thought reasoning to expose demographic-value links and Group Relative Policy Optimization to anchor value distributions adaptively. On a held-out triple-generalization benchmark of 21,553 samples the resulting Qwen3-8B model reaches 48.6 percent accuracy on cross-demographic cases, exceeding DeepSeek-v3.2 at 45.1 percent.
What carries the argument
High-consensus demographic archetype extraction that filters for consistent value preferences under matching demographics, followed by Structured Chain-of-Thought guidance and Group Relative Policy Optimization to learn the mapping.
If this is right
- LLMs can be aligned to specific demographic groups rather than country averages.
- Value predictions remain reliable when tested on entirely new combinations of demographics, countries, and value dimensions.
- Adaptive anchoring of value distributions improves match quality over standard fine-tuning.
- High-consensus filtering yields a cleaner training signal than using every survey response.
Where Pith is reading between the lines
- The same filtering and mapping steps could be reused for other preference types such as political or ethical views.
- If the learned mappings transfer to live user interactions, models could adjust outputs on the fly from user-supplied demographics.
- Extending the triple benchmark to dynamic or self-reported demographics would test whether the correlations survive real usage.
- The method might surface which demographic factors drive the largest shifts in particular values.
Load-bearing premise
Respondents who show consistent values under the same demographics will keep those same preferences when the demographics change to new but similar combinations, without the filtering step introducing systematic bias.
What would settle it
A fresh survey sample from any country or demographic slice where the model’s predicted value preferences match actual respondent answers at rates no better than a national-label baseline or random choice.
Figures


read the original abstract
Current Large Language Models (LLMs) typically rely on coarse-grained national labels for pluralistic value alignment. However, such macro-level supervision often obscures intra-country value heterogeneity, yielding a loose alignment. We argue that resolving this limitation requires shifting from national labels to multi-dimensional demographic constraints, which can identify groups with predictable, high-consensus value preference. To this end, we propose DVMap (High-Consensus Demographic-Value Mapping), a framework for fine-grained pluralistic value alignment. In this framework, we first present a demographic archetype extraction strategy to construct a high-quality value alignment corpus of 56,152 samples from the World Values Survey (WVS) by strictly retaining respondents with consistent value preferences under identical demographics. Over this corpus, we introduce a Structured Chain-of-Thought (CoT) mechanism that explicitly guides LLMs to reason about demographic-value correlations. Subsequently, we employ Group Relative Policy Optimization (GRPO) to achieve adaptive anchoring of value distributions. To rigorously evaluate generalization, we further establish a triple-generalization benchmark (spanning cross-demographic, cross-country, and cross-value) comprising 21,553 samples. Experimental results demonstrate that DVMap effectively learns the manifold mapping from demographics to values, exhibiting strong generalization and robustness. On cross-demographic tests, Qwen3-8B-DVMap achieves 48.6% accuracy, surpassing the advanced open-source LLM DeepSeek-v3.2 (45.1%). The source code and dataset are available at https://github.com/EnlightenedAI/DVMap.
Editorial analysis
A structured set of objections, weighed in public.
Referee Report
Summary. The paper proposes DVMap, a framework for fine-grained pluralistic value alignment in LLMs. It extracts demographic archetypes from the World Values Survey to build a 56,152-sample corpus by retaining only respondents with consistent value preferences under identical demographics. Structured Chain-of-Thought reasoning and Group Relative Policy Optimization (GRPO) are then used to train models that map demographics to values. Generalization is tested on a 21,553-sample triple-generalization benchmark (cross-demographic, cross-country, cross-value), with Qwen3-8B-DVMap reporting 48.6% accuracy on cross-demographic tests, outperforming DeepSeek-v3.2 at 45.1%.
Significance. If the central claims hold after addressing data-construction concerns, the work would meaningfully advance pluralistic alignment by moving beyond coarse national labels to multi-dimensional demographic constraints. The public release of code and dataset supports reproducibility and enables follow-up work on demographic-value manifolds.
major comments (3)
- [Abstract / corpus construction] Abstract and data-construction section: The filtering step that retains only respondents with 'consistent value preferences under identical demographics' to form the 56,152-sample corpus lacks validation that the retained subset preserves the value distribution of the full WVS population. No entropy comparison, demographic coverage statistics, or bias analysis is provided, raising the risk that the Structured CoT + GRPO training optimizes for an artificially low-variance distribution; this directly affects whether the reported 48.6% accuracy reflects genuine manifold learning or in-sample fitting.
- [Evaluation / triple-generalization benchmark] Evaluation section: The 21,553-sample triple-generalization benchmark is described as spanning cross-demographic, cross-country, and cross-value tests, but it is unclear whether the same consistency filter was applied to construct it. If the benchmark shares the filtering criterion, it cannot serve as a rigorous test of generalization to arbitrary unseen demographic combinations, weakening the claim that DVMap exhibits 'strong generalization and robustness.'
- [Experimental results] Results paragraph: The 3.5-point accuracy margin (48.6% vs. 45.1%) is reported without error bars, ablation studies on the filtering threshold, or controls for distribution shift induced by the 56k-sample selection. This makes it impossible to assess whether the gain is statistically reliable or attributable to the proposed GRPO anchoring rather than corpus properties.
minor comments (2)
- [Abstract] The abstract introduces 'Qwen3-8B-DVMap' without specifying the base model variant, training hyperparameters, or how GRPO is implemented relative to standard PPO.
- [Method] Notation for demographic dimensions and value dimensions is introduced without an explicit table or figure summarizing the exact feature set used in the archetype extraction.
Simulated Author's Rebuttal
We thank the referee for the constructive comments, which help improve the clarity and rigor of our work on DVMap. We provide point-by-point responses below and commit to revisions where appropriate.
read point-by-point responses
-
Referee: [Abstract / corpus construction] The filtering step that retains only respondents with 'consistent value preferences under identical demographics' to form the 56,152-sample corpus lacks validation that the retained subset preserves the value distribution of the full WVS population. No entropy comparison, demographic coverage statistics, or bias analysis is provided.
Authors: We appreciate this observation. The filtering criterion is designed to identify high-consensus demographic groups for reliable value mapping, as low-consensus respondents introduce noise that hinders learning the demographic-value manifold. To address the concern, we will add in the revised manuscript: (1) entropy comparisons of value distributions before and after filtering, (2) demographic coverage statistics showing preserved diversity, and (3) a bias analysis confirming no systematic skew. These will demonstrate that the 48.6% accuracy reflects genuine learning rather than in-sample fitting to low-variance data. revision: yes
-
Referee: [Evaluation / triple-generalization benchmark] The 21,553-sample triple-generalization benchmark is described as spanning cross-demographic, cross-country, and cross-value tests, but it is unclear whether the same consistency filter was applied to construct it. If the benchmark shares the filtering criterion, it cannot serve as a rigorous test of generalization to arbitrary unseen demographic combinations.
Authors: We clarify that the benchmark is built from a separate held-out set of WVS respondents without applying the consistency filter, allowing evaluation on diverse, real-world demographic combinations that may exhibit lower consensus. This design directly tests generalization to unseen demographics. We will update the evaluation section with a detailed description of the benchmark construction, explicitly stating that the consistency filter was not applied, to substantiate the claims of strong generalization and robustness. revision: yes
-
Referee: [Experimental results] The 3.5-point accuracy margin (48.6% vs. 45.1%) is reported without error bars, ablation studies on the filtering threshold, or controls for distribution shift induced by the 56k-sample selection. This makes it impossible to assess whether the gain is statistically reliable or attributable to the proposed GRPO anchoring rather than corpus properties.
Authors: We acknowledge the need for more rigorous statistical reporting. In the revision, we will include error bars computed over multiple training seeds, perform ablations on different consistency thresholds to show sensitivity, and add controls comparing DVMap performance on the filtered corpus versus a non-filtered baseline to isolate the effect of GRPO. These changes will allow better assessment of the margin's reliability. revision: yes
Circularity Check
No significant circularity: training and evaluation remain independent of input construction
full rationale
The paper's chain proceeds from WVS data filtering (retaining consistent respondents under identical demographics to build the 56,152-sample corpus), through Structured CoT reasoning and GRPO optimization for value distribution anchoring, to accuracy measurement on a separately established 21,553-sample triple-generalization benchmark. No quoted equations, definitions, or steps reduce the reported cross-demographic accuracy (e.g., 48.6%) to the filtered corpus by construction. The filtering defines the training distribution but does not tautologically determine held-out performance; the benchmark is presented as an external check spanning cross-demographic, cross-country, and cross-value axes. No self-citations, uniqueness theorems, or ansatzes are invoked as load-bearing premises. This is standard empirical ML pipeline behavior with no reduction of outputs to inputs.
Axiom & Free-Parameter Ledger
axioms (1)
- domain assumption High-consensus value preferences can be identified by retaining only respondents with consistent answers under identical demographic profiles
Reference graph
Works this paper leans on
-
[1]
Association for Computational Linguistics
Whose emotions and moral sentiments do lan- guage models reflect? InFindings of the Association for Computational Linguistics, ACL 2024, Bangkok, Thailand and virtual meeting, August 11-16, 2024, Findings of ACL, pages 6611–6631. Association for Computational Linguistics. Dan Hendrycks, Collin Burns, Steven Basart, Andrew Critch, Jerry Li, Dawn Song, and ...
work page 2024
-
[2]
Aligning AI with shared human values. In9th International Conference on Learning Representa- tions, ICLR 2021, Virtual Event, Austria, May 3-7,
work page 2021
-
[3]
Ronald Inglehart and Christian Welzel
OpenReview.net. Ronald Inglehart and Christian Welzel. 2005. Modern- ization, cultural change, and democracy.The human development sequence. Rebecca L. Johnson, Giada Pistilli, Natalia Menédez- González, Leslye Denisse Dias Duran, Enrico Panai, Julija Kalpokiene, and Donald Jay Bertulfo. 2022. The ghost in the machine has an american accent: value conflic...
-
[4]
Large language models can replicate cross- cultural differences in personality.Journal of Re- search in Personality, 115:104584. OpenAI. 2024. Gpt-4o system card.CoRR, abs/2410.21276. Long Ouyang, Jeffrey Wu, Xu Jiang, Diogo Almeida, Carroll Wainwright, Pamela Mishkin, Chong Zhang, Sandhini Agarwal, Katarina Slama, Alex Ray, and 1 others. 2022. Training l...
work page internal anchor Pith review Pith/arXiv arXiv 2024
-
[5]
DeepSeekMath: Pushing the Limits of Mathematical Reasoning in Open Language Models
Direct preference optimization: Your language model is secretly a reward model.Advances in neural information processing systems, 36:53728–53741. Shibani Santurkar, Esin Durmus, Faisal Ladhak, Cinoo Lee, Percy Liang, and Tatsunori Hashimoto. 2023. Whose opinions do language models reflect? InIn- ternational Conference on Machine Learning, pages 29971–3000...
work page internal anchor Pith review Pith/arXiv arXiv 2023
-
[6]
Understanding the capabilities and limitations of large language models for cultural commonsense. InProceedings of the 2024 Conference of the North American Chapter of the Association for Computa- tional Linguistics: Human Language Technologies (Volume 1: Long Papers), NAACL 2024, Mexico City, Mexico, June 16-21, 2024, pages 5668–5680. Associ- ation for C...
-
[7]
Not all countries celebrate thanksgiving: On the cultural dominance in large language models. In Proceedings of the 62nd Annual Meeting of the As- sociation for Computational Linguistics (Volume 1: Long Papers), pages 6349–6384. Walter F Wiggins and Ali S Tejani. 2022. On the oppor- tunities and risks of foundation models for natural language processing i...
work page 2022
-
[8]
Self-pluralising culture alignment for large language models. InProceedings of the 2025 Con- ference of the Nations of the Americas Chapter of the Association for Computational Linguistics: Human Language Technologies (Volume 1: Long Papers), pages 6859–6877. An Yang, Baosong Yang, Beichen Zhang, Binyuan Hui, Bo Zheng, Bowen Yu, Chengyuan Li, Dayi- heng L...
work page internal anchor Pith review Pith/arXiv arXiv 2025
-
[9]
Independence: Selected features model stand-alone attributes. Given the structured na- ture of the original WVS questionnaire, ques- tions are carefully chosen to establish clear conceptual boundaries and avoid redundancy within grouped questions
-
[10]
Minimal Overlap: To mitigate collinearity and conceptual ambiguity, features are filtered to minimize semantic overlap, ensuring that each selected question addresses a distinct as- pect of human values
-
[11]
Social Generalizability: Priority is given to attributes that reflect generic concepts at a so- cietal level (e.g., discriminatory or divisive topics) rather than idiosyncratic personal pref- erences. This aligns the data with a high- level conceptual framework suitable for cross- cultural analysis. Table 7 details the original question IDs, the specific ...
work page 2005
-
[12]
Nearest Neighbor Distance (dmin): Defined asd min = min q∈Dtrain dist(qtest, q)
-
[13]
Average Semantic Distance (davg): Defined asd avg = 1 |Dtrain| P q∈Dtrain dist(qtest, q). Semantic embeddings were extracted using the Qwen3-8B model, employing Cosine Distance as the metric. Table 12 reports the detailed metrics and performance outcomes. As discussed in Section 5.5, the stronger corre- lation between davg and changes in generalization pe...
discussion (0)
Sign in with ORCID, Apple, or X to comment. Anyone can read and Pith papers without signing in.