Recognition: no theorem link
The DESIRED electron temperature relations in star-forming regions of the local Universe
Pith reviewed 2026-05-15 14:13 UTC · model grok-4.3
The pith
Relations using Te([N II]) show lower dispersions than other low-ionization diagnostics across 699 spectra of H II regions and star-forming galaxies.
A machine-rendered reading of the paper's core claim, the machinery that carries it, and where it could break.
Core claim
From the homogeneous reanalysis of 699 multi-diagnostic spectra, the authors derive Te-Te relations for the ionic species [N II], [O II], [O III], [S II], [S III] and [Ar III]. Relations involving Te([N II]) exhibit lower total and intrinsic dispersions, indicating that this diagnostic supplies a more reliable estimate of the low-ionization zone temperature even when only higher-ionization Te values are available. Overall slopes agree with photoionization model predictions, especially for the low-dispersion pairs, while relations involving Te([O II]) and Te([S II]) show larger scatter attributed to sensitivity to ne inhomogeneities and recombination contributions.
What carries the argument
The set of Te-Te relations obtained by orthogonal distance regression on the 699 spectra after consistent recomputation of ne and Te with updated atomic data.
If this is right
- Slopes of the Te relations agree with photoionization model predictions, particularly for pairs with low intrinsic dispersion such as those involving Te([N II]) and Te([S III]).
- Te([N II]) provides a more reliable proxy for the low-ionization zone temperature when only higher-ionization diagnostics are available.
- Relations involving Te([O II]) and Te([S II]) display larger dispersions due to sensitivity to density inhomogeneities and recombination effects.
- The derived relations supply an empirical basis for estimating Te in spectra where only a limited set of diagnostics is detected.
Where Pith is reading between the lines
- If the lower dispersion of Te([N II]) relations persists, temperature-based metallicity calibrations that rely on it could reduce scatter in abundance determinations for galaxies observed at moderate redshift.
- The same relations might be tested on integrated spectra of entire galaxies to check whether the local-H II-region patterns survive averaging over multiple regions.
- Extending the comparison to samples at higher redshift could reveal whether the relative reliability of Te([N II]) changes with cosmic epoch or metallicity range.
Load-bearing premise
The 699 spectra that possess multiple Te diagnostics form a representative sample of star-forming regions and the recomputed temperatures accurately reflect true values without introducing new systematic offsets.
What would settle it
Measure a fresh sample of spectra containing both Te([N II]) and Te([O III]) and test whether the dispersion around the Te([N II])–Te([O III]) relation remains smaller than the dispersion around the Te([O II])–Te([O III]) relation.
Figures


read the original abstract
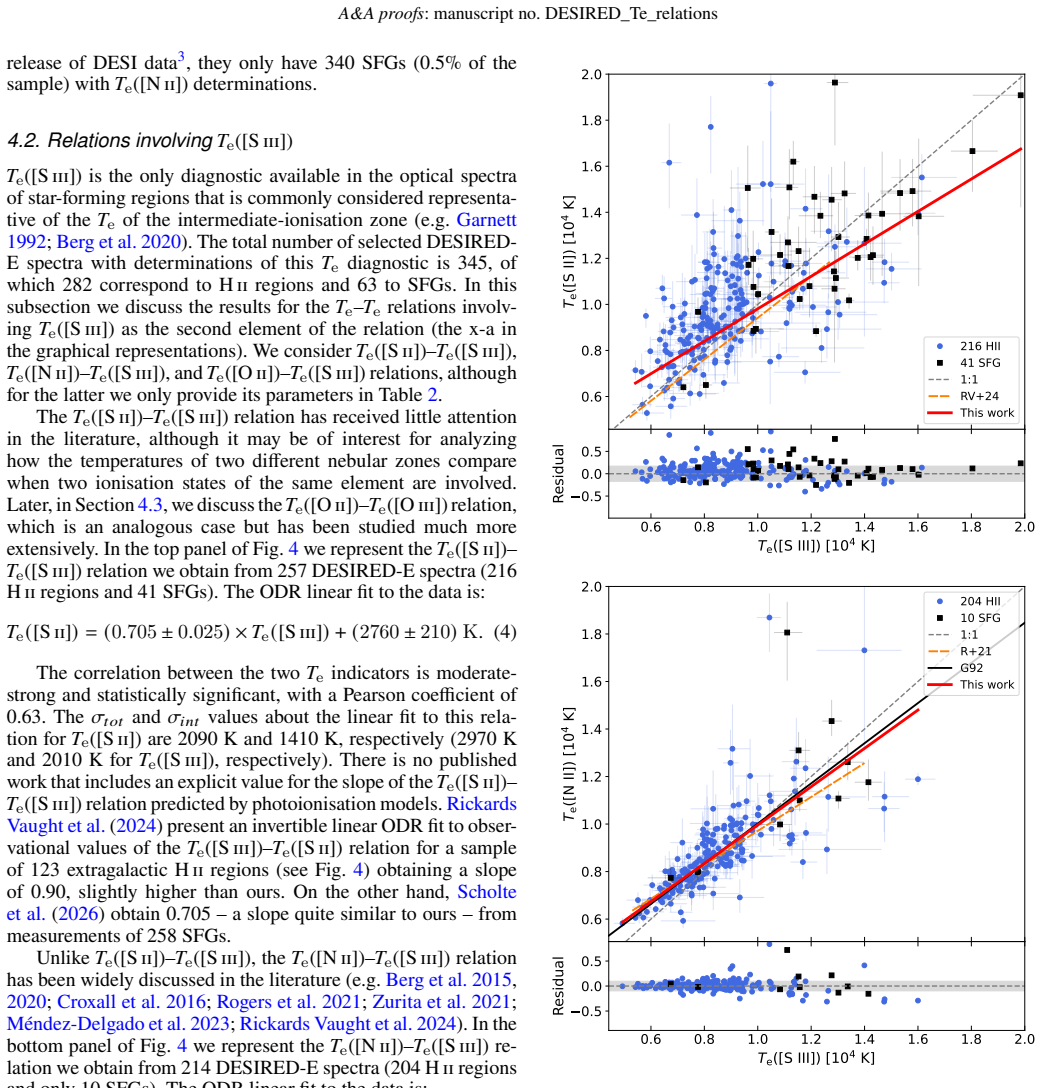
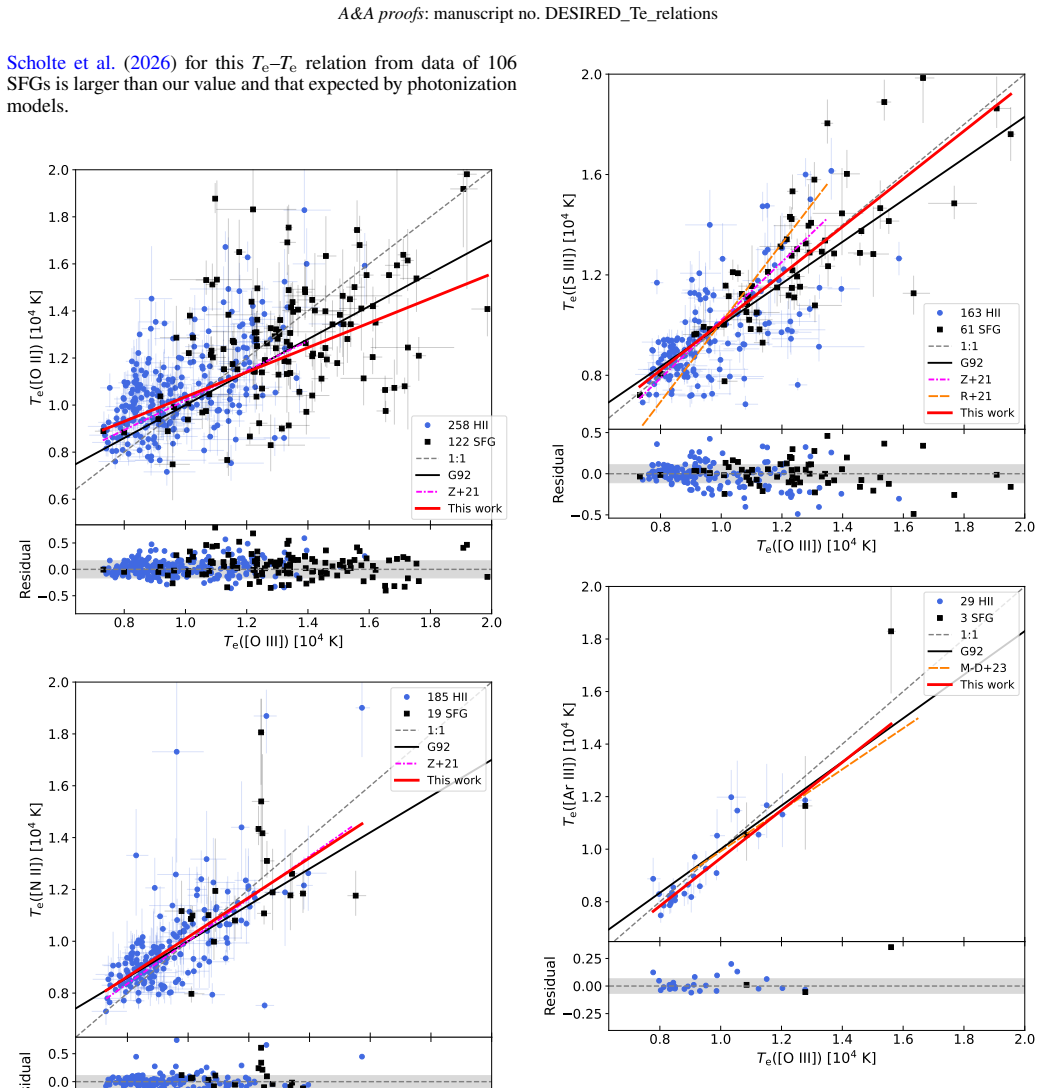
Aims. We present a homogeneous observational study of electron temperature ($T_{\rm e}$) relations between ionic species: $T_{\rm e}$([N II]), $T_{\rm e}$([O II]), $T_{\rm e}$([O III]), $T_{\rm e}$([S II]), $T_{\rm e}$([S III]) and $T_{\rm e}$([Ar III]), using 699 spectra of Galactic and extragalactic H II regions and local star-forming galaxies (SFGs). Methods. We use the DEep Spectra of Ionised REgions Database Extended (DESIRED-E), comprising more than 3000 spectra with direct $T_{\rm e}$ determinations, selecting those with at least two $T_{\rm e}$ diagnostics. We recompute electron density ($n_{\rm e}$) and $T_{\rm e}$ using updated atomic data and a consistent methodology. The resulting $T_{\rm e}$--$T_{\rm e}$ relations are analysed using orthogonal distance regression, quantifying total and intrinsic dispersions and comparing slopes with previous works and photoionisation models. Results. Relations involving low-ionisation $T_{\rm e}$ diagnostics show large intrinsic dispersions, especially for $T_{\rm e}$([O II]) and $T_{\rm e}$([S II]), likely due to sensitivity to $n_{\rm e}$ inhomogeneities, recombination contributions, and uncertainties. In contrast, relations using $T_{\rm e}$([N II]) show lower dispersions, indicating that this diagnostic provides a more reliable estimate of the low-ionisation zone temperature when only higher-ionisation $T_{\rm e}$ diagnostics are available, despite observational difficulties at low metallicity. Overall, slopes agree with model predictions, particularly for relations with low intrinsic dispersion, such as those involving $T_{\rm e}$([N II]) and $T_{\rm e}$([S III]). These results provide a robust empirical basis for estimating $T_{\rm e}$ when limited diagnostics are available.
Editorial analysis
A structured set of objections, weighed in public.
Referee Report
Summary. The manuscript presents a homogeneous analysis of electron temperature (Te) relations among ionic species (Te([N II]), Te([O II]), Te([O III]), Te([S II]), Te([S III]), Te([Ar III])) using 699 spectra from the DESIRED-E database of H II regions and star-forming galaxies that possess at least two direct Te diagnostics. It recomputes ne and Te with updated atomic data under a consistent methodology, fits the relations via orthogonal distance regression, separates total and intrinsic dispersions, and compares slopes to prior empirical relations and photoionisation models, concluding that Te([N II]) relations exhibit lower intrinsic dispersions and therefore supply a more reliable low-ionisation zone temperature estimate when only higher-ionisation diagnostics are available.
Significance. If the central relations hold, the work supplies a useful empirical foundation for Te estimation in nebular spectra with incomplete diagnostics. Notable strengths are the large, homogeneous sample, consistent re-derivation with updated atomic data, explicit separation of intrinsic versus total dispersion, and direct slope comparisons to models. These elements support practical application in the field provided the sample-selection limitations are addressed.
major comments (2)
- [Methods] Methods (sample selection paragraph): The 699 spectra are defined by the presence of at least two detectable Te diagnostics, which necessarily includes strong low-ionisation auroral lines ([N II] 5755, [O II] 7325, [S II] 4069). The reported lower intrinsic dispersion for all Te([N II]) relations is therefore measured exclusively inside this selection. The headline claim that Te([N II]) is more reliable when only higher-ionisation diagnostics are available requires the same low dispersion to hold in the complementary population (low-metallicity or low-S/N objects where [N II] 5755 is undetectable); no subset test or extrapolation is described.
- [Results] Results (dispersion analysis): The separation of intrinsic from total dispersion is central to the reliability ranking of the diagnostics, yet the text provides no explicit description of the error-propagation procedure used in the orthogonal distance regression or of the statistical method employed to isolate the intrinsic component. This omission prevents independent verification of the quantitative claim that Te([N II]) relations are demonstrably tighter.
minor comments (2)
- [Abstract] Abstract: Add one sentence summarising the error-propagation approach and the effect of the multi-diagnostic selection criterion on the reported dispersions.
- [Figures/Tables] Figure captions and tables: Ensure all panels and rows are labelled with the exact ionic species and the number of spectra used, and that the intrinsic-dispersion values are quoted with their uncertainties.
Simulated Author's Rebuttal
We thank the referee for their thoughtful and constructive report. Their comments have identified key areas where the manuscript can be clarified and strengthened. We address each major comment in detail below and outline the revisions we will make.
read point-by-point responses
-
Referee: [Methods] Methods (sample selection paragraph): The 699 spectra are defined by the presence of at least two detectable Te diagnostics, which necessarily includes strong low-ionisation auroral lines ([N II] 5755, [O II] 7325, [S II] 4069). The reported lower intrinsic dispersion for all Te([N II]) relations is therefore measured exclusively inside this selection. The headline claim that Te([N II]) is more reliable when only higher-ionisation diagnostics are available requires the same low dispersion to hold in the complementary population (low-metallicity or low-S/N objects where [N II] 5755 is undetectable); no subset test or extrapolation is described.
Authors: We acknowledge that our sample selection requires detectable auroral lines for at least two diagnostics, which inherently favors objects with measurable low-ionization lines. The Te([N II]) relations are derived from this homogeneous set and are intended for application in spectra possessing only higher-ionization diagnostics (e.g., Te([O III])), where the fitted relations can be used to infer the low-ionization temperature. The lower intrinsic dispersions we report support greater reliability for this purpose. In the revised manuscript we will expand the discussion of sample selection to explicitly address potential biases, note the assumptions required for extrapolation to the complementary population, and highlight the supporting agreement with photoionization models across the observed metallicity range. A direct subset test on objects lacking [N II] λ5755 is not feasible, as those objects lack Te([N II]) measurements by construction. revision: partial
-
Referee: [Results] Results (dispersion analysis): The separation of intrinsic from total dispersion is central to the reliability ranking of the diagnostics, yet the text provides no explicit description of the error-propagation procedure used in the orthogonal distance regression or of the statistical method employed to isolate the intrinsic component. This omission prevents independent verification of the quantitative claim that Te([N II]) relations are demonstrably tighter.
Authors: We agree that a clear description of the statistical procedures is necessary for reproducibility and verification. In the revised version we will add a dedicated paragraph (in the Methods section) detailing the orthogonal distance regression implementation, including how measurement uncertainties in both Te variables are incorporated via the ODR algorithm, and the exact procedure used to isolate the intrinsic dispersion component. The intrinsic dispersion is obtained by subtracting the average measurement variance in quadrature from the total observed scatter around the best-fit line, following standard astronomical practice for such relations. This addition will enable readers to reproduce and verify the lower intrinsic dispersions found for the Te([N II]) relations. revision: yes
- Direct empirical measurement of dispersions for Te([N II]) relations in the population of objects where [N II] λ5755 is undetectable, since such objects lack Te([N II]) measurements by definition.
Circularity Check
No circularity: purely empirical relations measured from direct observations
full rationale
The paper selects 699 spectra that yield at least two direct Te diagnostics, recomputes ne and Te values with updated atomic data using a uniform method, then applies orthogonal distance regression to quantify observed Te-Te relations and their total/intrinsic dispersions. All reported slopes, dispersions, and the comparative claim for Te([N II]) are direct statistical summaries of these measured data points; no parameter is fitted to a subset and then re-used as a prediction, no self-referential definition equates inputs to outputs, and no load-bearing step reduces to a prior self-citation or ansatz. The derivation chain is therefore self-contained observational analysis without any reduction by construction.
Axiom & Free-Parameter Ledger
axioms (2)
- domain assumption Updated atomic data produce more accurate Te and ne than previous compilations
- standard math Orthogonal distance regression correctly separates intrinsic and total dispersion
Reference graph
Works this paper leans on
-
[1]
Aller, L. H., Hung, S., & Feibelman, W. A. 1999, Proceedings of the National Academy of Science, 96, 5366 Arellano-Córdova, K. Z., Berg, D. A., Chisholm, J., et al. 2022, ApJ, 940, L23 Arellano-Córdova, K. Z., Cullen, F., Carnall, A. C., et al. 2025, MNRAS, 540, 2991 Arellano-Córdova,K.Z.,Esteban,C.,García-Rojas,J.,&Méndez-Delgado,J.E. 2020, MNRAS, 496, 1...
work page 1999
- [2]
- [3]
-
[4]
Berg, D. A., Skillman, E. D., Croxall, K. V., et al. 2015, ApJ, 806, 16
work page 2015
-
[5]
Berg, D. A., Skillman, E. D., Garnett, D. R., et al. 2013, ApJ, 775, 128
work page 2013
- [6]
-
[7]
Brazzini, M., Belfiore, F., Ginolfi, M., et al. 2024, A&A, 691, A173
work page 2024
- [8]
- [9]
-
[10]
Campbell, A., Terlevich, R., & Melnick, J. 1986, MNRAS, 223, 811
work page 1986
-
[11]
Cataldi, E., Belfiore, F., Curti, M., et al. 2025, arXiv e-prints, arXiv:2504.03839 Croxall,K.V.,Pogge,R.W.,Berg,D.A.,Skillman,E.D.,&Moustakas,J.2016, ApJ, 830, 4
-
[12]
Curti, M., D’Eugenio, F., Carniani, S., et al. 2023, MNRAS, 518, 425
work page 2023
-
[13]
Deb, N. C. & Hibbert, A. 2009, Atomic Data and Nuclear Data Tables, 95, 184
work page 2009
-
[14]
Deharveng, L., Peña, M., Caplan, J., & Costero, R. 2000, MNRAS, 311, 329 Article number, page 12 of 15 Orte-García et al.: Temperature relations in star-forming regions
work page 2000
-
[15]
Esteban, C. 2016, MNRAS, 456, 3855 Dinerstein,H.L.1990,inAstrophysicsandSpaceScienceLibrary,Vol.161,The Interstellar Medium in Galaxies, ed. J. Thronson, Harley A. & J. M. Shull, 257–285 Domínguez-Guzmán,G.,Rodríguez,M.,García-Rojas,J.,Esteban,C.,&Toribio San Cipriano, L. 2022, MNRAS, 517, 4497
work page 2016
-
[16]
Esteban, C., Bresolin, F., García-Rojas, J., & Toribio San Cipriano, L. 2020, MNRAS, 491, 2137
work page 2020
-
[17]
Esteban, C., Bresolin, F., Peimbert, M., et al. 2009, ApJ, 700, 654
work page 2009
-
[18]
Esteban, C., Carigi, L., Copetti, M. V. F., et al. 2013, MNRAS, 433, 382
work page 2013
-
[19]
Esteban, C., Fang, X., García-Rojas, J., & Toribio San Cipriano, L. 2017, MN- RAS, 471, 987
work page 2017
- [20]
-
[21]
Esteban, C., García-Rojas, J., Carigi, L., et al. 2014, MNRAS, 443, 624
work page 2014
-
[22]
2004, MNRAS, 355, 229 Fernández, V., Amorín, R., Pérez-Montero, E., et al
Esteban, C., Peimbert, M., García-Rojas, J., et al. 2004, MNRAS, 355, 229 Fernández, V., Amorín, R., Pérez-Montero, E., et al. 2022, MNRAS, 511, 2515 Fernández, V., Terlevich, E., Díaz, A. I., Terlevich, R., & Rosales-Ortega, F. F. 2018, MNRAS, 478, 5301 Fernández-Martín,A.,Pérez-Montero,E.,Vílchez,J.M.,&Mampaso,A.2017, A&A, 597, A84
work page 2004
-
[23]
Fritzsche, S., Fricke, B., Geschke, D., Heitmann, A., & Sienkiewicz, J. E. 1999, ApJ, 518, 994 Froese Fischer, C. & Tachiev, G. 2004a, Atomic Data and Nuclear Data Tables, 87, 1 Froese Fischer, C. & Tachiev, G. 2004b, Atomic Data and Nuclear Data Tables, 87, 1 Froese Fischer, C., Tachiev, G., & Irimia, A. 2006, Atomic Data and Nuclear Data Tables, 92, 607
work page 1999
-
[24]
Galavis, M. E., Mendoza, C., & Zeippen, C. J. 1995, A&AS, 111, 347 García-Rojas, J., Esteban, C., Peimbert, A., et al. 2005, MNRAS, 362, 301 García-Rojas, J., Esteban, C., Peimbert, A., et al. 2007, Rev. Mexicana Astron. Astrofis., 43, 3 García-Rojas, J., Esteban, C., Peimbert, M., et al. 2006, MNRAS, 368, 253 García-Rojas, J., Esteban, C., Peimbert, M., ...
work page 1995
-
[25]
Garnett, D. R. 1992, AJ, 103, 1330 Grieve,M.F.R.,Ramsbottom,C.A.,Hudson,C.E.,&Keenan,F.P.2014,ApJ, 780, 110
work page 1992
-
[26]
Groves, B., Kreckel, K., Santoro, F., et al. 2023, MNRAS, 520, 4902
work page 2023
-
[27]
Guseva, N. G., Izotov, Y. I., Stasińska, G., et al. 2011, A&A, 529, A149
work page 2011
- [28]
-
[29]
Guseva, N. G., Papaderos, P., Izotov, Y. I., et al. 2003, A&A, 407, 105
work page 2003
-
[30]
Guseva, N. G., Papaderos, P., Meyer, H. T., Izotov, Y. I., & Fricke, K. J. 2009, A&A, 505, 63
work page 2009
-
[31]
Guseva, N. G., Thuan, T. X., & Izotov, Y. I. 2024, MNRAS, 527, 3932 Hägele, G. F., Díaz, Á. I., Terlevich, E., et al. 2008, MNRAS, 383, 209 Hägele,G.F.,Pérez-Montero,E.,Díaz,Á.I.,Terlevich,E.,&Terlevich,R.2006, MNRAS, 372, 293
work page 2024
-
[32]
Data analysis recipes: Fitting a model to data
Hogg, D. W., Bovy, J., & Lang, D. 2010, arXiv e-prints, arXiv:1008.4686
work page internal anchor Pith review Pith/arXiv arXiv 2010
- [33]
-
[34]
Izotov, Y. I., Guseva, N. G., Fricke, K. J., & Papaderos, P. 2009, A&A, 503, 61
work page 2009
-
[35]
Izotov, Y. I., Papaderos, P., Guseva, N. G., Fricke, K. J., & Thuan, T. X. 2004, A&A, 421, 539
work page 2004
-
[36]
I., Stasińska, G., Meynet, G., Guseva, N
Izotov, Y. I., Stasińska, G., Meynet, G., Guseva, N. G., & Thuan, T. X. 2006, A&A, 448, 955
work page 2006
-
[37]
Izotov, Y. I. & Thuan, T. X. 2004, ApJ, 602, 200
work page 2004
- [38]
- [39]
- [40]
- [41]
-
[42]
Izotov, Y. I., Thuan, T. X., & Stasińska, G. 2007, ApJ, 662, 15 Juan de Dios, L. & Rodríguez, M. 2017, MNRAS, 469, 1036
work page 2007
-
[43]
Kauffmann, G., Heckman, T. M., Tremonti, C., et al. 2003, MNRAS, 346, 1055 Kaufman,V.&Sugar,J.1986,JournalofPhysicalandChemicalReferenceData, 15, 321
work page 2003
-
[44]
Kennicutt, Robert C., J., Bresolin, F., & Garnett, D. R. 2003, ApJ, 591, 801
work page 2003
-
[45]
Kewley, L. J., Dopita, M. A., Sutherland, R. S., Heisler, C. A., & Trevena, J. 2001, ApJ, 556, 121
work page 2001
-
[46]
Kisielius, R., Storey, P. J., Ferland, G. J., & Keenan, F. P. 2009, MNRAS, 397, 903
work page 2009
- [47]
-
[48]
Liu, X. W., Luo, S. G., Barlow, M. J., Danziger, I. J., & Storey, P. J. 2001, MNRAS, 327, 141 López-Sánchez, A. R. & Esteban, C. 2009, A&A, 508, 615 López-Sánchez,Á.R.,Esteban,C.,García-Rojas,J.,Peimbert,M.,&Rodríguez, M. 2007, ApJ, 656, 168
work page 2001
-
[49]
Luridiana, V., Morisset, C., & Shaw, R. A. 2015, A&A, 573, A42 Méndez-Delgado, J. E., Esteban, C., García-Rojas, J., et al. 2023, MNRAS, 523, 2952 Méndez-Delgado, J. E., Esteban, C., García-Rojas, J., & Henney, W. J. 2022, MNRAS, 514, 744 Méndez-Delgado,J.E.,Esteban,C.,García-Rojas,J.,etal.2021a,MNRAS,502, 1703 Méndez-Delgado, J. E., Esteban, C., García-R...
work page 2015
-
[50]
Mendoza, C. 1983, in IAU Symposium, Vol. 103, Planetary Nebulae, ed. L. H. Aller, 143–172 Mendoza,C.,Méndez-Delgado,J.E.,Bautista,M.,García-Rojas,J.,&Morisset, C. 2023, Atoms, 11, 63
work page 1983
- [51]
-
[52]
Mesa-Delgado, A., Esteban, C., García-Rojas, J., et al. 2009, MNRAS, 395, 855
work page 2009
-
[53]
Morisset, C., Luridiana, V., García-Rojas, J., et al. 2020, Atoms, 8, 66
work page 2020
- [54]
- [55]
-
[56]
Oey, M. S., Dopita, M. A., Shields, J. C., & Smith, R. C. 2000, ApJS, 128, 511
work page 2000
-
[57]
Pagel, B. E. J., Simonson, E. A., Terlevich, R. J., & Edmunds, M. G. 1992, MNRAS, 255, 325
work page 1992
-
[58]
Palay, E., Nahar, S. N., Pradhan, A. K., & Eissner, W. 2012, MNRAS, 423, L35 Peña-Guerrero, M. A., Peimbert, A., Peimbert, M., & Ruiz, M. T. 2012, ApJ, 746, 115
work page 2012
- [59]
-
[60]
Peimbert, A., Peña-Guerrero, M. A., & Peimbert, M. 2012, ApJ, 753, 39
work page 2012
-
[61]
Peimbert, A., Peimbert, M., & Ruiz, M. T. 2005, ApJ, 634, 1056
work page 2005
-
[62]
Peimbert, M. & Costero, R. 1969, Boletin de los Observatorios Tonantzintla y Tacubaya, 5, 3
work page 1969
-
[63]
1986, A&A, 158, 266 Pérez-Montero, E
Peimbert, M., Pena, M., & Torres-Peimbert, S. 1986, A&A, 158, 266 Pérez-Montero, E. & Díaz, A. I. 2003, MNRAS, 346, 105 Pérez-Montero, E., Díaz, A. I., Vílchez, J. M., & Kehrig, C. 2006, A&A, 449, 193
work page 1986
-
[64]
Pilyugin, L. S., Mattsson, L., Vílchez, J. M., & Cedrés, B. 2009, MNRAS, 398, 485
work page 2009
-
[65]
Pilyugin, L. S., Vílchez, J. M., & Thuan, T. X. 2006, MNRAS, 370, 1928
work page 2006
-
[66]
Ramsbottom, C. A. & Bell, K. L. 1997, Atomic Data and Nuclear Data Tables, 66, 65 RickardsVaught,R.J.,Sandstrom,K.M.,Belfiore,F.,etal.2024,ApJ,966,130 Rodríguez, M. 2020, MNRAS, 495, 1016
work page 1997
-
[67]
Rogers, N. S. J., Skillman, E. D., Pogge, R. W., et al. 2022, ApJ, 939, 44
work page 2022
-
[68]
Rogers, N. S. J., Skillman, E. D., Pogge, R. W., et al. 2021, ApJ, 915, 21
work page 2021
- [69]
-
[70]
Rubin, R. H. 1986, ApJ, 309, 334
work page 1986
- [71]
-
[72]
Schaerer, D., Marques-Chaves, R., Barrufet, L., et al. 2022, A&A, 665, L4
work page 2022
- [73]
-
[74]
Skillman, E. D., Côté, S., & Miller, B. W. 2003, AJ, 125, 610 Stasińska, G. 1980, A&A, 85, 359 Stasińska, G. 1982, A&AS, 48, 299 Stasińska, G. 1990, A&AS, 83, 501 Stasińska, G. 2005, A&A, 434, 507 Stasińska, G. & Schaerer, D. 1997, A&A, 322, 615
work page 2003
-
[75]
Storey, P. J. & Hummer, D. G. 1995, MNRAS, 272, 41
work page 1995
-
[76]
Storey, P. J., Sochi, T., & Badnell, N. R. 2014, MNRAS, 441, 3028
work page 2014
-
[77]
Storey, P. J. & Zeippen, C. J. 2000, MNRAS, 312, 813
work page 2000
-
[78]
Sutherland, R. S. & Dopita, M. A. 1993, ApJS, 88, 253
work page 1993
-
[79]
Tayal, S. S. 2004, A&A, 426, 717
work page 2004
-
[80]
Tayal, S. S. & Zatsarinny, O. 2010, ApJS, 188, 32
work page 2010
discussion (0)
Sign in with ORCID, Apple, or X to comment. Anyone can read and Pith papers without signing in.