Njord: A Probabilistic Graph Neural Network for Ensemble Ocean Forecasting
Pith reviewed 2026-05-19 14:39 UTC · model grok-4.3
The pith
A probabilistic graph neural network for ocean forecasting achieves the lowest errors on a global benchmark while providing uncertainty estimates.
A machine-rendered reading of the paper's core claim, the machinery that carries it, and where it could break.
Core claim
Njord integrates a deep latent variable framework with a graph neural network architecture on K-means cluster meshes, enabling single-pass sampling of ensemble forecasts that outperform deterministic baselines on upper-ocean variables while supplying uncertainty estimates from the ensembles.
What carries the argument
K-means cluster meshes adapted to irregular sea surface geometry, combined with a deep latent variable model that supports efficient probabilistic sampling within the graph neural network.
Load-bearing premise
K-means cluster meshes adapt sufficiently well to irregular sea-surface geometry to allow accurate and efficient scaling of the graph neural network to global 0.25-degree and regional 2 km grids.
What would settle it
Demonstrating that a competing model produces lower average errors than Njord across upper-ocean variables on the OceanBench benchmark when validated against real-world observations would undermine the performance advantage.
Figures












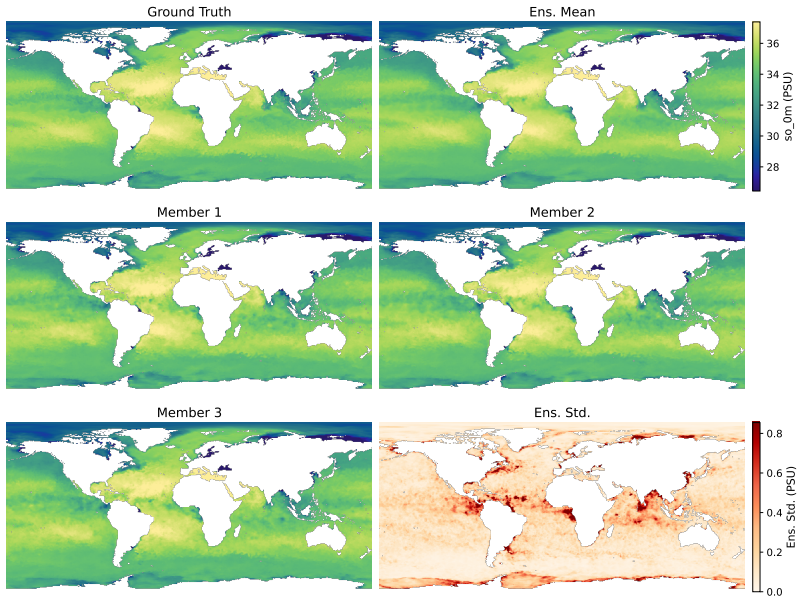

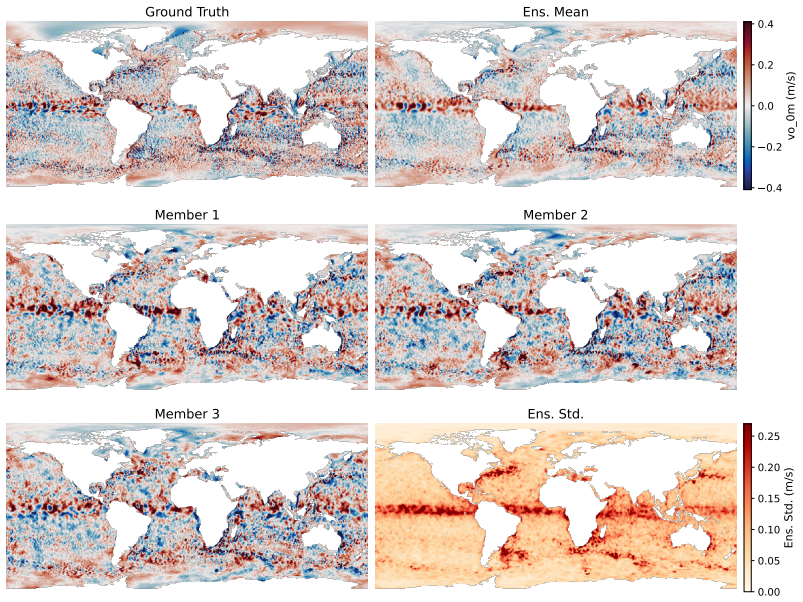


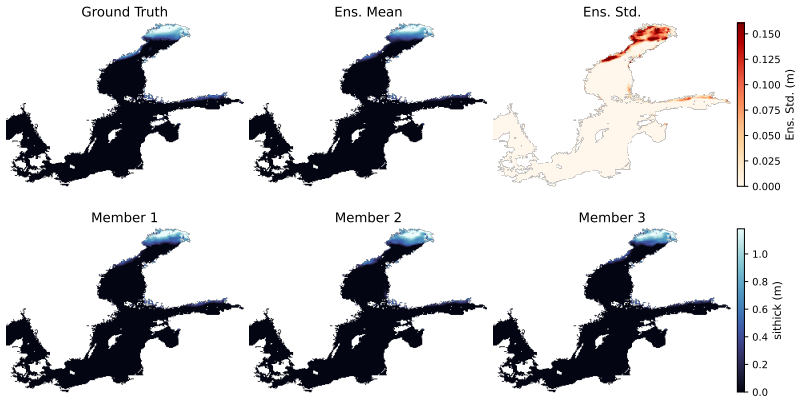
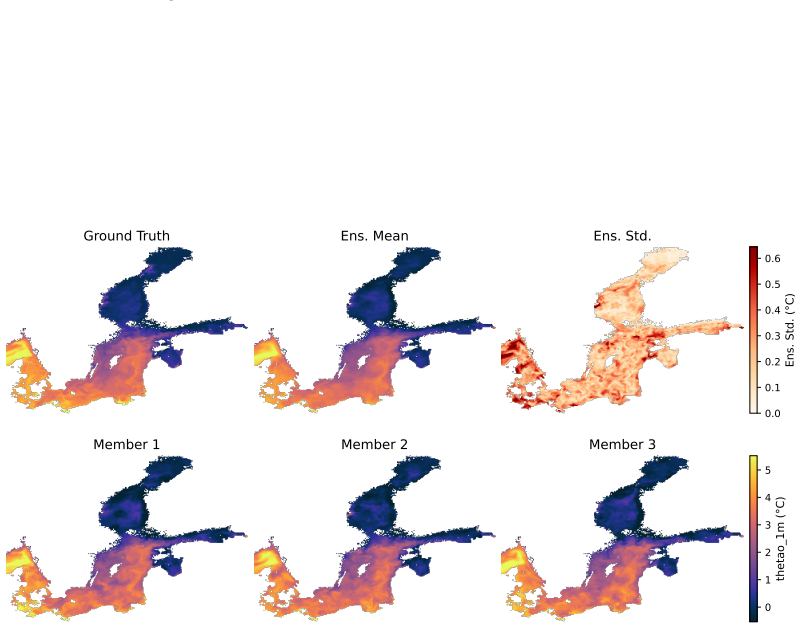


read the original abstract
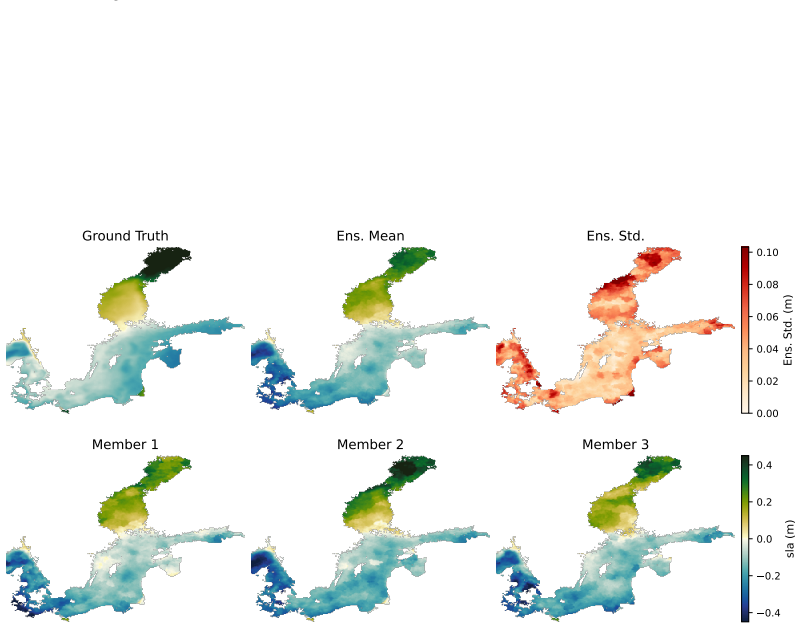
Ocean dynamics are inherently chaotic, yet existing machine learning ocean models produce only deterministic forecasts. We introduce Njord, a probabilistic data-driven model for ocean forecasting, applicable to both global and regional domains. Njord combines a deep latent variable framework with a graph neural network architecture, enabling sampling each forecast step in a single forward pass. We apply Njord globally at 0.25{\deg} resolution and regionally to the Baltic Sea at 2 km resolution. To scale to these large ocean grids we introduce K-means cluster meshes that adapt to irregular sea surface geometry. Experiments demonstrate strong performance on both domains compared to deterministic machine learning baselines, while also providing uncertainty estimates from the sampled ensemble forecasts. On the global OceanBench benchmark, Njord achieves the lowest errors on average across upper-ocean variables when evaluated against real-world observations, with the largest improvements in surface temperature prediction.
Editorial analysis
A structured set of objections, weighed in public.
Referee Report
Summary. The manuscript introduces Njord, a probabilistic graph neural network for ensemble ocean forecasting that combines a deep latent variable model with GNN message passing to generate sampled forecasts in a single forward pass. It scales the approach to a global 0.25° grid and a regional 2 km Baltic Sea grid by introducing K-means cluster meshes that adapt to irregular sea-surface geometry. The central empirical claim is that Njord attains the lowest average errors across upper-ocean variables on the OceanBench benchmark when evaluated against real-world observations, with the largest gains in surface temperature, while also supplying uncertainty estimates from the ensemble.
Significance. If the performance and scaling claims are substantiated, the work would be significant for demonstrating that probabilistic GNNs can deliver calibrated ensemble forecasts for chaotic ocean dynamics at both global and high-resolution regional scales. The provision of uncertainty estimates alongside competitive point forecasts against real observations addresses a practical gap in existing deterministic ML ocean models. The adaptive mesh construction, if shown to respect physical boundaries, could serve as a reusable technique for applying graph-based methods to masked geophysical domains.
major comments (1)
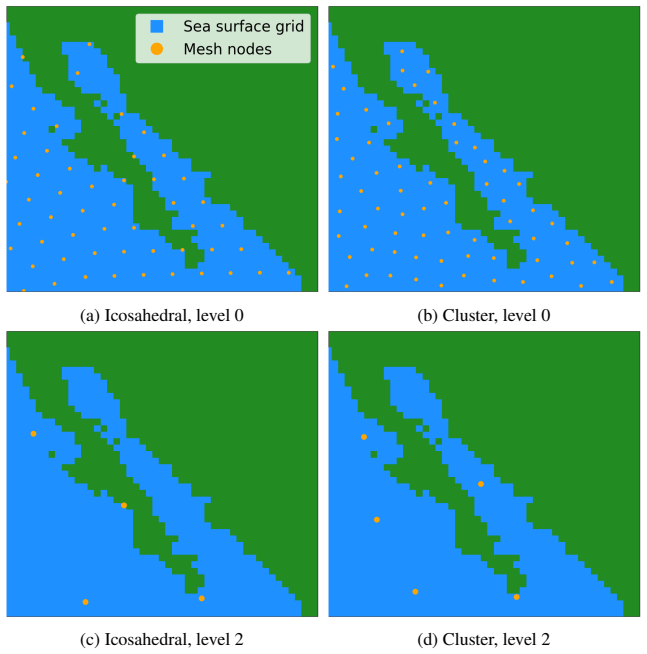
- [Abstract] Abstract and mesh-construction section: the claim that K-means cluster meshes 'adapt to irregular sea surface geometry' is load-bearing for the scaling argument to 0.25° global and 2 km regional grids, yet no description is given of how land-sea masks are enforced, whether invalid cross-land edges are removed, or what mesh-quality metrics (e.g., connectivity, boundary fidelity) are satisfied. Standard K-means on latitude-longitude coordinates does not inherently respect masks; without explicit post-processing or boundary-aware clustering, message passing can produce unphysical connections, undermining the applicability claim.
minor comments (1)
- [Abstract] Abstract: quantitative error values, baseline definitions, and training details are omitted even though the headline performance claim is stated; adding at least the key RMSE or MAE numbers and the names of the deterministic ML baselines would improve readability.
Simulated Author's Rebuttal
We thank the referee for their constructive and detailed review. The concern about insufficient description of the K-means mesh construction and mask handling is well-taken. We address this point below and will revise the manuscript to provide the requested technical details.
read point-by-point responses
-
Referee: [Abstract] Abstract and mesh-construction section: the claim that K-means cluster meshes 'adapt to irregular sea surface geometry' is load-bearing for the scaling argument to 0.25° global and 2 km regional grids, yet no description is given of how land-sea masks are enforced, whether invalid cross-land edges are removed, or what mesh-quality metrics (e.g., connectivity, boundary fidelity) are satisfied. Standard K-means on latitude-longitude coordinates does not inherently respect masks; without explicit post-processing or boundary-aware clustering, message passing can produce unphysical connections, undermining the applicability claim.
Authors: We agree that the manuscript currently provides insufficient detail on how the K-means meshes enforce land-sea boundaries. In the revised version we will expand the mesh-construction section with the following additions: (i) clustering is performed exclusively on sea-grid points identified by the land-sea mask; (ii) after clustering, any graph edges connecting nodes separated by land are explicitly removed by a post-processing step that checks line-of-sight connectivity within the masked domain; (iii) we will report quantitative mesh-quality metrics including average node degree, fraction of boundary nodes, and verification that no cross-land edges remain. These clarifications will substantiate the adaptation claim and rule out unphysical message passing. We believe the revised description will fully address the referee’s concern. revision: yes
Circularity Check
No circularity; derivation and claims are self-contained with external validation
full rationale
The paper presents Njord as a novel probabilistic latent-variable GNN for ensemble ocean forecasting, with K-means cluster meshes introduced to handle irregular sea-surface geometry at global 0.25° and regional 2 km scales. The central performance claim rests on evaluation against real-world observations on the public OceanBench benchmark, which is independent of the model's fitted parameters or internal definitions. No equations, predictions, or uniqueness arguments in the abstract or described content reduce by construction to inputs, self-citations, or ansatzes; the architecture and mesh adaptation are positioned as original contributions whose validity is tested externally rather than assumed via prior self-referential results.
Axiom & Free-Parameter Ledger
free parameters (1)
- Neural network hyperparameters (depth, width, learning rate, latent dimension)
axioms (1)
- domain assumption Ocean dynamics on irregular domains can be faithfully represented by graph neural networks on K-means-derived meshes
Lean theorems connected to this paper
-
IndisputableMonolith/Foundation/AlexanderDuality.leanalexander_duality_circle_linking unclear?
unclearRelation between the paper passage and the cited Recognition theorem.
To construct a graph better adapted to the geometry of the global ocean we instead place the graph nodes based on the density of ocean grid points. We apply spherical K-means clustering of the ocean grid point 3D Cartesian coordinates...
-
IndisputableMonolith/Cost/FunctionalEquation.leanwashburn_uniqueness_aczel unclear?
unclearRelation between the paper passage and the cited Recognition theorem.
Njord combines a deep latent variable framework with a graph neural network architecture, enabling sampling each forecast step in a single forward pass.
What do these tags mean?
- matches
- The paper's claim is directly supported by a theorem in the formal canon.
- supports
- The theorem supports part of the paper's argument, but the paper may add assumptions or extra steps.
- extends
- The paper goes beyond the formal theorem; the theorem is a base layer rather than the whole result.
- uses
- The paper appears to rely on the theorem as machinery.
- contradicts
- The paper's claim conflicts with a theorem or certificate in the canon.
- unclear
- Pith found a possible connection, but the passage is too broad, indirect, or ambiguous to say the theorem truly supports the claim.
Reference graph
Works this paper leans on
-
[1]
Pierre Yves Le Traon, Antonio Reppucci, Enrique Alvarez Fanjul, Lotfi Aouf, Arno Behrens, Maria Belmonte, Abderrahim Bentamy, Laurent Bertino, Vittorio Ernesto Brando, Matilde Brandt Kreiner, et al. From observation to information and users: The Copernicus Marine Service perspective.Frontiers in Marine Science, 6:234, 2019
work page 2019
-
[2]
Jean-Michel Lellouche, Eric Greiner, Giovanni Ruggiero, Romain Bourdallé-Badie, Charles- Emmanuel Testut, Olivier Le Galloudec, Mounir Benkiran, and Gilles Garric. Evolution of the Copernicus Marine Service global ocean analysis and forecasting high-resolution system: Potential benefit for a wide range of users. InEuroGOOS International Conference, volume...
work page 2023
-
[3]
Tuomas Kärnä, Patrik Ljungemyr, Saeed Falahat, Ida Ringgaard, Lars Axell, Vasily Korabel, Jens Murawski, Ilja Maljutenko, Anja Lindenthal, Simon Jandt-Scheelke, et al. Nemo-Nordic 2.0: Operational marine forecast model for the Baltic Sea.Geoscientific Model Development, 14(9):5731–5749, 2021
work page 2021
-
[4]
Anass El Aouni, Quentin Gaudel, Charly Regnier, Simon Van Gennip, Olivier Le Galloudec, Marie Drevillon, Yann Drillet, and Jean-Michel Lellouche. GLONET: Mercator’s end-to-end neural global ocean forecasting system.Journal of Geophysical Research: Machine Learning and Computation, 2(3), 2025
work page 2025
-
[5]
Daniel Holmberg, Emanuela Clementi, Italo Epicoco, and Teemu Roos. Accurate Mediter- ranean Sea forecasting via graph-based deep learning.Scientific Reports, 15(45051), 2025
work page 2025
-
[6]
Forecasting the eddying ocean with a deep neural network
Yingzhe Cui, Ruohan Wu, Xiang Zhang, Ziqi Zhu, Bo Liu, Jun Shi, Junshi Chen, Hailong Liu, Shenghui Zhou, Liang Su, et al. Forecasting the eddying ocean with a deep neural network. Nature Communications, 16(1):2268, 2025. 10
work page 2025
-
[7]
Xiang Wang, Renzhi Wang, Ningzi Hu, Pinqiang Wang, Peng Huo, Guihua Wang, Huizan Wang, Senzhang Wang, Junxing Zhu, Jianbo Xu, et al. XiHe: A data-driven model for global ocean eddy-resolving forecasting.arXiv preprint arXiv:2402.02995, 2024
-
[8]
FuXi-Ocean: A global ocean forecasting system with sub-daily resolution
Qiusheng Huang, Yuan Niu, Xiaohui Zhong, Anboyu Guo, Lei Chen, Dianjun Zhang, Xuefeng Zhang, and Hao Li. FuXi-Ocean: A global ocean forecasting system with sub-daily resolution. InAdvances in Neural Information Processing Systems, volume 38, 2025
work page 2025
-
[9]
Probabilistic weather forecasting with hierarchical graph neural networks
Joel Oskarsson, Tomas Landelius, Marc P Deisenroth, and Fredrik Lindsten. Probabilistic weather forecasting with hierarchical graph neural networks. InAdvances in Neural Informa- tion Processing Systems, volume 37, 2024
work page 2024
-
[10]
Proba- bilistic weather forecasting with machine learning.Nature, 637(8044):84–90, 2025
Ilan Price, Alvaro Sanchez-Gonzalez, Ferran Alet, Tom R Andersson, Andrew El-Kadi, Do- minic Masters, Timo Ewalds, Jacklynn Stott, Shakir Mohamed, Peter Battaglia, et al. Proba- bilistic weather forecasting with machine learning.Nature, 637(8044):84–90, 2025
work page 2025
-
[11]
Ashesh Chattopadhyay, Michael Gray, Tianning Wu, Anna B Lowe, and Ruoying He. Ocean- Net: A principled neural operator-based digital twin for regional oceans.Scientific Reports, 14 (21181), 2024
work page 2024
-
[12]
OceanBench: A benchmark for data-driven global ocean forecasting systems
Anass El Aouni, Quentin Gaudel, Juan Emmanuel Johnson, Regnier Charly, Julien Le Sommer, Ronan Fablet, Marie Drevillon, Yann Drillet, Pierre Yves Le Traon, et al. OceanBench: A benchmark for data-driven global ocean forecasting systems. InNeural Information Processing Systems, volume 39, 2025
work page 2025
-
[13]
Tom R Andersson, J Scott Hosking, María Pérez-Ortiz, Brooks Paige, Andrew Elliott, Chris Russell, Stephen Law, Daniel C Jones, Jeremy Wilkinson, Tony Phillips, et al. Seasonal Arctic sea ice forecasting with probabilistic deep learning.Nature Communications, 12(1):5124, 2021
work page 2021
-
[14]
Chenggong Wang, Michael S Pritchard, Noah Brenowitz, Yair Cohen, Boris Bonev, Thorsten Kurth, Dale Durran, and Jaideep Pathak. Coupled ocean-atmosphere dynamics in a machine learning Earth system model.arXiv preprint arXiv:2406.08632, 2024
-
[15]
Samudra: An AI global ocean emulator for climate.Geo- physical Research Letters, 52(10), 2025
Surya Dheeshjith, Adam Subel, Alistair Adcroft, Julius Busecke, Carlos Fernandez-Granda, Shubham Gupta, and Laure Zanna. Samudra: An AI global ocean emulator for climate.Geo- physical Research Letters, 52(10), 2025
work page 2025
-
[16]
Data-driven ensemble prediction of the global ocean.arXiv preprint arXiv:2603.19591, 2026
Qiusheng Huang, Xiaohui Zhong, Anboyu Guo, Ziyi Peng, Lei Chen, and Hao Li. Data-driven ensemble prediction of the global ocean.arXiv preprint arXiv:2603.19591, 2026
-
[17]
Jaideep Pathak, Yair Cohen, Piyush Garg, Peter Harrington, Noah Brenowitz, Dale Durran, Morteza Mardani, Arash Vahdat, Shaoming Xu, Karthik Kashinath, et al. Kilometer-scale convection-allowing model emulation using generative diffusion modeling.Science Advances, 12(5):eadv0423, 2026
work page 2026
-
[18]
Diffusion-LAM: Prob- abilistic limited area weather forecasting with diffusion
Erik Larsson, Joel Oskarsson, Tomas Landelius, and Fredrik Lindsten. Diffusion-LAM: Prob- abilistic limited area weather forecasting with diffusion. InICLR 2025 Workshop on Tackling Climate Change with Machine Learning, 2025
work page 2025
-
[19]
Simon Lang, Mihai Alexe, Mariana CA Clare, Christopher Roberts, Rilwan Adewoyin, Zied Ben Bouallègue, Matthew Chantry, Jesper Dramsch, Peter D Dueben, Sara Hahner, et al. AIFS-CRPS: Ensemble forecasting using a model trained with a loss function based on the continuous ranked probability score.npj Artificial Intelligence, 2(1):18, 2026
work page 2026
-
[20]
Lorenzo Pacchiardi, Rilwan A Adewoyin, Peter Dueben, and Ritabrata Dutta. Probabilis- tic forecasting with generative networks via scoring rule minimization.Journal of Machine Learning Research, 25(45):1–64, 2024
work page 2024
-
[21]
arXiv, ://arxiv.org/abs/2507.12144, arXiv:2507.12144 [cs], doi:10.48550/arXiv.2507.12144
Boris Bonev, Thorsten Kurth, Ankur Mahesh, Mauro Bisson, Jean Kossaifi, Karthik Kashinath, Anima Anandkumar, William D Collins, Michael S Pritchard, and Alexander Keller. FourCast- Net 3: A geometric approach to probabilistic machine-learning weather forecasting at scale. arXiv preprint arXiv:2507.12144, 2025. 11
-
[22]
arXiv, ://arxiv.org/abs/2506.10772, arXiv:2506.10772 [cs], doi:10.48550/arXiv.2506.10772
Ferran Alet, Ilan Price, Andrew El-Kadi, Dominic Masters, Stratis Markou, Tom R Andersson, Jacklynn Stott, Remi Lam, Matthew Willson, Alvaro Sanchez-Gonzalez, et al. Skillful joint probabilistic weather forecasting from marginals.arXiv preprint arXiv:2506.10772, 2025
-
[23]
CRPS-LAM: Regional ensemble weather forecasting from matching marginals
Erik Larsson, Joel Oskarsson, Tomas Landelius, and Fredrik Lindsten. CRPS-LAM: Regional ensemble weather forecasting from matching marginals. InEurIPS 2025 Workshop on AI for Climate and Conservation, 2025
work page 2025
-
[24]
Even Marius Nordhagen, Håvard Homleid Haugen, Aram Farhad Shafiq Salihi, Magnus Sikora Ingstad, Thomas Nils Nipen, Ivar Ambjørn Seierstad, Inger-Lise Frogner, Mariana Clare, Si- mon Lang, Matthew Chantry, et al. High-resolution probabilistic data-driven weather modeling with a stretched-grid.arXiv preprint arXiv:2511.23043, 2025
-
[25]
Learning structured output representation using deep conditional generative models
Kihyuk Sohn, Honglak Lee, and Xinchen Yan. Learning structured output representation using deep conditional generative models. In C. Cortes, N. Lawrence, D. Lee, M. Sugiyama, and R. Garnett, editors,Advances in Neural Information Processing Systems, volume 28, 2015
work page 2015
-
[26]
AERIS: Argonne Earth systems model for reliable and skillful predictions
Väinö Hatanpää, Eugene Ku, Jason Stock, Murali Emani, Sam Foreman, Chunyong Jung, Sandeep Madireddy, Tung Nguyen, Varuni Sastry, Ray AO Sinurat, et al. AERIS: Argonne Earth systems model for reliable and skillful predictions. InProceedings of the International Conference for High Performance Computing, Networking, Storage and Analysis, pages 72– 85, 2025
work page 2025
-
[27]
To- wards diffusion models for large-scale sea-ice modelling
Tobias Sebastian Finn, Charlotte Durand, Alban Farchi, Marc Bocquet, and Julien Brajard. To- wards diffusion models for large-scale sea-ice modelling. InICML 2024 Workshop on Machine Learning for Earth System Modeling, 2024
work page 2024
-
[28]
Yuan Hu, Lei Chen, Zhibin Wang, and Hao Li. SwinVRNN: A data-driven ensemble fore- casting model via learned distribution perturbation.Journal of Advances in Modeling Earth Systems, 15(2), 2023
work page 2023
-
[29]
Interaction networks for learning about objects, relations and physics
Peter Battaglia, Razvan Pascanu, Matthew Lai, Danilo Jimenez Rezende, et al. Interaction networks for learning about objects, relations and physics. InAdvances in Neural Information Processing Systems, volume 29, 2016
work page 2016
-
[30]
Learning skillful medium-range global weather forecasting.Science, 382(6677):1416–1421, 2023
Remi Lam, Alvaro Sanchez-Gonzalez, Matthew Willson, Peter Wirnsberger, Meire Fortunato, Ferran Alet, Suman Ravuri, Timo Ewalds, Zach Eaton-Rosen, Weihua Hu, et al. Learning skillful medium-range global weather forecasting.Science, 382(6677):1416–1421, 2023
work page 2023
-
[31]
arXiv, ://arxiv.org/abs/2406.01465, doi:10.48550/arXiv.2406.01465
Simon Lang, Mihai Alexe, Matthew Chantry, Jesper Dramsch, Florian Pinault, Baudouin Raoult, Mariana CA Clare, Christian Lessig, Michael Maier-Gerber, Linus Magnusson, et al. AIFS–ECMWF’s data-driven forecasting system.arXiv preprint arXiv:2406.01465, 2024
-
[32]
Convolutional conditional neural processes
Jonathan Gordon, Wessel P Bruinsma, Andrew YK Foong, James Requeima, Yann Dubois, and Richard E Turner. Convolutional conditional neural processes. InInternational Conference on Learning Representations, 2020
work page 2020
-
[33]
A foundation model for the Earth system.Nature, 641(8065):1180–1187, 2025
Cristian Bodnar, Wessel P Bruinsma, Ana Lucic, Megan Stanley, Anna Allen, Johannes Brand- stetter, Patrick Garvan, Maik Riechert, Jonathan A Weyn, Haiyu Dong, et al. A foundation model for the Earth system.Nature, 641(8065):1180–1187, 2025
work page 2025
-
[34]
Andreas Griewank and Andrea Walther. Algorithm 799: Revolve: An implementation of checkpointing for the reverse or adjoint mode of computational differentiation.ACM Transac- tions on Mathematical Software, 26(1):19–45, 2000
work page 2000
-
[35]
Training Deep Nets with Sublinear Memory Cost
Tianqi Chen, Bing Xu, Chiyuan Zhang, and Carlos Guestrin. Training deep nets with sublinear memory cost.arXiv preprint arXiv:1604.06174, 2016
work page internal anchor Pith review Pith/arXiv arXiv 2016
-
[36]
Regional ocean forecasting with hierarchical graph neural networks
Daniel Holmberg, Emanuela Clementi, and Teemu Roos. Regional ocean forecasting with hierarchical graph neural networks. InNeurIPS 2024 Workshop on Tackling Climate Change with Machine Learning, 2024. 12
work page 2024
-
[37]
Simon Adamov, Joel Oskarsson, Leif Denby, Tomas Landelius, Kasper Hintz, Simon Chris- tiansen, Irene Schicker, Carlos Osuna, Fredrik Lindsten, Oliver Fuhrer, et al. Building machine learning limited area models: Kilometer-scale weather forecasting in realistic settings.arXiv preprint arXiv:2504.09340, 2025
-
[38]
Jean-Michel Lellouche, Eric Greiner, Romain Bourdallé-Badie, Gilles Garric, Angélique Melet, Marie Drévillon, Clément Bricaud, Mathieu Hamon, Olivier Le Galloudec, Charly Reg- nier, et al. The Copernicus global 1/12 oceanic and sea ice GLORYS12 reanalysis.Frontiers in Earth Science, 9:698876, 2021
work page 2021
-
[39]
Gurvan Madec and the NEMO team. NEMO ocean engine. Technical report, Institut Pierre- Simon Laplace, 2016
work page 2016
-
[40]
Hans Hersbach, Bill Bell, Paul Berrisford, Shoji Hirahara, András Horányi, Joaquín Muñoz- Sabater, Julien Nicolas, Carole Peubey, Raluca Radu, Dinand Schepers, et al. The ERA5 global reanalysis.Quarterly Journal of the Royal Meteorological Society, 146(730):1999–2049, 2020
work page 1999
-
[41]
ECMWF. Integrated forecasting system, 2024.https://www.ecmwf.int/en/forecasts/ documentation-and-support/changes-ecmwf-model
work page 2024
-
[42]
Copernicus Marine Service Information
E.U. Copernicus Marine Service Information. ODYSSEA global ocean - sea surface tempera- ture multi-sensor L3 observations, 2026. URLhttps://doi.org/10.48670/moi-00164
-
[43]
Graph-based neural weather predic- tion for limited area modeling
Joel Oskarsson, Tomas Landelius, and Fredrik Lindsten. Graph-based neural weather predic- tion for limited area modeling. InNeurIPS 2023 Workshop on Tackling Climate Change with Machine Learning, 2023
work page 2023
-
[44]
C. A. T. Ferro. Fair scores for ensemble forecasts.Quarterly Journal of the Royal Meteoro- logical Society, 140(683):1917–1923, 2014
work page 1917
-
[45]
Decoupled weight decay regularization
Ilya Loshchilov and Frank Hutter. Decoupled weight decay regularization. InInternational Conference on Learning Representations, 2019
work page 2019
-
[46]
Magneto-thermoelectric current induced by phonon drag in low-dimensional junctions
V . Fortin, M. Abaza, F. Anctil, and R. Turcotte. Why should ensemble spread match the RMSE of the ensemble mean?Journal of Hydrometeorology, 15(4):1708 – 1713, 2014. A Model Details A.1 Graph-EFM details We adopt the probabilistic framework of Graph-EFM [9], a latent variable model in which stochas- ticity is introduced through latent variablesZdefined o...
work page internal anchor Pith review Pith/arXiv arXiv doi:10.48670/moi-00021 2014
discussion (0)
Sign in with ORCID, Apple, or X to comment. Anyone can read and Pith papers without signing in.