M-SDT: A modelling framework for dengue transmission, forecasting, and intervention strategies in Ahmedabad Municipal Corporation
Pith reviewed 2026-05-20 00:34 UTC · model grok-4.3
The pith
A mechanistic model for dengue in Ahmedabad shows sustained residual spraying reduces incidence by over 80 percent while periodic fogging has cumulative yearly effects.
A machine-rendered reading of the paper's core claim, the machinery that carries it, and where it could break.
Core claim
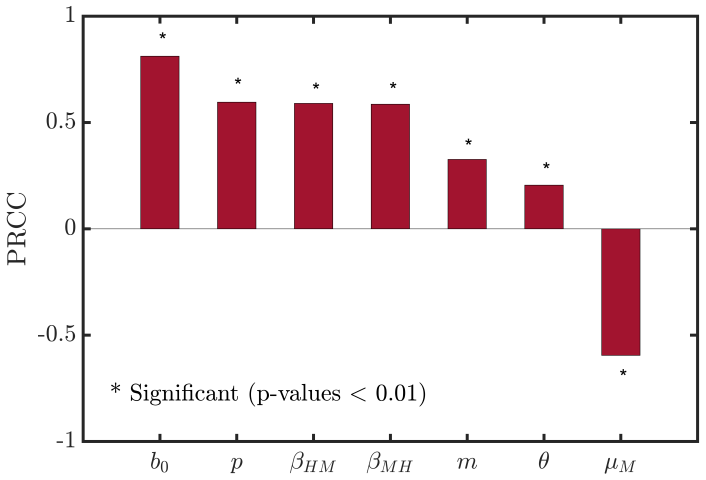
The M-SDT model, which incorporates both symptomatic and asymptomatic infections, when calibrated to zone-wise dengue case data from 2020-2024 using bootstrap sampling with negative binomial noise, reveals pronounced spatial heterogeneity across AMC zones with persistent hotspots. Forecasts for 2026-2028 indicate continued endemic circulation with moderate inter-annual variability. Sensitivity analysis identifies the mosquito biting rate and vector mortality as dominant drivers. Evaluating seasonal vector control strategies shows that periodic fogging has a cumulative effect over the years, while sustained residual spraying can quickly curb outbreaks and decrease incidence by over 80 percent
What carries the argument
The M-SDT model, a mechanistic seasonal dengue transmission compartmental framework that incorporates symptomatic and asymptomatic infections and is calibrated zone-wise with uncertainty quantification via bootstrap sampling.
Load-bearing premise
The transmission parameters fitted to 2020-2024 zone data including unobserved asymptomatic cases are assumed to remain unchanged for predicting dynamics and intervention responses in 2026-2028.
What would settle it
Collecting actual dengue incidence data in Ahmedabad zones during 2026-2028 and checking whether observed reductions from implemented spraying or fogging strategies match the model's predicted over-80-percent decrease or cumulative effects would test the claims.
Figures


read the original abstract
Dengue fever poses a persistent public health challenge in rapidly urbanizing Indian cities such as Ahmedabad, where spatial heterogeneity and seasonal variability complicate forecasting and control. In this study, we develop a data-driven compartmental framework to simulate transmission dynamics, generate forecasts, and evaluate intervention strategies across the Ahmedabad Municipal Corporation (AMC). We employ a Mechanistic Seasonal Dengue Transmission (M-SDT) model that incorporates symptomatic and asymptomatic infections. We calibrated the proposed model using zone-wise dengue case data during 2020--2024. Parameter uncertainty is rigorously quantified using a bootstrap sampling framework with negative binomial noise. The calibrated model reveals pronounced spatial heterogeneity across AMC zones, with persistent hotspots and distinct transmission regimes. Forecasts for 2026--2028 indicate continued endemic circulation with moderate inter-annual variability. Sensitivity analysis identifies the mosquito biting rate and vector mortality as dominant drivers of long-term disease burden, highlighting the central role of vector ecology in shaping epidemic outcomes. Evaluating seasonal vector control strategies shows a notable difference in operation; periodic fogging has a cumulative effect over the years, while sustained residual spraying can quickly curb outbreaks and decrease incidence by over 80%. The zone-wise analysis reveals that the mosquito-to-human ratio governs not only the baseline outbreak potential but also each zone's responsiveness to control strategies. Overall, the M-SDT modelling framework enables reconstruction of unobserved dynamics, rigorous uncertainty quantification, and evaluation of targeted, zone-specific interventions, underscoring the importance of integrating fine-scale surveillance data with mechanistic modelling for adaptive urban dengue control.
Editorial analysis
A structured set of objections, weighed in public.
Referee Report
Summary. The manuscript develops a Mechanistic Seasonal Dengue Transmission (M-SDT) compartmental model that includes symptomatic and asymptomatic infections to simulate dengue dynamics, produce forecasts, and assess interventions in Ahmedabad Municipal Corporation zones. The model is calibrated to zone-wise case reports from 2020–2024 via bootstrap sampling under negative-binomial noise; spatial heterogeneity is characterized, 2026–2028 forecasts are generated, sensitivity analysis identifies mosquito biting rate and vector mortality as dominant drivers, and seasonal vector-control scenarios are compared, with the claim that sustained residual spraying reduces incidence by more than 80 % while periodic fogging produces cumulative effects over years.
Significance. If the mappings from control measures to parameter shifts prove robust and the forecasts receive independent validation, the zone-specific framework could inform adaptive urban dengue management. The bootstrap uncertainty quantification and negative-binomial observation model are methodologically sound, yet the absence of held-out validation and external entomological constraints on intervention effects limits the strength of the quantitative efficacy claims.
major comments (2)
- [Intervention strategies section] Intervention evaluation: the reported >80 % incidence reduction under sustained residual spraying and the cumulative effect of periodic fogging depend on externally imposed, time-varying changes to biting rate, vector mortality, or mosquito-to-human ratio. No independent entomological data, coverage estimates, or resistance parameters are cited to justify these shifts; because the underlying parameters were fitted only to the 2020–2024 case series, the quantitative contrast between strategies remains an untested extrapolation rather than a model-derived prediction.
- [Forecasting and sensitivity analysis] Forecasting and calibration: 2026–2028 incidence projections and the ranking of biting rate and vector mortality as dominant drivers are obtained from parameters calibrated exclusively to the same 2020–2024 zone-wise data. Without explicit held-out validation, cross-validation, or comparison against independent surveillance, these long-term forecasts and sensitivity rankings constitute extrapolations whose reliability cannot be assessed from the calibration alone.
minor comments (1)
- [Abstract] The abstract states the model structure and claims but supplies neither governing equations nor a parameter table, making it difficult for readers to judge the precise mechanistic assumptions before reaching the results.
Simulated Author's Rebuttal
We thank the referee for the constructive comments, which help clarify the scope of our modeling results. We respond to each major comment below and indicate the revisions we will incorporate.
read point-by-point responses
-
Referee: [Intervention strategies section] Intervention evaluation: the reported >80 % incidence reduction under sustained residual spraying and the cumulative effect of periodic fogging depend on externally imposed, time-varying changes to biting rate, vector mortality, or mosquito-to-human ratio. No independent entomological data, coverage estimates, or resistance parameters are cited to justify these shifts; because the underlying parameters were fitted only to the 2020–2024 case series, the quantitative contrast between strategies remains an untested extrapolation rather than a model-derived prediction.
Authors: We agree that the intervention results are scenario-based extrapolations that rely on hypothesized shifts in vector parameters rather than direct empirical measurements of control efficacy. The M-SDT framework is designed to compare the relative performance of different strategies under explicit assumptions about their impact on biting rate, mortality, and mosquito density. We will revise the Intervention strategies section and the Discussion to (i) state these assumptions explicitly, (ii) note the absence of independent entomological or coverage data, and (iii) frame the >80 % reduction and cumulative fogging effects as illustrative contrasts that can inform the design of future field studies. Additional sensitivity analyses on the magnitude of the assumed parameter changes will also be added. revision: yes
-
Referee: [Forecasting and sensitivity analysis] Forecasting and calibration: 2026–2028 incidence projections and the ranking of biting rate and vector mortality as dominant drivers are obtained from parameters calibrated exclusively to the same 2020–2024 zone-wise data. Without explicit held-out validation, cross-validation, or comparison against independent surveillance, these long-term forecasts and sensitivity rankings constitute extrapolations whose reliability cannot be assessed from the calibration alone.
Authors: The referee is correct that both the 2026–2028 forecasts and the sensitivity rankings are derived solely from the 2020–2024 calibration. The bootstrap procedure quantifies uncertainty conditional on the fitted model and observation process, but does not provide out-of-sample validation. We will add a new Limitations subsection that (i) explicitly acknowledges the extrapolative nature of the forecasts, (ii) discusses the implications for long-term reliability, and (iii) outlines how future surveillance data could be used for validation. The sensitivity analysis will be reframed as identifying parameters whose improved empirical estimation would most reduce forecast uncertainty. revision: yes
- Independent entomological or coverage data to constrain intervention parameter shifts are not available to the authors.
- Held-out surveillance data beyond 2024 for formal validation of forecasts are not available to the authors.
Circularity Check
No significant circularity in derivation chain
full rationale
The M-SDT model is calibrated to 2020-2024 zone-wise case data with bootstrap uncertainty quantification, then applied to generate 2026-2028 forecasts and to simulate intervention effects via assumed changes to vector parameters such as biting rate and mortality. This is standard mechanistic modeling workflow with external assumptions for interventions; the forecasts and strategy comparisons are extrapolations from the fitted dynamics rather than tautological reductions to the calibration inputs by construction. No self-definitional steps, fitted-input-called-predictions, or load-bearing self-citations are evident in the abstract or described structure. The central claims remain independent of the input data once the model structure and intervention mappings are accepted.
Axiom & Free-Parameter Ledger
free parameters (2)
- mosquito biting rate
- vector mortality rate
axioms (1)
- domain assumption Dengue transmission can be represented by a compartmental model that includes both symptomatic and asymptomatic human infections and seasonal mosquito dynamics.
Lean theorems connected to this paper
-
IndisputableMonolith/Cost/FunctionalEquation.leanwashburn_uniqueness_aczel unclear?
unclearRelation between the paper passage and the cited Recognition theorem.
The full dynamical system ... dMS/dt = μM NM − λM MS − μM MS, ... with b(t) = b0 (1 + ab sin(2πt/365)) and intervention functions f(t), s(t) defined piecewise or with quadratic decay.
-
IndisputableMonolith/Foundation/RealityFromDistinction.leanreality_from_one_distinction unclear?
unclearRelation between the paper passage and the cited Recognition theorem.
Parameter estimation ... nonlinear least-squares ... bootstrap sampling framework with negative binomial noise ... m fixed at 3.098 from equilibrium.
What do these tags mean?
- matches
- The paper's claim is directly supported by a theorem in the formal canon.
- supports
- The theorem supports part of the paper's argument, but the paper may add assumptions or extra steps.
- extends
- The paper goes beyond the formal theorem; the theorem is a base layer rather than the whole result.
- uses
- The paper appears to rely on the theorem as machinery.
- contradicts
- The paper's claim conflicts with a theorem or certificate in the canon.
- unclear
- Pith found a possible connection, but the passage is too broad, indirect, or ambiguous to say the theorem truly supports the claim.
Reference graph
Works this paper leans on
-
[1]
Assessing the global dengue burden: Incidence, mortality, and disability trends over three decades
Zhang WX, Zhao TY, Wang CC, He Y, Lu HZ, Zhang HT, et al. Assessing the global dengue burden: Incidence, mortality, and disability trends over three decades. PLoS neglected tropical diseases. 2025;19(3):e0012932
work page 2025
-
[2]
Jing Q, Wang M. Dengue epidemiology. Global Health Journal. 2019;3(2):37–45
work page 2019
-
[3]
The global distribution and burden of dengue
Bhatt S, Gething PW, Brady OJ, Messina JP, Farlow AW, Moyes CL, et al. The global distribution and burden of dengue. Nature. 2013;496(7446):504–507
work page 2013
-
[4]
The global burden of dengue: an analysis from the Global Burden of Disease Study
Stanaway JD, Shepard DS, Undurraga EA, Halasa YA, Coffeng LE, Brady OJ, et al. The global burden of dengue: an analysis from the Global Burden of Disease Study
-
[5]
The Lancet Infectious Diseases. 2016;16(6):712–723. May 19, 2026 35/38
work page 2016
-
[6]
Gupta N, et al. Dengue in India. Indian Journal of Medical Research. 2012;136:373– 390
work page 2012
-
[7]
The global economic burden of dengue
Shepard DS, et al. The global economic burden of dengue. Lancet Infectious Diseases. 2016;16(8):935–941
work page 2016
-
[8]
Asymptomatic humans transmit dengue virus to mosquitoes
Duong V, et al. Asymptomatic humans transmit dengue virus to mosquitoes. Pro- ceedings of the National Academy of Sciences. 2015;112(47):14688–14693
work page 2015
-
[9]
Underrecognized mildly symptomatic viremic dengue virus infections in rural Thai schools
Yoon I, et al. Underrecognized mildly symptomatic viremic dengue virus infections in rural Thai schools. Journal of Infectious Diseases. 2012;206(3):389–398
work page 2012
-
[10]
Reservoir computing on epidemic spreading: A case study on COVID-19 cases
Ghosh S, Senapati A, Mishra A, Chattopadhyay J, Dana SK, Hens C, et al. Reservoir computing on epidemic spreading: A case study on COVID-19 cases. Physical Review E. 2021;104(1):014308
work page 2021
-
[11]
A model for dengue disease with variable human population
Esteva L, Vargas C. A model for dengue disease with variable human population. Journal of Mathematical Biology. 1998;38:220–240
work page 1998
-
[12]
The dynamics of dengue virus transmission
Ferguson N, et al. The dynamics of dengue virus transmission. Science. 1999;290:1764– 1767
work page 1999
-
[13]
Louren¸ co J, Recker M. Dengue in urban areas. Trends in Microbiology. 2014;22(9):487– 493
work page 2014
-
[14]
Temperature modulates dengue virus epidemic growth rates
Siraj AS, et al. Temperature modulates dengue virus epidemic growth rates. Nature Climate Change. 2017;7:309–314
work page 2017
-
[15]
Effect of active case finding on dengue control: Implications from a mathematical model
Ghosh I, Tiwari PK, Chattopadhyay J. Effect of active case finding on dengue control: Implications from a mathematical model. Journal of Theoretical Biology. 2019;464:50– 62
work page 2019
-
[16]
Mathematical models for dengue fever epidemiology: A 10-year systematic review
Aguiar M, Anam V, Blyuss KB, Estadilla CDS, Guerrero BV, Knopoff D, et al. Mathematical models for dengue fever epidemiology: A 10-year systematic review. Physics of Life Reviews. 2022;40:65–92
work page 2022
-
[17]
The role of human movement in the transmission of vector-borne pathogens
Stoddard ST, Morrison AC, Vazquez-Prokopec GM, Paz Soldan V, Kochel TJ, Kitron U, et al. The role of human movement in the transmission of vector-borne pathogens. PLoS Neglected Tropical Diseases. 2009;3(7):e481
work page 2009
-
[18]
Impact of human mobility on the emergence of dengue epidemics in Pakistan
Wesolowski A, Qureshi T, Boni MF, Sundsøy PR, Johansson MA, Rasheed SB, et al. Impact of human mobility on the emergence of dengue epidemics in Pakistan. Proceedings of the National Academy of Sciences. 2015;112(38):11887–11892
work page 2015
-
[19]
Quantifying the epidemiological impact of vector control on dengue
Reiner Jr RC, Achee N, Barrera R, Burkot TR, Chadee DD, Devine GJ, et al. Quantifying the epidemiological impact of vector control on dengue. PLoS Neglected Tropical Diseases. 2016;10(5):e0004588
work page 2016
-
[20]
Senapati A, Sardar T, Ganguly KS, Ganguly KS, Chattopadhyay AK, Chattopadhyay J. Impact of adult mosquito control on dengue prevalence in a multi-patch setting: A case study in Kolkata (2014–2015). Journal of Theoretical Biology. 2019;478:139–152
work page 2014
-
[21]
Real-time influenza forecasts during the 2012–2013 season
Shaman J, Karspeck A, Yang W, Tamerius J, Lipsitch M. Real-time influenza forecasts during the 2012–2013 season. Nature Communications. 2013;4(1):2837
work page 2012
-
[22]
Funk S, Camacho A, Kucharski AJ, Lowe R, Eggo RM, Edmunds WJ. Assessing the performance of real-time epidemic forecasts: A case study of Ebola in the Western Area region of Sierra Leone, 2014-15. PLoS Computational Biology. 2019;15(2):e1006785. May 19, 2026 36/38
work page 2014
-
[23]
Mathematical modeling of dengue disease transmission dynamics
Kumar R, Saxena B, Shrivastava R, Bhardwaj R. Mathematical modeling of dengue disease transmission dynamics. Indian Journal of Science and Technology. 2024;17(39):4101–4110
work page 2024
-
[24]
Ross, Macdonald, and a theory for the dynamics and control of mosquito-transmitted pathogens
Smith DL, Battle KE, Hay SI, Barker CM, Scott TW, McKenzie FE. Ross, Macdonald, and a theory for the dynamics and control of mosquito-transmitted pathogens. PLoS Pathogens. 2012;8(4):e1002588
work page 2012
-
[25]
Chowell G. Fitting dynamic models to epidemic outbreaks with quantified uncertainty: A primer for parameter uncertainty, identifiability, and forecasts. Infectious Disease Modelling. 2017;2(3):379–398
work page 2017
-
[26]
Estimation of reproduction number and non stationary spectral analysis of dengue epidemic
Enduri MK, Jolad S. Estimation of reproduction number and non stationary spectral analysis of dengue epidemic. Mathematical Biosciences. 2017;288:140–148
work page 2017
-
[27]
The seasonal pattern of dengue in endemic areas: mathematical models of mechanisms
Hartley L, Donnelly C, Garnett G. The seasonal pattern of dengue in endemic areas: mathematical models of mechanisms. Transactions of the royal society of tropical medicine and hygiene. 2002;96(4):387–397
work page 2002
-
[28]
Annual Statistical Report on Births and Deaths, 1972: Gujarat
of India RG. Annual Statistical Report on Births and Deaths, 1972: Gujarat. Gandhi- nagar, India: Government of Gujarat; 1972
work page 1972
-
[29]
Mod- elling the dynamics of dengue real epidemics
Pinho STRd, Ferreira CP, Esteva L, Barreto FR, Morato e Silva V, Teixeira M. Mod- elling the dynamics of dengue real epidemics. Philosophical Transactions of the Royal Society A: Mathematical, Physical and Engineering Sciences. 2010;368(1933):5679– 5693
work page 2010
-
[30]
Hamdan N, Kilicman A. The development of a deterministic dengue epidemic model with the influence of temperature: a case study in Malaysia. Applied Mathematical Modelling. 2021;90:547–567
work page 2021
-
[31]
Economic and disease burden of dengue illness in India
Shepard DS, Halasa YA, Tyagi BK, Adhish SV, Nandan D, Karthiga K, et al. Economic and disease burden of dengue illness in India. The American Journal of Tropical Medicine and Hygiene. 2014;91(6):1235
work page 2014
-
[32]
Immune correlates of protection for dengue: state of the art and research agenda
Katzelnick LC, Harris E, Baric R, Coller BA, Coloma J, Crowe Jr JE, et al. Immune correlates of protection for dengue: state of the art and research agenda. Vaccine. 2017;35(36):4659–4669
work page 2017
-
[33]
A mathematical model of dengue transmission with memory
Sardar T, Rana S, Chattopadhyay J. A mathematical model of dengue transmission with memory. Communications in Nonlinear Science and Numerical Simulation. 2015;22(1-3):511–525
work page 2015
-
[34]
The biting rate of Aedes aegypti and its variability: A systematic review (1970–2022)
Zahid MH, Van Wyk H, Morrison AC, Coloma J, Lee GO, Cevallos V, et al. The biting rate of Aedes aegypti and its variability: A systematic review (1970–2022). PLoS Neglected Tropical Diseases. 2023;17(8):e0010831
work page 1970
-
[35]
Newton E, Reiter P. A model of the transmission of dengue fever with an evaluation of the impact of ultra-low volume (ULV) insecticide applications on dengue epidemics. The American Journal of Tropical Medicine and Hygiene. 1992;47(6):709–720
work page 1992
-
[36]
Contributions from the silent majority dominate dengue virus transmission
Ten Bosch QA, Clapham HE, Lambrechts L, Duong V, Buchy P, Althouse BM, et al. Contributions from the silent majority dominate dengue virus transmission. PLoS Pathogens. 2018;14(5):e1006965
work page 2018
-
[37]
Use of expansion factors to estimate the burden of dengue in Southeast Asia: a systematic analysis
Undurraga EA, Halasa YA, Shepard DS. Use of expansion factors to estimate the burden of dengue in Southeast Asia: a systematic analysis. PLoS Neglected Tropical Diseases. 2013;7(2):e2056. May 19, 2026 37/38
work page 2013
-
[38]
Impediments of reporting dengue cases in India
Das S, Sarfraz A, Jaiswal N, Das P. Impediments of reporting dengue cases in India. Journal of Infection and Public Health. 2017;10(5):494–498
work page 2017
-
[39]
A methodology for performing global uncertainty and sensitivity analysis in systems biology
Marino S, Hogue IB, Ray CJ, Kirschner DE. A methodology for performing global uncertainty and sensitivity analysis in systems biology. Journal of Theoretical Biology. 2008;254(1):178–196
work page 2008
-
[40]
A new fetal rat model of gastroschisis: development and early characterization
Correia-Pinto J, Tavares ML, Baptista MJ, Estev˜ ao-Costa J, Flake AW, Leite-Moreira AF. A new fetal rat model of gastroschisis: development and early characterization. Journal of pediatric surgery. 2001;36(1):213–216
work page 2001
-
[41]
Salje H, Lessler J, Maljkovic Berry I, Melendrez MC, Endy T, Kalayanarooj S, et al. Dengue diversity across spatial and temporal scales: Local structure and the effect of host population size. Science. 2017;355(6331):1302–1306
work page 2017
-
[42]
Scott TW, Morrison AC. Vector dynamics and transmission of dengue virus: implica- tions for dengue surveillance and prevention strategies: vector dynamics and dengue prevention. Dengue Virus. 2009; p. 115–128
work page 2009
-
[43]
Spatio-temporal eco-evolutionary dynamics of prey-predator systems with defended and undefended prey
Roy S, Byrne HM, Banerjee J, Sasmal SK, Dutta S, Ghosh D. Spatio-temporal eco-evolutionary dynamics of prey-predator systems with defended and undefended prey. Communications Physics. 2025;9(1):2399–3650
work page 2025
-
[44]
Estimating the size and structure of the underground commercial sex economy in eight major US cities
Dank ML, Khan B, Downey PM, Kotonias C, Mayer D, Owens C, et al. Estimating the size and structure of the underground commercial sex economy in eight major US cities. Urban Institute Washington, DC; 2 014. May 19, 2026 38/38
work page 2026
discussion (0)
Sign in with ORCID, Apple, or X to comment. Anyone can read and Pith papers without signing in.