Latitudinal variations in Neptune's temperature profile observed with ALMA
Pith reviewed 2026-05-20 01:43 UTC · model grok-4.3
The pith
ALMA observations of Neptune reveal a cold 45 K layer at the southern pole around 300-600 mbar that vanishes at mid-latitudes and the equator.
A machine-rendered reading of the paper's core claim, the machinery that carries it, and where it could break.
Core claim
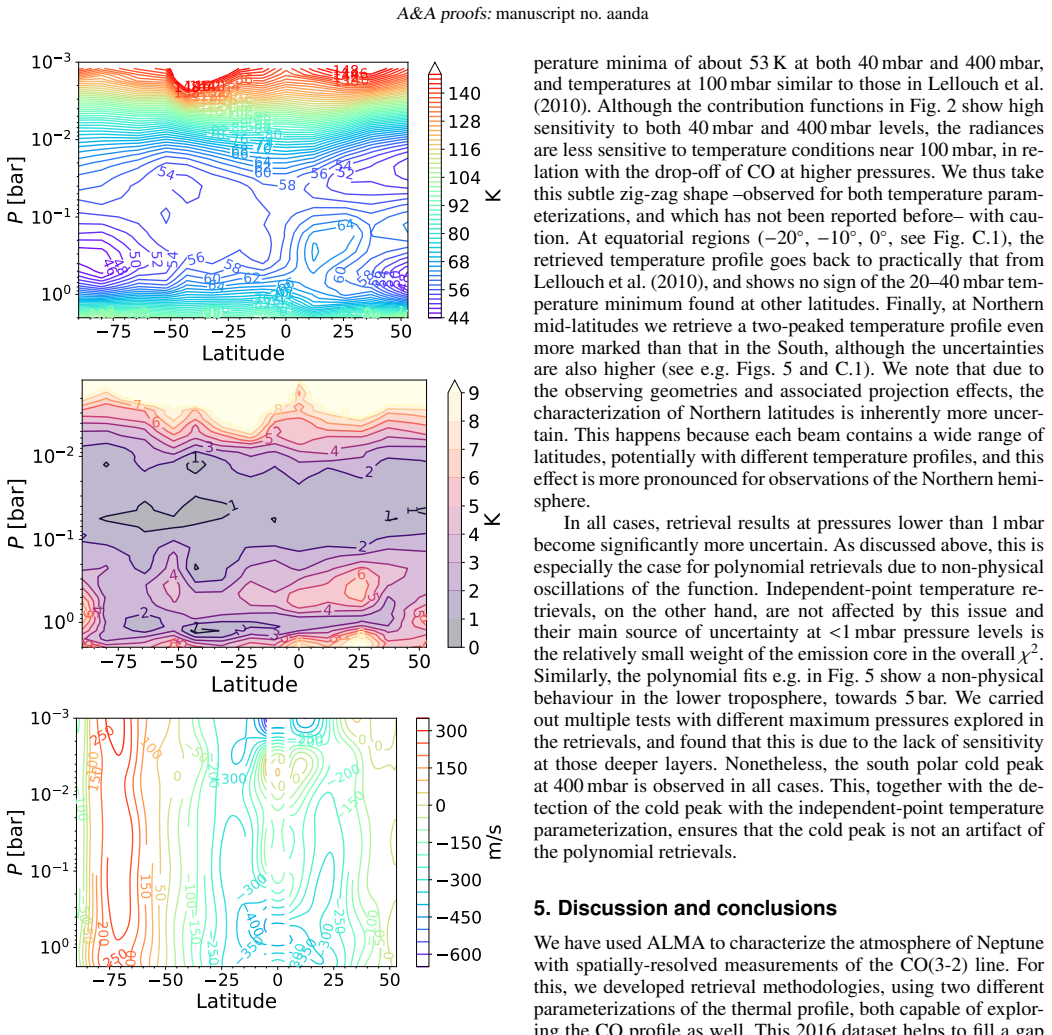
Temperature retrievals performed on spatially resolved ALMA CO(3-2) spectra while treating CO as spatially constant show a cold layer of about 45 K at southern polar latitudes (-80°) between 300 and 600 mbar; this feature disappears toward mid-latitudes and the equator. At 10-100 mbar the retrieved structure is consistent with Voyager 2, displaying colder mid-latitudes and warmer equator and south polar regions. The observations probe the 2 bar to 0.1 mbar range and indicate that CO retrievals with a fixed temperature profile fail to fit the data, confirming the presence of real temperature variations.
What carries the argument
MCMC retrieval of temperature profiles from the CO(3-2) spectral line at 345.796 GHz under the assumption of spatially constant CO abundance.
If this is right
- The upper troposphere of Neptune contains latitudinal temperature contrasts that are not captured by earlier disk-integrated or infrared observations.
- Submillimeter spectroscopy can reach pressure levels between roughly 300 and 600 mbar that are difficult for other remote-sensing techniques.
- The retrieved CO vertical distribution supports a stratospheric enhancement by a factor of two to three relative to the troposphere.
- Similar latitudinal thermal structures may be present on Uranus if observed at comparable spatial resolution and wavelength.
Where Pith is reading between the lines
- Repeated ALMA observations at other CO transitions could test whether the cold polar feature persists or varies with time.
- The temperature contrast at depth may help drive the strong zonal winds observed in Neptune's atmosphere.
- Models of ice-giant circulation should now incorporate a latitude-dependent cold trap near 400 mbar at high southern latitudes.
Load-bearing premise
That CO abundance remains the same at all latitudes when the temperature profiles are retrieved from the spatially resolved spectra.
What would settle it
Independent temperature measurements at 300-600 mbar from another instrument that resolves Neptune's southern polar region and either confirms or rules out a 45 K layer there.
Figures


read the original abstract
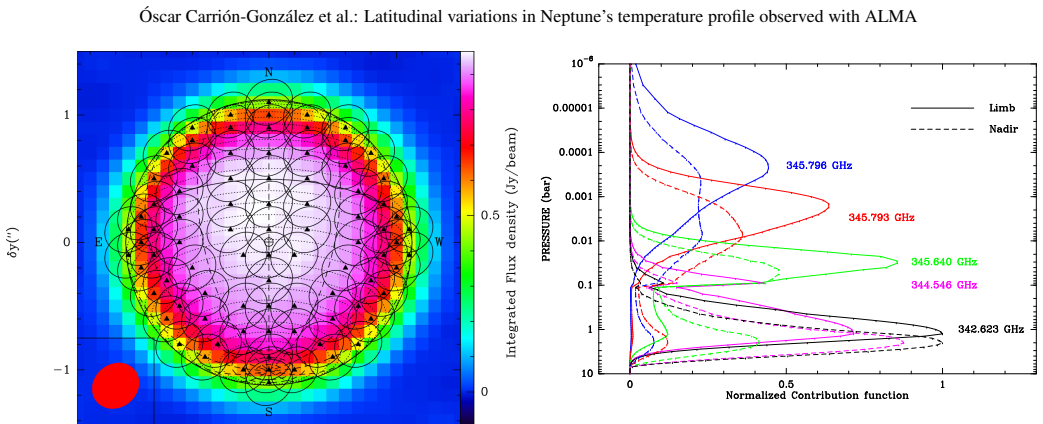
Despite the low solar irradiation it receives, Neptune shows a very active atmosphere with some of the most intense dynamics observed in Solar System atmospheres. Characterizing the atmospheric temperature profiles of the planet is a key to understand these observed processes. In this work, we derived the Neptune pressure-latitude thermal field, using 2016 ALMA measurements of the CO(3-2) spectral line at 345.796 GHz, with a spatial resolution of about 0.37" on Neptune's 2.24" disk. To analyse the data, we developed MCMC retrieval methods to derive both the temperature profiles and the CO abundance profile. We find that our data probes the upper troposphere and the lower stratosphere of the planet, between 2 bar and 0.1 mbar. Although temperature and CO profile are strongly correlated, simultaneous retrievals of both parameters for disk-integrated observations reveal a factor of 2-3 larger CO abundance in the stratosphere than in the troposphere, reinforcing the hypothesis of CO delivery by a recent cometary impact. CO retrievals with fixed temperature profile do not fit the spatially-resolved observations, implying underlying temperature variations. By performing temperature retrievals with spatially constant CO, we find distinct trends of the thermal profile between the southern polar region, mid-latitudes and the equator. At 10--100 mbar, this structure is consistent with that observed by Voyager 2 in 1989, i.e. colder mid-latitudes, with a warmer equator and south polar regions. At 300-600 mbar, however, we find a cold layer of about 45 K at Southern polar regions (-80{\deg}) which disappears towards mid-latitudes and the equator. By probing pressure levels not easily accessible to other observing methods e.g. infrared sounding, submillimeter observations offer a new view of the complex thermal structure in the upper troposphere and lower stratosphere of the Icy Giants.
Editorial analysis
A structured set of objections, weighed in public.
Referee Report
Summary. The paper analyzes 2016 ALMA observations of the CO(3-2) line at 345.796 GHz on Neptune (spatial resolution ~0.37 arcsec on a 2.24 arcsec disk) to derive the pressure-latitude thermal field between ~2 bar and 0.1 mbar. MCMC retrievals are used to simultaneously fit temperature and CO profiles from disk-integrated spectra, revealing a factor of 2-3 higher stratospheric CO abundance consistent with recent cometary delivery. Spatially-resolved spectra cannot be fit with CO retrievals under a fixed temperature profile, leading to temperature retrievals performed under the assumption of spatially constant CO. These yield distinct latitudinal trends: at 10-100 mbar the structure matches Voyager 2 (colder mid-latitudes, warmer equator and south pole), while at 300-600 mbar a ~45 K cold layer appears at southern polar latitudes (-80°) that is absent at mid-latitudes and the equator.
Significance. If robust, the results offer new constraints on Neptune's upper-tropospheric and lower-stratospheric thermal structure at pressures difficult to access with infrared methods, with implications for atmospheric dynamics on the ice giants. The MCMC framework, explicit acknowledgment of the T-CO degeneracy, and direct comparison to Voyager 2 data are positive elements that strengthen the analysis.
major comments (2)
- [Retrieval Methods and Results sections] The central claim of distinct latitudinal temperature trends (including the ~45 K cold layer at 300-600 mbar in the southern polar region) rests on temperature retrievals performed with the assumption of spatially constant CO. However, the manuscript itself states that temperature and CO are strongly correlated and that CO retrievals with fixed temperature fail to fit the spatially-resolved spectra. Because the line intensity depends on the product of abundance and temperature-dependent line strength, any unmodeled latitudinal CO gradient would be absorbed into the retrieved temperature profile, directly affecting the reported pole-to-equator differences. A quantitative test (e.g., retrievals allowing limited CO latitudinal variation or synthetic-data validation of the degeneracy) is required to establish that the thermal structure is not an artifact of the constant-CO assumption.
- [Results] The abstract and results describe the 45 K cold layer at southern polar latitudes but provide no quantitative uncertainties, posterior distributions, or goodness-of-fit metrics for the retrieved profiles at 300-600 mbar. Without these, it is difficult to assess whether the feature is statistically significant relative to the data noise and model assumptions.
minor comments (2)
- [Observations] The spatial resolution is given as ~0.37 arcsec on a 2.24 arcsec disk; a brief statement on the number of independent spatial elements or beam sampling would help readers evaluate the latitudinal binning.
- [Analysis] The pressure range probed (2 bar to 0.1 mbar) is stated, but a short note on the contribution functions or weighting functions for the CO(3-2) line at the relevant pressures would clarify the vertical resolution.
Simulated Author's Rebuttal
We thank the referee for their careful and constructive review of our manuscript. We address each major comment below and have revised the paper to strengthen the analysis of the retrieval assumptions and the reporting of uncertainties.
read point-by-point responses
-
Referee: The central claim of distinct latitudinal temperature trends (including the ~45 K cold layer at 300-600 mbar in the southern polar region) rests on temperature retrievals performed with the assumption of spatially constant CO. However, the manuscript itself states that temperature and CO are strongly correlated and that CO retrievals with fixed temperature fail to fit the spatially-resolved spectra. Because the line intensity depends on the product of abundance and temperature-dependent line strength, any unmodeled latitudinal CO gradient would be absorbed into the retrieved temperature profile, directly affecting the reported pole-to-equator differences. A quantitative test (e.g., retrievals allowing limited CO latitudinal variation or synthetic-data validation of the degeneracy) is required to establish that the thermal structure is not an artifact of the constant-CO assumption.
Authors: We thank the referee for this important comment on the potential impact of the constant-CO assumption. The manuscript explicitly discusses the strong correlation between temperature and CO, and demonstrates that CO retrievals under fixed temperature do not fit the data, which supports the presence of temperature variations. To provide the quantitative validation requested, we will add to the revised manuscript synthetic data tests that simulate possible latitudinal CO variations and assess their effect on retrieved temperatures under the constant-CO assumption. We believe this will confirm that the reported latitudinal trends are reliable. revision: yes
-
Referee: The abstract and results describe the 45 K cold layer at southern polar latitudes but provide no quantitative uncertainties, posterior distributions, or goodness-of-fit metrics for the retrieved profiles at 300-600 mbar. Without these, it is difficult to assess whether the feature is statistically significant relative to the data noise and model assumptions.
Authors: We agree that quantitative uncertainties and fit metrics are needed to evaluate the significance of the retrieved cold layer. In the revised manuscript we will add posterior distributions from the MCMC chains for temperature at 300-600 mbar across latitudes, along with 1-sigma uncertainties and reduced chi-squared values for the fits to the spatially resolved spectra in the southern polar, mid-latitude, and equatorial regions. revision: yes
Circularity Check
No significant circularity; retrievals are data-driven from ALMA spectra with external validation
full rationale
The paper's core derivation uses MCMC retrievals applied directly to 2016 ALMA CO(3-2) spectral line observations to map temperature profiles under a spatially constant CO assumption. This assumption is justified by the explicit statement that CO retrievals with fixed temperature profiles fail to fit the spatially-resolved data, implying the need for temperature variations. Results at 10-100 mbar are cross-checked against independent Voyager 2 measurements from 1989, and the disk-integrated CO enhancement is presented as reinforcing an external cometary impact hypothesis rather than deriving from self-referential fits. No load-bearing step reduces by construction to prior self-citations, fitted inputs renamed as predictions, or definitional equivalence; the latitudinal thermal trends are outputs constrained by the observational spectra.
Axiom & Free-Parameter Ledger
free parameters (2)
- CO abundance profile parameters
- Temperature profile parameters per latitude bin
axioms (1)
- domain assumption The CO(3-2) line at 345.796 GHz forms in the 2 bar to 0.1 mbar range and its emission is sensitive to both kinetic temperature and CO mixing ratio.
Lean theorems connected to this paper
-
IndisputableMonolith/Cost/FunctionalEquation.leanwashburn_uniqueness_aczel unclear?
unclearRelation between the paper passage and the cited Recognition theorem.
By performing temperature retrievals with spatially constant CO, we find distinct trends of the thermal profile between the southern polar region, mid-latitudes and the equator. At 300-600 mbar, this structure includes a cold layer of about 45 K at Southern polar regions (-80°) which disappears towards mid-latitudes and the equator.
-
IndisputableMonolith/Foundation/RealityFromDistinction.leanreality_from_one_distinction unclear?
unclearRelation between the paper passage and the cited Recognition theorem.
We used the radiative transfer code from Moreno et al. (2017). It takes as input both the local (beam-averaged) temperature profile and the vertical distribution of the relevant chemical species.
What do these tags mean?
- matches
- The paper's claim is directly supported by a theorem in the formal canon.
- supports
- The theorem supports part of the paper's argument, but the paper may add assumptions or extra steps.
- extends
- The paper goes beyond the formal theorem; the theorem is a base layer rather than the whole result.
- uses
- The paper appears to rely on the theorem as machinery.
- contradicts
- The paper's claim conflicts with a theorem or certificate in the canon.
- unclear
- Pith found a possible connection, but the passage is too broad, indirect, or ambiguous to say the theorem truly supports the claim.
Reference graph
Works this paper leans on
- [1]
-
[2]
B \'e zard , B., Romani , P. N., Conrath , B. J., & Maguire , W. C. 1991, , 96, 18961
work page 1991
-
[3]
N., Feuchtgruber , H., & Encrenaz , T
B \'e zard , B., Romani , P. N., Feuchtgruber , H., & Encrenaz , T. 1999, , 515, 868
work page 1999
-
[4]
Bolton , S. J., Levin , S. M., Guillot , T., et al. 2021, Science, 374, 968
work page 2021
- [5]
-
[6]
Carri \'o n-Gonz \'a lez , \'O ., Moreno , R., Lellouch , E., et al. 2023, , 674, L3
work page 2023
-
[7]
Cavali \'e , T., Moreno , R., Lellouch , E., et al. 2014, , 562, A33
work page 2014
-
[8]
Cl \'e ment , N., Leconte , J., Spiga , A., et al. 2024, , 690, A227
work page 2024
-
[9]
Conrath , B., Flasar , F. M., Hanel , R., et al. 1989, Science, 246, 1454
work page 1989
-
[10]
Conrath , B. J., Gierasch , P. J., & Ustinov , E. A. 1998, , 135, 501
work page 1998
-
[11]
de Pater , I., Fletcher , L. N., Luszcz-Cook , S., et al. 2014, , 237, 211
work page 2014
-
[12]
Encrenaz , T., Lellouch , E., Drossart , P., et al. 2004, The Messenger, 115, 35
work page 2004
-
[13]
Fletcher , L. N., de Pater , I., Orton , G. S., et al. 2014, , 231, 146
work page 2014
-
[14]
Fletcher , L. N., de Pater , I., Orton , G. S., et al. 2020, , 216, 21
work page 2020
-
[15]
N., Drossart , P., Burgdorf , M., Orton , G
Fletcher , L. N., Drossart , P., Burgdorf , M., Orton , G. S., & Encrenaz , T. 2010, , 514, A17
work page 2010
-
[16]
Fletcher , L. N., Orton , G. S., Teanby , N. A., & Irwin , P. G. J. 2009, , 202, 543
work page 2009
-
[17]
Foreman-Mackey , D., Hogg , D. W., Lang , D., & Goodman , J. 2013, , 125, 306
work page 2013
-
[18]
Goodman , J. & Weare , J. 2010, Communications in Applied Mathematics and Computational Science, 5, 65
work page 2010
-
[19]
Hammel , H. B., Beebe , R. F., de Jong , E. M., et al. 1989, Science, 245, 1367
work page 1989
-
[20]
Hammel , H. B. & Lockwood , G. W. 2007, , 186, 291
work page 2007
-
[21]
Hesman , B. E., Davis , G. R., Matthews , H. E., & Orton , G. S. 2007, , 186, 342
work page 2007
-
[22]
H \"o gbom , J. A. 1974, , 15, 417
work page 1974
- [23]
-
[24]
2020, Philosophical Transactions of the Royal Society of London Series A, 378, 20190476
Hueso , R., Guillot , T., & S \'a nchez-Lavega , A. 2020, Philosophical Transactions of the Royal Society of London Series A, 378, 20190476
work page 2020
- [25]
-
[26]
Iino , T., Sagawa , H., Tsukagoshi , T., & Nozawa , S. 2020, , 903, L1
work page 2020
- [27]
-
[28]
Irwin , P. G. J., Fletcher , L. N., Tice , D., et al. 2016, , 271, 418
work page 2016
- [29]
-
[30]
Kaspi , Y., Showman , A. P., Hubbard , W. B., Aharonson , O., & Helled , R. 2013, , 497, 344
work page 2013
-
[31]
Lellouch , E., Hartogh , P., Feuchtgruber , H., et al. 2010, , 518, L152
work page 2010
- [32]
- [33]
- [34]
-
[35]
Lindal , G. F. 1992, , 103, 967
work page 1992
-
[36]
Lockwood , G. W. & Jerzykiewicz , M. 2006, , 180, 442
work page 2006
-
[37]
Luszcz-Cook , S. H. & de Pater , I. 2013, , 222, 379
work page 2013
-
[38]
H., de Pater , I., & Wright , M
Luszcz-Cook , S. H., de Pater , I., & Wright , M. 2013, , 226, 437
work page 2013
-
[39]
Marcus , P. S., Tollefson , J., Wong , M. H., & Pater , I. d. 2019, , 324, 198
work page 2019
- [40]
-
[41]
Milcareck , G., Guerlet , S., Montmessin , F., et al. 2024, , 686, A303
work page 2024
-
[42]
Moreno , R., Lellouch , E., Cavali \'e , T., & Moullet , A. 2017, , 608, L5
work page 2017
-
[43]
Mousis , O., Atkinson , D. H., Cavali \'e , T., et al. 2018, , 155, 12
work page 2018
-
[44]
S., Encrenaz , T., Leyrat , C., Puetter , R., & Friedson , A
Orton , G. S., Encrenaz , T., Leyrat , C., Puetter , R., & Friedson , A. J. 2007, , 473, L5
work page 2007
- [45]
- [46]
-
[47]
Roman , M. T., Fletcher , L. N., Orton , G. S., et al. 2022, PSJ, 3, 78
work page 2022
-
[48]
N., Bishop , J., Bezard , B., & Atreya , S
Romani , P. N., Bishop , J., Bezard , B., & Atreya , S. 1993, , 106, 442
work page 1993
- [49]
-
[50]
Smith , B. A., Soderblom , L. A., Banfield , D., et al. 1989, Science, 246, 1422
work page 1989
-
[51]
Sromovsky , L. A., Fry , P. M., Dowling , T. E., Baines , K. H., & Limaye , S. S. 2001 a , , 150, 244
work page 2001
-
[52]
Sromovsky , L. A., Fry , P. M., Dowling , T. E., Baines , K. H., & Limaye , S. S. 2001 b , , 150, 244
work page 2001
-
[53]
Sromovsky , L. A., Fry , P. M., Limaye , S. S., & Baines , K. H. 2003, , 163, 256
work page 2003
- [54]
-
[55]
Suomi , V. E., Limaye , S. S., & Johnson , D. R. 1991, Science, 251, 929
work page 1991
- [56]
-
[57]
Tollefson , J., de Pater , I., Luszcz-Cook , S., & DeBoer , D. 2019, , 157, 251
work page 2019
- [58]
- [59]
-
[60]
Wong , M. H., Sromovsky , L. A., Fry , P. M., et al. 2022, , 387, 115123
work page 2022
-
[61]
Wong , M. H., Tollefson , J., Hsu , A. I., et al. 2018, , 155, 117
work page 2018
-
[62]
, year = 2018, month = sep, volume =
Vertical wind shear in Neptune's upper atmosphere explained with a modified thermal wind equation. , year = 2018, month = sep, volume =. doi:10.1016/j.icarus.2018.04.009 , adsurl =
-
[63]
emcee: The MCMC Hammer. , keywords =. doi:10.1086/670067 , archivePrefix =. 1202.3665 , primaryClass =
work page internal anchor Pith review Pith/arXiv arXiv doi:10.1086/670067
-
[64]
First submillimeter observation of CO in the stratosphere of Uranus
The first submillimeter observation of CO in the stratosphere of Uranus. , keywords =. doi:10.1051/0004-6361/201322297 , archivePrefix =. 1311.2458 , primaryClass =
work page internal anchor Pith review Pith/arXiv arXiv doi:10.1051/0004-6361/201322297
-
[65]
First Absolute Wind Measurements in the Middle Atmosphere of Mars. , keywords =. doi:10.1086/170797 , adsurl =
-
[66]
Planetary atmospheres with ALMA. , keywords =. doi:10.1007/s10509-007-9637-y , adsurl =
-
[67]
An intense thermospheric jet on Titan
An intense thermospheric jet on Titan. Nature Astronomy , keywords =. doi:10.1038/s41550-019-0749-4 , archivePrefix =. 1903.12116 , primaryClass =
work page internal anchor Pith review Pith/arXiv arXiv doi:10.1038/s41550-019-0749-4 1903
-
[68]
Interferometric measurements of zonal winds on Titan. , keywords =. doi:10.1051/0004-6361:20042117 , adsurl =
-
[69]
, year = 2009, month = jun, volume =
Wind measurements in Mars' middle atmosphere: IRAM Plateau de Bure interferometric CO observations. , year = 2009, month = jun, volume =. doi:10.1016/j.icarus.2009.01.027 , adsurl =
-
[70]
Detection of CS in Neptune's atmosphere from ALMA observations. , keywords =. doi:10.1051/0004-6361/201731472 , adsurl =
-
[71]
, year = 2014, month = jul, volume =
Neptune s global circulation deduced from multi-wavelength observations. , year = 2014, month = jul, volume =. doi:10.1016/j.icarus.2014.02.030 , adsurl =
-
[72]
, year = 1993, month = sep, volume =
Dynamics of Neptune's Major Cloud Features. , year = 1993, month = sep, volume =. doi:10.1006/icar.1993.1114 , adsurl =
-
[73]
Winds of Neptune: Voyager observations of cloud motions. , keywords =. doi:10.1029/91JA01701 , adsurl =
-
[74]
Neptune's Wind Speeds Obtained by Tracking Clouds in Voyager Images. Science , keywords =. doi:10.1126/science.245.4924.1367 , adsurl =
-
[75]
Voyager 2 at Neptune: Imaging Science Results. Science , keywords =. doi:10.1126/science.246.4936.1422 , adsurl =
-
[76]
High Winds of Neptune: A Possible Mechanism. Science , keywords =. doi:10.1126/science.251.4996.929 , adsurl =
-
[77]
Communications in Applied Mathematics and Computational Science , keywords =
Ensemble samplers with affine invariance. Communications in Applied Mathematics and Computational Science , keywords =. doi:10.2140/camcos.2010.5.65 , adsurl =
-
[78]
Press, William H. and Teukolsky, Saul A. and Vetterling, William T. and Flannery, Brian P. , title =. 2007 , isbn =
work page 2007
-
[79]
Dispersion in Neptune's Zonal Wind Velocities from NIR Keck AO Observations in July 2009
Dispersion in Neptune's zonal wind velocities from NIR Keck AO observations in July 2009. , keywords =. doi:10.1007/s10509-013-1737-2 , archivePrefix =. 1312.2676 , primaryClass =
work page internal anchor Pith review Pith/arXiv arXiv doi:10.1007/s10509-013-1737-2 2009
-
[80]
Neptune's zonal winds from near-IR Keck adaptive optics imaging in August 2001. , keywords =. doi:10.1007/s10509-011-0847-y , adsurl =
discussion (0)
Sign in with ORCID, Apple, or X to comment. Anyone can read and Pith papers without signing in.