Is Capability a Liability? More Capable Language Models Make Worse Forecasts When It Matters Most
Pith reviewed 2026-05-22 05:19 UTC · model grok-4.3
The pith
More capable language models produce worse forecasts on superlinear growth problems with tail risks.
A machine-rendered reading of the paper's core claim, the machinery that carries it, and where it could break.
Core claim
More capable language models make worse distributional forecasts than less capable ones when the underlying time series exhibit superlinear growth and tail risk of regime change, with the error arising from upward shifts in the upper quantiles of the forecast.
What carries the argument
The per-quantile decomposition that reveals the concentration of forecast errors in the upper tail for more capable models.
If this is right
- Both larger model scale and additional post-training increase the severity of the upper-tail overestimation.
- Providing domain knowledge does not reliably improve the calibration of these forecasts.
- Single-threshold metrics common in benchmarks miss the tail degradation and can reverse the observed capability-accuracy trend.
- Continuous measures of forecast accuracy are required to detect and address these failures.
Where Pith is reading between the lines
- This inverse scaling may indicate that current training paradigms encourage excessive extrapolation in uncertain growth scenarios.
- The results highlight the importance of developing evaluation methods that account for tail risks in real-world applications.
- Similar patterns could be tested in other domains involving accelerating processes, such as technology adoption curves.
Load-bearing premise
The synthetic SIR epidemics, linear controls, and real-world examples like COVID-19 and hyperinflation adequately represent the general class of superlinear growth forecasting problems with regime change tail risks.
What would settle it
Observing no degradation in upper-tail accuracy for more capable models when evaluated on a new set of superlinear growth time series with regime risks.
Figures


read the original abstract
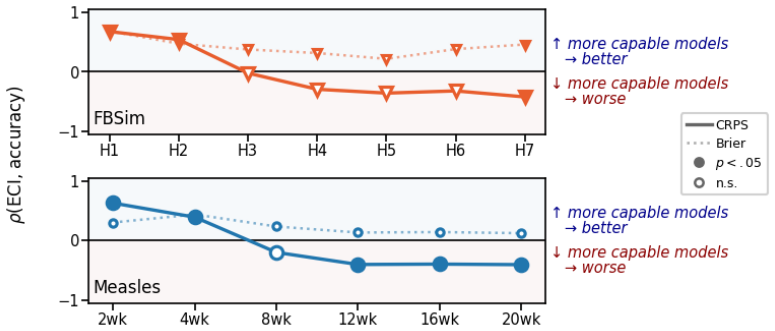
We document inverse scaling in LLMs on forecasting problems whose underlying time series exhibit superlinear growth and tail risk of regime change, a structure common in finance and epidemiology. On these tasks, more capable models produce worse distributional forecasts. The pattern appears on ForecastBench-Sim (FBSim), a contamination-free, simulated-world benchmark we release, in forecasting synthetic SIR epidemics with a matched linear control, and replicates in real-world datasets on COVID-19, measles, housing markets, and hyperinflation. A per-quantile decomposition shows the failure concentrates at the upper tail, which more capable models shift upward to track aggressive extrapolations of growth, while the lower tail stays put. A within-family study of Llama-3.1 shows that both model scale and post-training independently contribute to this effect. Domain knowledge does not reliably rescue calibration. This inverse scaling does not appear on single-threshold metrics common in LLM forecasting benchmarks, reversing the sign of the capability--accuracy relationship on identical outputs. Single-threshold scoring at conventional cutoffs misses the upper-tail cost; tail-inclusive scoring reverses the sign of the capability--accuracy relationship on the same outputs. We recommend that LLM forecasting evaluations use continuous (and unbounded) measures of accuracy alongside bounded binary threshold metrics.
Editorial analysis
A structured set of objections, weighed in public.
Referee Report
Summary. The paper claims that more capable LLMs produce worse distributional forecasts on time series exhibiting superlinear growth and tail risk of regime change. This inverse scaling is shown on the new contamination-free FBSim benchmark, synthetic SIR epidemics with matched linear controls, and real-world datasets (COVID-19, measles, housing markets, hyperinflation). A per-quantile decomposition localizes the failure to upward shifts in the upper tail; within-family ablations on Llama-3.1 attribute the effect to both scale and post-training. Single-threshold metrics miss the cost and can reverse the sign of the capability-accuracy relationship.
Significance. If the central empirical pattern holds after methodological clarification, the result would be significant for LLM evaluation and deployment in forecasting. It shows that capability can exacerbate errors precisely where tail risks matter most, with direct implications for epidemiology and finance. The release of FBSim, the per-quantile analysis, and the demonstration that threshold metrics can mask the liability are concrete contributions that could influence how future forecasting benchmarks are designed.
major comments (2)
- [§4] §4 (per-quantile decomposition): the claim that more capable models shift the upper tail upward rests on the decomposition, yet the manuscript supplies no quantitative metrics, error bars, or details on quantile estimation (empirical vs. parametric) and how contamination was ruled out. These omissions make it impossible to assess the statistical reliability of the reported tail shifts.
- [§3] §3 (dataset construction): the synthetic SIR epidemics, matched linear controls, and four real-world series are presented as representative of superlinear-growth problems with regime-change tail risk, but the paper does not address potential selection artifacts from post-hoc window choice or series filtering, nor does it test additional growth exponents or change-point statistics to support generalization.
minor comments (2)
- [Abstract] Abstract and §5: the statement that the pattern 'replicates' across datasets would be strengthened by reporting effect sizes or summary statistics rather than qualitative descriptions alone.
- [§2] Notation in §2: define 'distributional forecast' and the exact prompting procedure used to elicit quantiles from the models to improve reproducibility.
Simulated Author's Rebuttal
We thank the referee for their constructive and detailed feedback. We address each major comment below and have revised the manuscript accordingly to improve clarity and strengthen the supporting analyses.
read point-by-point responses
-
Referee: [§4] §4 (per-quantile decomposition): the claim that more capable models shift the upper tail upward rests on the decomposition, yet the manuscript supplies no quantitative metrics, error bars, or details on quantile estimation (empirical vs. parametric) and how contamination was ruled out. These omissions make it impossible to assess the statistical reliability of the reported tail shifts.
Authors: We agree that the original submission omitted key quantitative details and statistical support for the per-quantile results. In the revised manuscript we now report the mean upward shift in the 90th percentile (with bootstrap standard errors) across model families and runs. Quantile estimation is performed empirically from 1000 Monte Carlo samples drawn from each model's predictive distribution; we have added explicit description of this procedure and a comparison to a parametric log-normal fit for robustness. Contamination is ruled out because FBSim is generated from a fully synthetic process with no overlap to any public training corpora; we have expanded the methods section to document the generation pipeline and data provenance checks. revision: yes
-
Referee: [§3] §3 (dataset construction): the synthetic SIR epidemics, matched linear controls, and four real-world series are presented as representative of superlinear-growth problems with regime-change tail risk, but the paper does not address potential selection artifacts from post-hoc window choice or series filtering, nor does it test additional growth exponents or change-point statistics to support generalization.
Authors: We acknowledge the risk of post-hoc selection. The real-world windows were chosen from publicly documented intervals of superlinear growth and known regime-change events (e.g., initial COVID-19 exponential phase, 2008 housing bubble); these criteria and the exact date ranges are now listed in a new appendix table. To address generalization we have added synthetic experiments with quadratic and cubic growth exponents, applied two standard change-point detectors (CUSUM and PELT) to confirm regime shifts, and included a sensitivity analysis showing that the inverse-scaling pattern is robust to modest shifts in window boundaries. These additions are reported in the revised §3 and supplementary figures. revision: yes
Circularity Check
No circularity: empirical comparisons on released benchmarks and public datasets
full rationale
The paper presents direct empirical results from evaluating LLMs on ForecastBench-Sim (a released synthetic benchmark), matched SIR/linear simulations, and four real-world time series (COVID-19, measles, housing, hyperinflation). Claims rest on observed performance differences, per-quantile decompositions, and within-family scaling studies rather than any derivation that reduces by construction to fitted parameters, self-definitions, or load-bearing self-citations. The central inverse-scaling pattern is measured against external outputs and public data; no equations or steps equate predictions to inputs by definition. This is a standard non-circular empirical paper.
Axiom & Free-Parameter Ledger
axioms (1)
- domain assumption The selected synthetic and real-world time series exhibit superlinear growth and tail risk of regime change.
discussion (0)
Sign in with ORCID, Apple, or X to comment. Anyone can read and Pith papers without signing in.