Gas Fraction and Depletion Time Drive the Main-Sequence Scatter in Massive Galaxies at zsim1.5
Pith reviewed 2026-05-25 03:38 UTC · model grok-4.3
The pith
Both molecular gas content and star formation efficiency scale as the square root of the offset from the main sequence, driving its scatter equally in massive galaxies at z~1.5.
A machine-rendered reading of the paper's core claim, the machinery that carries it, and where it could break.
Core claim
Across the main sequence, both molecular gas mass ratio and star formation efficiency scale approximately as (sSFR/sSFR_MS)^0.5, indicating that the MS scatter is driven nearly equally by variations in gas content and depletion time. The intrinsic scatter of 0.19 dex suggests additional galaxy-to-galaxy diversity in star formation efficiency. The integrated Schmidt-Kennicutt relation remains consistent with measurements from z=0 to z=2.
What carries the argument
Metallicity-dependent gas-to-dust ratios derived from individual galaxy metallicity measurements, used to convert ALMA Band 7 dust continuum fluxes into molecular gas masses for a homogeneous sample near the main sequence.
If this is right
- The fundamental regulation of star formation through coupled modulation of gas supply and efficiency is already operating at z~1.5.
- The 0.19 dex intrinsic scatter points to additional galaxy-to-galaxy diversity in star formation efficiency beyond the two primary drivers.
- The unified gas scaling framework holds in the massive regime at cosmic noon, with gas reservoirs more than an order of magnitude larger than local galaxies at fixed stellar mass.
- The Schmidt-Kennicutt relation remains unchanged in slope and normalization over the redshift range 0 to 2 for these systems.
Where Pith is reading between the lines
- If the square-root scaling persists to higher redshifts, models of galaxy evolution would need to treat gas accretion and depletion time as comparably important regulators rather than prioritizing one.
- The result implies that feedback processes or accretion histories must modulate both gas content and efficiency in tandem to produce the observed main-sequence width.
- Extending the same ALMA-plus-metallicity method to lower-mass galaxies at the same epoch could test whether the equal split between gas fraction and depletion time holds across the full mass range.
Load-bearing premise
Metallicity-dependent gas-to-dust ratios estimated from individual measurements accurately convert dust continuum detections into molecular gas masses without significant systematic bias.
What would settle it
An independent molecular gas mass measurement, such as from CO line emission in the same galaxies, that yields a different power-law index than 0.5 for either gas ratio or efficiency versus sSFR offset would falsify the equal-contribution claim.
Figures



read the original abstract
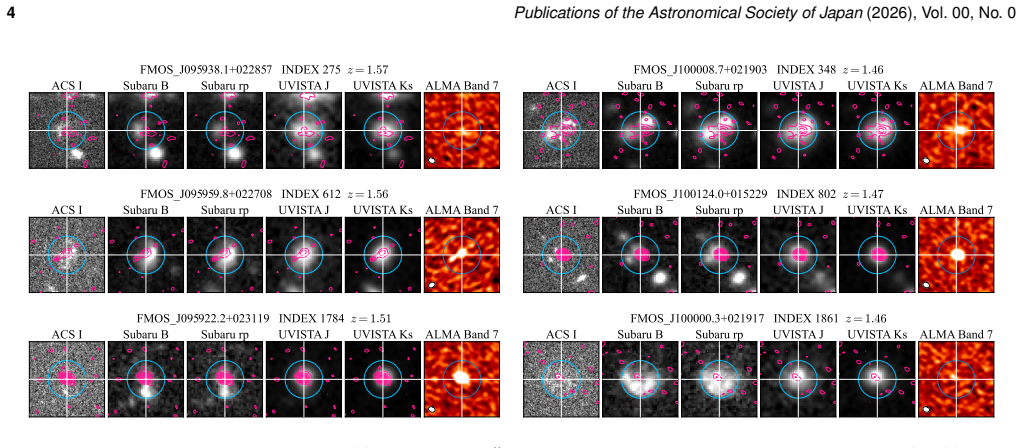
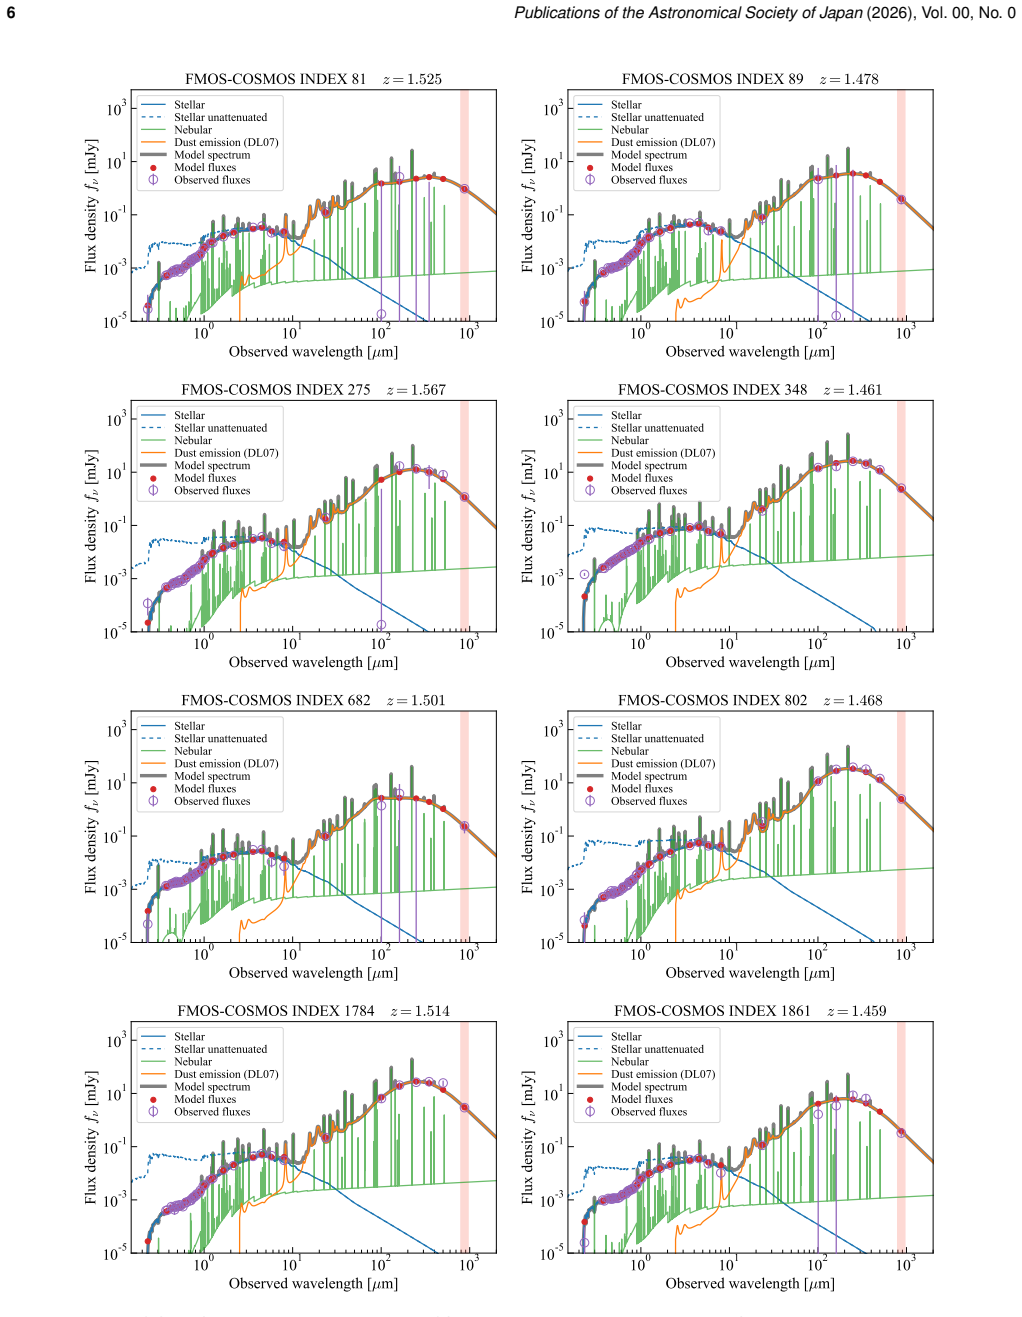
We present ALMA Band 7 dust continuum observations of 57 massive ($M_\ast \gtrsim 10^{10.8}~M_\odot$) star-forming galaxies at $1.45<z<1.70$, selected from the FMOS-COSMOS survey to provide a homogeneous sample near the main sequence (MS) at cosmic noon. The observations are sufficiently deep to yield $>3\sigma$ detections for 55 galaxies. Combining the ALMA data with multiwavelength photometry, we reliably derive dust masses and infer molecular gas masses using metallicity-dependent gas-to-dust ratios estimated from individual metallicity measurements. The derived molecular gas mass ratio spans $\mu_\mathrm{gas} = M_\mathrm{gas}/M_\ast=0.11\text{--}2.8$, with a median value of 0.65, corresponding to gas reservoirs more than an order of magnitude larger than in local galaxies at fixed stellar mass. The integrated Schmidt--Kennicutt relation is consistent with previous measurements over $z=0\text{--}2$. Across the MS, both molecular gas mass ratio and star formation efficiency scale approximately as $(\mathrm{sSFR}/\mathrm{sSFR}_\mathrm{MS})^{0.5}$, indicating that the MS scatter is driven nearly equally by variations in gas content and depletion time. The intrinsic scatter of $0.19$~dex suggests additional galaxy-to-galaxy diversity in star formation efficiency. Our results provide a controlled test of the unified gas scaling framework in the massive regime at $z\sim1.5$, demonstrating that the fundamental regulation of star formation through coupled modulation of gas supply and efficiency is already in place at cosmic noon.
Editorial analysis
A structured set of objections, weighed in public.
Referee Report
Summary. The manuscript presents ALMA Band 7 dust continuum observations of 57 massive (M* ≳ 10^10.8 M⊙) star-forming galaxies at 1.45 < z < 1.70 selected from FMOS-COSMOS to lie near the main sequence. Dust masses are derived from the continuum and converted to molecular gas masses via metallicity-dependent gas-to-dust ratios using individual metallicity measurements, yielding μ_gas = 0.11–2.8 (median 0.65). The authors report that both μ_gas and star-formation efficiency scale approximately as (sSFR/sSFR_MS)^0.5 across the MS, implying that scatter is driven nearly equally by gas content and depletion time, with an intrinsic scatter of 0.19 dex.
Significance. If the GDR(Z) conversions hold without significant residual systematics correlated with sSFR offset, the result supplies a homogeneous, high-S/N test of the unified gas-regulation framework specifically in the massive-galaxy regime at cosmic noon. The equal-contribution finding would be a useful benchmark for simulations and analytic models of MS scatter.
major comments (3)
- [Abstract / §4] Abstract and §4 (results on scaling): the central claim that gas content and depletion time contribute 'nearly equally' rests on both quantities scaling as (sSFR/sSFR_MS)^0.5. The text states the exponent is 'approximately' 0.5 but provides no details on whether this is a free fit, a fixed value, the fitting method (e.g., orthogonal regression, MCMC), or the propagated uncertainties from the GDR conversion; without this, it is impossible to assess whether the two scalings are statistically indistinguishable.
- [§3] §3 (gas-mass derivation): μ_gas is obtained from ALMA dust continuum via metallicity-dependent GDRs using individual Z measurements. The manuscript must demonstrate that any residual calibration uncertainty or Z–sSFR correlation (known to exist in z∼1.5 samples) does not systematically tilt the reported μ_gas vs. sSFR/sSFR_MS relation; otherwise the equal-driving conclusion is not robust.
- [§4] §4 (integrated SK relation and scatter): the claim of 0.19 dex intrinsic scatter is used to argue for additional galaxy-to-galaxy diversity in SFE. The error budget on this number (including systematic floor from the GDR step) is not shown; if the GDR uncertainty is comparable to or larger than 0.19 dex, the diversity interpretation is weakened.
minor comments (2)
- [§2] The sample size is stated as 57 galaxies with 55 >3σ detections; clarify in the text whether the two non-detections are included in any of the scaling fits or only in the median statistics.
- [Figures] Figure captions and axis labels should explicitly note that the x-axis is normalized sSFR/sSFR_MS rather than raw sSFR to avoid reader confusion with local samples.
Simulated Author's Rebuttal
We thank the referee for their constructive comments, which have identified areas where additional methodological details and robustness checks will strengthen the manuscript. We respond to each major comment below and indicate the planned revisions.
read point-by-point responses
-
Referee: [Abstract / §4] Abstract and §4 (results on scaling): the central claim that gas content and depletion time contribute 'nearly equally' rests on both quantities scaling as (sSFR/sSFR_MS)^0.5. The text states the exponent is 'approximately' 0.5 but provides no details on whether this is a free fit, a fixed value, the fitting method (e.g., orthogonal regression, MCMC), or the propagated uncertainties from the GDR conversion; without this, it is impossible to assess whether the two scalings are statistically indistinguishable.
Authors: We agree that the fitting details are needed for transparency. In the revised manuscript we will add to §4 a description of the procedure: the exponents were obtained as free parameters via orthogonal distance regression implemented with MCMC, with uncertainties in both axes and full propagation of GDR conversion errors via Monte Carlo resampling of the metallicities. The resulting exponents for μ_gas and SFE are statistically consistent with 0.5, supporting the equal-contribution statement. We will also reference this analysis in the abstract. revision: yes
-
Referee: [§3] §3 (gas-mass derivation): μ_gas is obtained from ALMA dust continuum via metallicity-dependent GDRs using individual Z measurements. The manuscript must demonstrate that any residual calibration uncertainty or Z–sSFR correlation (known to exist in z∼1.5 samples) does not systematically tilt the reported μ_gas vs. sSFR/sSFR_MS relation; otherwise the equal-driving conclusion is not robust.
Authors: We acknowledge the need for this explicit check. Because individual metallicities are used, the known Z–sSFR correlation is already incorporated galaxy-by-galaxy. In the revision we will add to §3 (or an appendix) a residual analysis of the μ_gas–ΔsSFR relation after subtracting the expected Z dependence, confirming that no significant additional tilt remains. This will be presented as a robustness test. revision: partial
-
Referee: [§4] §4 (integrated SK relation and scatter): the claim of 0.19 dex intrinsic scatter is used to argue for additional galaxy-to-galaxy diversity in SFE. The error budget on this number (including systematic floor from the GDR step) is not shown; if the GDR uncertainty is comparable to or larger than 0.19 dex, the diversity interpretation is weakened.
Authors: We agree the error budget should be shown explicitly. In the revised §4 we will include a breakdown (table or text) of the observed scatter contributions, with the GDR systematic floor quantified from the metallicity uncertainties. After subtracting measurement and systematic terms in quadrature, the remaining intrinsic scatter is 0.19 dex, preserving the interpretation of additional SFE diversity. revision: yes
Circularity Check
No circularity: observational scalings derived directly from independent ALMA and multiwavelength data
full rationale
The paper reports ALMA Band 7 continuum detections for 55 galaxies, derives dust masses from photometry, converts to molecular gas masses via metallicity-dependent GDRs using individual Z measurements, and measures the reported μ_gas and SFE scalings with sSFR/sSFR_MS directly from the sample. No equations, fitted parameters, or self-citations are shown to reduce these scalings to the inputs by construction. The derivation chain is self-contained against external benchmarks and does not invoke uniqueness theorems or ansatzes from prior author work as load-bearing premises.
Axiom & Free-Parameter Ledger
axioms (1)
- domain assumption Metallicity-dependent gas-to-dust ratios estimated from individual metallicity measurements accurately infer molecular gas masses from dust continuum observations.
Lean theorems connected to this paper
-
IndisputableMonolith/Cost/FunctionalEquation.leanwashburn_uniqueness_aczel unclear?
unclearRelation between the paper passage and the cited Recognition theorem.
Across the MS, both molecular gas mass ratio and star formation efficiency scale approximately as (sSFR/sSFR_MS)^0.5
-
IndisputableMonolith/Foundation/RealityFromDistinction.leanreality_from_one_distinction unclear?
unclearRelation between the paper passage and the cited Recognition theorem.
infer molecular gas masses using metallicity-dependent gas-to-dust ratios estimated from individual metallicity measurements
What do these tags mean?
- matches
- The paper's claim is directly supported by a theorem in the formal canon.
- supports
- The theorem supports part of the paper's argument, but the paper may add assumptions or extra steps.
- extends
- The paper goes beyond the formal theorem; the theorem is a base layer rather than the whole result.
- uses
- The paper appears to rely on the theorem as machinery.
- contradicts
- The paper's claim conflicts with a theorem or certificate in the canon.
- unclear
- Pith found a possible connection, but the passage is too broad, indirect, or ambiguous to say the theorem truly supports the claim.
Reference graph
Works this paper leans on
-
[1]
Aravena, M., Boogaard, L., Gónzalez-López, J., et al. 2020. ApJ, 901, 79 Béthermin, M., Daddi, E., Magdis, G., et al. 2015. A&A, 573, A113
work page 2020
-
[2]
Boquien, M., Burgarella, D., Roehlly, Y ., et al. 2019. A&A, 622, A103
work page 2019
-
[3]
Bruzual, G., & Charlot, S. 2003. MNRAS, 344, 1000–1028
work page 2003
- [4]
-
[5]
Casey, C. M., Kartaltepe, J. S., Drakos, N. E., et al. 2023. ApJ, 954, 31
work page 2023
-
[6]
Chabrier, G. 2003. PASP, 115, 763–795
work page 2003
-
[7]
Civano, F., Marchesi, S., Comastri, A., et al. 2016. ApJ, 819, 62
work page 2016
-
[8]
Daddi, E., Dickinson, M., Morrison, G., et al. 2007. ApJ, 670, 156–172
work page 2007
-
[9]
Dale, D. A., Helou, G., Magdis, G. E., et al. 2014. ApJ, 784, 83 Davé, R., Finlator, K., & Oppenheimer, B. D. 2012. MNRAS, 421, 98–107
work page 2014
- [10]
-
[11]
T., Aniano, G., Krause, O., et al
Draine, B. T., Aniano, G., Krause, O., et al. 2014. ApJ, 780, 172 Förster Schreiber, N. M., & Wuyts, S. 2020. ARA&A, 58, 661–725 12Publications of the Astronomical Society of Japan(2026), Vol. 00, No. 0 Table 3.Input parameters of the SED fitting withCIGALE Parameter Values delayed+burst SFH e-folding time of the delayed SFH,τ 0 [Myr] 1000, 2000, 3000 Age...
work page 2014
- [12]
- [13]
- [14]
-
[15]
A., da Cunha, E., Kendrew, S., et al
Hodge, J. A., da Cunha, E., Kendrew, S., et al. 2025. ApJ, 978, 165
work page 2025
-
[16]
Jacobs, C., Glazebrook, K., Calabrò, A., et al. 2023. ApJL, 948, L13
work page 2023
-
[17]
Jin, S., Daddi, E., Liu, D., et al. 2018. ApJ, 864, 56
work page 2018
-
[18]
Kalita, B. S., Silverman, J. D., Daddi, E., et al. 2024. ApJ, 960, 25
work page 2024
-
[19]
Kartaltepe, J. S., Sanders, D. B., Silverman, J. D., et al. 2015. ApJL, 806, L35
work page 2015
-
[20]
Kashino, D., Silverman, J. D., Sanders, D., et al. 2017. ApJ, 835, 88
work page 2017
-
[21]
Kashino, D., Silverman, J. D., Sanders, D., et al. 2019. ApJS, 241, 10
work page 2019
- [22]
-
[23]
Kimura, M., Maihara, T., Iwamuro, F., et al. 2010. PASJ, 62, 1135–1147
work page 2010
-
[24]
M., Aussel, H., Calzetti, D., et al
Koekemoer, A. M., Aussel, H., Calzetti, D., et al. 2007. ApJS, 172, 196–202
work page 2007
-
[25]
H., Calzetti, D., & Heckman, T
Leitherer, C., Li, I. H., Calzetti, D., & Heckman, T. M. 2002. ApJS, 140, 303–329
work page 2002
-
[26]
K., Bolatto, A., Gordon, K., et al
Leroy, A. K., Bolatto, A., Gordon, K., et al. 2011. ApJ, 737, 12
work page 2011
-
[27]
Lilly, S. J., Carollo, C. M., Pipino, A., Renzini, A., & Peng, Y . 2013. ApJ, 772, 119
work page 2013
- [28]
-
[29]
Lutz, D., Poglitsch, A., Altieri, B., et al. 2011. A&A, 532, A90
work page 2011
-
[30]
Magnelli, B., Lutz, D., Saintonge, A., et al. 2014. A&A, 561, A86
work page 2014
-
[31]
Marino, R. A., Rosales-Ortega, F. F., Sánchez, S. F., et al. 2013. A&A, 559, A114
work page 2013
-
[32]
J., Milvang-Jensen, B., Dunlop, J., et al
McCracken, H. J., Milvang-Jensen, B., Dunlop, J., et al. 2012. A&A, 544, A156
work page 2012
-
[33]
Morselli, L., Renzini, A., Enia, A., & Rodighiero, G. 2021. MNRAS, 502, L85–L89
work page 2021
-
[34]
Noeske, K. G., Weiner, B. J., Faber, S. M., et al. 2007. ApJL, 660, L43–L46
work page 2007
-
[35]
Peng, Y .-j., & Maiolino, R. 2014. MNRAS, 438, 262–270
work page 2014
-
[36]
Pettini, M., & Pagel, B. E. J. 2004. MNRAS, 348, L59–L63 Planck Collaboration, Aghanim, N., Akrami, Y ., et al. 2020. A&A, 641, A6
work page 2004
-
[37]
Popesso, P., Concas, A., Cresci, G., et al. 2023. MNRAS, 519, 1526–1544
work page 2023
-
[38]
Puglisi, A., Daddi, E., Liu, D., et al. 2019. ApJL, 877, L23
work page 2019
-
[39]
Puglisi, A., Daddi, E., Valentino, F., et al. 2021. MNRAS, 508, 5217–5238 Rémy-Ruyer, A., Madden, S. C., Galliano, F., et al. 2015. A&A, 582, A121
work page 2021
-
[40]
Rodighiero, G., Daddi, E., Baronchelli, I., et al. 2011. ApJL, 739, L40
work page 2011
-
[41]
Rujopakarn, W., Williams, C. C., Daddi, E., et al. 2023. ApJL, 948, L8
work page 2023
-
[42]
Saintonge, A., & Catinella, B. 2022. ARA&A, 60, 319–361
work page 2022
- [43]
-
[44]
Santini, P., Maiolino, R., Magnelli, B., et al. 2014. A&A, 562, A30
work page 2014
-
[45]
T., Béthermin, M., Daddi, E., & Elbaz, D
Sargent, M. T., Béthermin, M., Daddi, E., & Elbaz, D. 2012. ApJL, 747, L31
work page 2012
-
[46]
T., Daddi, E., Béthermin, M., et al
Sargent, M. T., Daddi, E., Béthermin, M., et al. 2014. ApJ, 793, 19
work page 2014
-
[47]
Schreiber, C., Elbaz, D., Pannella, M., et al. 2018. A&A, 609, A30
work page 2018
-
[48]
Scoville, N., Aussel, H., Brusa, M., et al. 2007. ApJS, 172, 1–8
work page 2007
-
[49]
Scoville, N., Sheth, K., Aussel, H., et al. 2016. ApJ, 820, 83
work page 2016
-
[50]
Shivaei, I., Popping, G., Rieke, G., et al. 2022. ApJ, 928, 68
work page 2022
-
[51]
Speagle, J. S., Steinhardt, C. L., Capak, P. L., & Silverman, J. D. 2014. ApJS, 214, 15
work page 2014
-
[52]
J., Neri, R., Genzel, R., et al
Tacconi, L. J., Neri, R., Genzel, R., et al. 2013. ApJ, 768, 74
work page 2013
-
[53]
J., Genzel, R., Saintonge, A., et al
Tacconi, L. J., Genzel, R., Saintonge, A., et al. 2018. ApJ, 853, 179
work page 2018
-
[54]
J., Genzel, R., & Sternberg, A
Tacconi, L. J., Genzel, R., & Sternberg, A. 2020. ARA&A, 58, 157–203
work page 2020
-
[55]
Tadaki, K.-i., Belli, S., Burkert, A., et al. 2020. ApJ, 901, 74
work page 2020
-
[56]
Weaver, J. R., Kauffmann, O. B., Ilbert, O., et al. 2022. ApJS, 258, 11
work page 2022
-
[57]
E., Franx, M., Leja, J., et al
Whitaker, K. E., Franx, M., Leja, J., et al. 2014. ApJ, 795, 104
work page 2014
-
[58]
Zahid, H. J., Kashino, D., Silverman, J. D., et al. 2014. ApJ, 792, 75
work page 2014
discussion (0)
Sign in with ORCID, Apple, or X to comment. Anyone can read and Pith papers without signing in.