Precipitation diffusion downscaling and application to out-of-distribution simulations with and without stratospheric aerosol injection
Pith reviewed 2026-05-25 02:21 UTC · model grok-4.3
The pith
A diffusion downscaler applied to CESM2 runs indicates stratospheric aerosol injection nearly halves the CONUS-average rise in yearly maximum precipitation.
A machine-rendered reading of the paper's core claim, the machinery that carries it, and where it could break.
Core claim
Diffusion-downscaled projections of the future CESM2 SAI scenarios suggest that SAI could nearly cut in half the CONUS-average increase in yearly max precipitation, compared to the non-SAI scenario, while faithfully recreating climate-change signals in extreme precipitation when tested on the original training data.
What carries the argument
The diffusion downscaler, a deep learning model trained to generate contiguous 0.25° daily precipitation fields over the CONUS from coarser climate-model inputs.
If this is right
- The diffusion model produces realistic precipitation fields from CESM2 inputs even though it was trained only on MESACLIP data.
- The downscaler preserves the sign and magnitude of projected changes in extreme precipitation from the parent simulations.
- SAI reduces most of the projected intensification of yearly maximum precipitation across much of the CONUS but only slightly reduces increases in frequency and intensity in the Mid Atlantic and Pacific Northwest.
Where Pith is reading between the lines
- The same downscaling approach could be tested on additional SAI scenarios that differ in injection latitude, altitude, or amount to map how design choices affect regional precipitation extremes.
- If the out-of-distribution performance holds for other Earth system models, diffusion downscalers could become a standard tool for generating fine-scale impact assessments of proposed climate interventions.
Load-bearing premise
The diffusion downscaler trained on MESACLIP data generalizes without substantial bias when applied to CESM2 inputs in an out-of-distribution setting.
What would settle it
If downscaled historical CESM2 precipitation extremes differ substantially from high-resolution observations or reanalysis in regions where the original CESM2 runs already match observations well, the future projections would lose reliability.
Figures






read the original abstract
Stratospheric aerosol injection (SAI), a possible climate engineering strategy where reflective particles are injected into the stratosphere, has been explored to mitigate global warming and its associated risks, such as the intensification of extreme precipitation events. However, current Earth system models (ESMs) often used to simulate SAI and other climate change scenarios are too coarse to properly assess such risks. Traditional statistical downscaling methods, used to project higher resolution impacts, may be biased and unrealistic. To address this, we train a deep learning diffusion downscaler to generate 0.25{\deg} contiguous United States (CONUS) daily precipitation using historical and future climate simulations from the Mesoscale Atmosphere-Ocean Interaction in Seasonal-to-Decadal Climate Prediction (MESACLIP) project, then apply the diffusion downscaler to out-of-distribution CESM2 simulations with and without SAI. The diffusion model generates realistic downscaled precipitation using either MESACLIP or CESM2 inputs. It also faithfully recreates the climate change projections of extreme precipitation in MESACLIP. Diffusion-downscaled projections of the future CESM2 SAI scenarios suggest that SAI could nearly cut in half the CONUS-average increase in yearly max precipitation, compared to the non-SAI scenario. However, there is considerable regional variation and internal variability, with SAI modeled to only slightly reduce increases in extreme precipitation frequency in the Mid Atlantic and the Pacific Northwest, but mitigating most intensification in other regions. Future application of diffusion downscaling to a wider variety of SAI scenarios would provide valuable insight into how proposed SAI strategies may affect precipitation variability on fine spatial scales for regional impact assessments.
Editorial analysis
A structured set of objections, weighed in public.
Referee Report
Summary. The manuscript trains a diffusion-based downscaler on MESACLIP historical and future simulations to generate realistic 0.25° daily precipitation fields over CONUS. It reports good performance and faithful recreation of extreme precipitation climate-change signals on held-out MESACLIP data, then applies the model out-of-distribution to CESM2 runs with and without stratospheric aerosol injection (SAI). The central result is that SAI nearly halves the CONUS-average increase in yearly-maximum precipitation relative to the non-SAI scenario, with notable regional variation and internal variability.
Significance. If the out-of-distribution generalization to CESM2 preserves unbiased extreme-precipitation trends, the work would supply a practical route to high-resolution SAI impact assessment on CONUS extremes, addressing a recognized limitation of coarse ESMs for regional risk evaluation. The diffusion model's demonstrated ability to produce realistic fields and to reproduce MESACLIP signals is a clear methodological strength.
major comments (1)
- [Abstract and CESM2 application] Abstract and CESM2 application (final two paragraphs): The claim that SAI 'could nearly cut in half the CONUS-average increase in yearly max precipitation' is load-bearing for the paper's primary conclusion, yet rests on the untested assumption that the MESACLIP-trained diffusion model transfers without systematic bias to CESM2 inputs. While §§3–4 quantify performance and signal fidelity on MESACLIP test data, the CESM2 results supply only qualitative realism checks and aggregate statistics; no quantitative comparison of downscaled versus native CESM2 trends in yearly-maximum precipitation or extreme-frequency changes is reported. This omission directly affects confidence in the reported ~50 % reduction.
minor comments (1)
- [Abstract] Abstract: The phrase 'faithfully recreates the climate change projections' would benefit from an explicit statement of the quantitative metrics (e.g., trend correlation, bias in extremes) used to support this assessment.
Simulated Author's Rebuttal
We thank the referee for highlighting the critical assumption underlying our primary CESM2 result. We address the concern directly below and outline revisions to improve clarity and transparency.
read point-by-point responses
-
Referee: [Abstract and CESM2 application] Abstract and CESM2 application (final two paragraphs): The claim that SAI 'could nearly cut in half the CONUS-average increase in yearly max precipitation' is load-bearing for the paper's primary conclusion, yet rests on the untested assumption that the MESACLIP-trained diffusion model transfers without systematic bias to CESM2 inputs. While §§3–4 quantify performance and signal fidelity on MESACLIP test data, the CESM2 results supply only qualitative realism checks and aggregate statistics; no quantitative comparison of downscaled versus native CESM2 trends in yearly-maximum precipitation or extreme-frequency changes is reported. This omission directly affects confidence in the reported ~50 % reduction.
Authors: We agree that the reported ~50% reduction in the CONUS-average increase in yearly-maximum precipitation under SAI relies on the diffusion model generalizing without large systematic bias from MESACLIP to CESM2, and that §§3–4 provide no direct quantitative test of trend preservation on CESM2 itself. The manuscript instead demonstrates (i) realistic downscaled fields from CESM2 inputs via visual and distributional checks and (ii) faithful reproduction of MESACLIP extreme-precipitation climate-change signals on held-out data. Because native CESM2 precipitation is available only at ~1° resolution, a pixel-level comparison of yearly-maximum trends is not straightforward; we therefore reported only aggregate CONUS statistics and regional patterns for the downscaled fields. In the revised manuscript we will (a) qualify the abstract and concluding paragraphs to state the transfer assumption explicitly, (b) add a dedicated limitations paragraph discussing potential OOD biases for extremes, and (c) include a supplementary comparison of area-averaged extreme-frequency changes between native CESM2 and the downscaled fields to the extent resolution differences permit. These changes will make the evidential basis for the central claim more transparent without altering the reported numbers. revision: yes
Circularity Check
No circularity: training on MESACLIP and inference on independent CESM2 inputs keeps the SAI projection non-tautological
full rationale
The paper trains the diffusion downscaler exclusively on MESACLIP historical/future runs and then applies the fixed model to separate CESM2 simulations. The central quantitative claim (SAI nearly halving the CONUS-average yearly-max precipitation increase) is obtained by feeding CESM2 coarse fields through the already-trained network; no equation, fitted parameter, or self-citation reduces this output to a quantity defined from the same MESACLIP data by construction. The OOD transfer is presented as an empirical test rather than a definitional step, satisfying the requirement that the derivation remain self-contained against external benchmarks.
Axiom & Free-Parameter Ledger
Reference graph
Works this paper leans on
-
[1]
Introduction Most projections of climate change and its impacts rely on future climate simulations using Earth system models (ESMs), which are used to explore a wide variety of hypothetical future climate scenarios. Considering current carbon dioxide emissions mitigation efforts, the most likely future scenarios will result in warming exceeding the 1.5°C ...
work page 2022
-
[2]
have been developed that can outperform traditional downscaling methods (Baño-Medina et al., 2020; Hobeichi et al., 2023, Rampal et al., 2022). In particular, downscaling has been performed using diffusion modeling, a probabilistic deep learning framework that can stochastically generate high-resolution images given low-resolution inputs (Ho et al., 2020;...
work page 2020
-
[3]
MESACLIP uses the Community Earth System Model version 1.3 (CESM1.3; Meehl et al.,
Methods and Data 2.1 MESACLIP simulation data We train and test our machine learning downscaler using high-resolution climate simulations from MESACLIP (Chang et al., 2020). MESACLIP uses the Community Earth System Model version 1.3 (CESM1.3; Meehl et al.,
work page 2020
-
[4]
run at ~0.25°. The model is low-top, with only coarse resolution in the stratosphere and totaling 30 vertical levels up to 3 hPa. This high-resolution version of CESM1.3 is much improved compared to the low-resolution version (~1°) in representing extremes, such as those related to tropical cyclones, atmospheric rivers, and extreme precipitation over CONU...
work page 2020
-
[5]
from 1850 to 2014, with two varying future scenarios. The first future simulations use an SSP2-4.5 scenario (Riahi et al., 2017; Meehl et al., 2020), which is a middle-of-the-road scenario with moderate mitigation, compared to more extreme business-as-usual scenarios (e.g. RCP 8.5 used to train the downscaler). The second future scenario consists of corre...
work page 2014
-
[6]
2.3 Diffusion Downscaling We produce downscaled predictions of daily 0.25° precipitation over CONUS (20°N-52°N, 232°E-296°E) using a residual conditional diffusion framework. As conditioning we use coarse precipitation as well as TCW and Z500, which allow the neural network to learn connections between large-scale dynamical conditions and the target preci...
work page 2020
-
[7]
The coarse inputs (precipitation, TCW, Z500) are collectively dropped during training with a probability of 0.1 and filled with 0’s. During inference, classifier-free guidance can be used with different strengths (-0.1, 0, 0.1), for which the optimal strength is determined using the validation dataset. Exponential decay moving average is used for the mode...
work page 2007
-
[8]
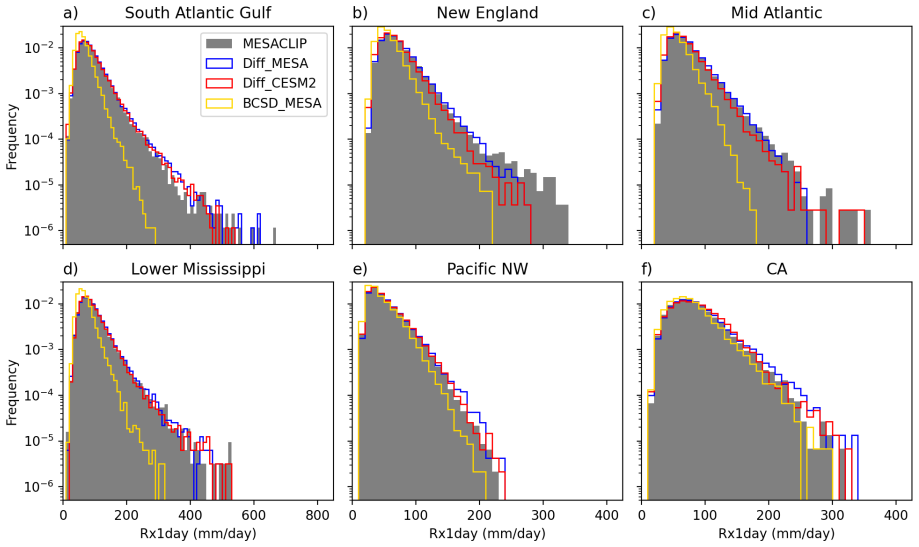
Results 3.1 Evaluation over historical period We begin by comparing the variability of downscaled precipitation from the diffusion model with actual high-res MESACLIP precipitation during the historical period (1980-2004), when conditioned on either MESACLIP or CESM2 coarse inputs. In order to later apply the diffusion model to future CESM2 climate scenar...
work page 1980
-
[9]
using the diffusion downscaled projections and BCSD. As in MESACLIP, the percentage increase in the most extreme precipitation quantiles is larger than for moderate quantiles, except in California, which provides some confidence that the diffusion downscaler is producing realistic projections. Additionally, for the most extreme precipitation percentiles i...
work page 2000
-
[10]
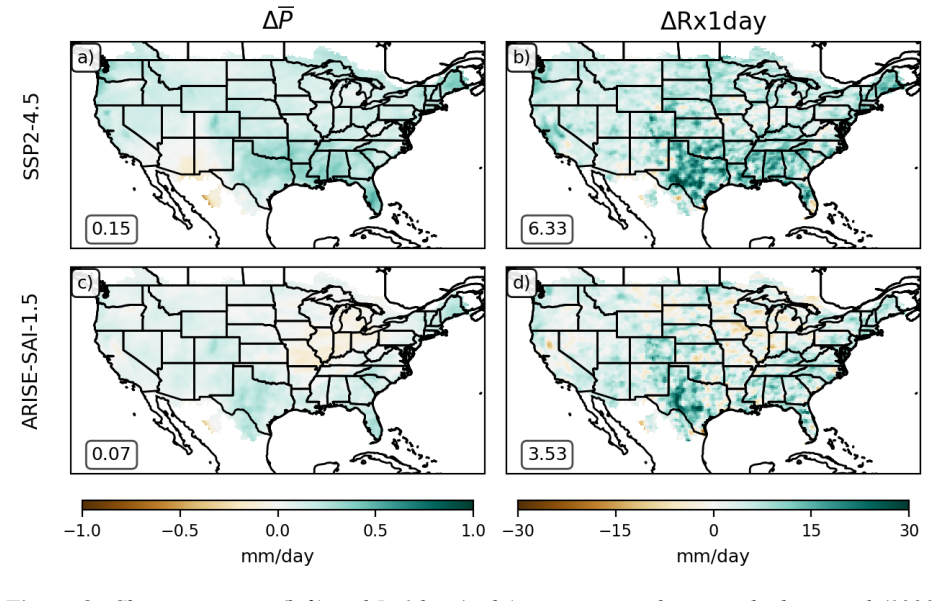
Discussion We use a diffusion framework to train a deep learning neural network to produce daily high-resolution (0.25°) precipitation fields over CONUS given coarse (4°) daily precipitation, total column water, and 500 hPa geopotential height. The purpose of this neural network downscaler is to improve projections of fine-scale extreme weather in future ...
work page 2020
-
[11]
leads to reduced changes in both mean and Rx1day precipitation over CONUS compared to an SSP2-4.5 scenario without SAI. On a CONUS-wide average, the downscaled projections suggest nearly a 45% reduction in Rx1day intensification in the SAI scenario compared to the non-SAI scenario. However, this mitigation varies regionally. While the non-SAI scenario gen...
-
[12]
Flow Matching for Generative Modeling
https://doi.org/10.1038/s41467-024-47656-z. Hulme, M. (2012) 'Climate change: climate engineering through stratospheric aerosol injection', Prog. Phys. Geog., 36(5), pp. 694–705. https://doi.org/10.1177/0309133312456414. Iles, C.E., Vautard, R., Strachan, J., Joussaume, S., Eggen, B.R. and Hewitt, C.D. (2020) 'The benefits of increasing resolution in glob...
work page internal anchor Pith review Pith/arXiv arXiv doi:10.1038/s41467-024-47656-z 2012
-
[13]
Science, 376(6600), pp.1404-1409
Current global efforts are insufficient to limit warming to 1.5 C. Science, 376(6600), pp.1404-1409. https://doi.org/10.1126/science.abo3378 Meehl, G.A., Yang, D., Arblaster, J.M., Bates, S.C., Rosenbloom, N., Neale, R., Bacmeister, J., Lauritzen, P.H., Bryan, F., Small, J., Truesdale, J., Hannay, C., Shields, C., Strand, W.G., Dennis, J. and Danabasoglu,...
-
[14]
Score-Based Generative Modeling through Stochastic Differential Equations
https://doi.org/10.1088/1748-9326/aae98d. Song, Y., Sohl-Dickstein, J., Kingma, D.P., Kumar, A., Ermon, S. and Poole, B. (2020) 'Score-based generative modeling through stochastic differential equations', arXiv [cs.LG]. https://doi.org/10.48550/arXiv.2011.13456. Srivastava, P., Yang, R., Kerrigan, G., Dresdner, G., McGibbon, J., Bretherton, C.S. and Mandt...
work page internal anchor Pith review Pith/arXiv arXiv doi:10.1088/1748-9326/aae98d 2020
-
[15]
Thrasher, B., Maurer, E.P., McKellar, C
https://doi.org/10.3389/fclim.2021.720312. Thrasher, B., Maurer, E.P., McKellar, C. and Duffy, P.B. (2012) 'Technical note: bias correcting climate model simulated daily temperature extremes with quantile mapping', Hydrol. Earth Syst. Sci., 16(9), pp. 3309–3314. https://doi.org/10.5194/hess-16-3309-2012. Tilmes, S., MacMartin, D.G., Lenaerts, J.T.M., van ...
discussion (0)
Sign in with ORCID, Apple, or X to comment. Anyone can read and Pith papers without signing in.