Rethinking Weak Supervision in Anomaly Detection: A Comprehensive Benchmark
Pith reviewed 2026-06-29 22:24 UTC · model grok-4.3
The pith
A single benchmark across weak supervision scenarios in anomaly detection finds strong intrinsic correlations between them and shows specialized methods lose to general models once labels exceed extreme scarcity.
A machine-rendered reading of the paper's core claim, the machinery that carries it, and where it could break.
Core claim
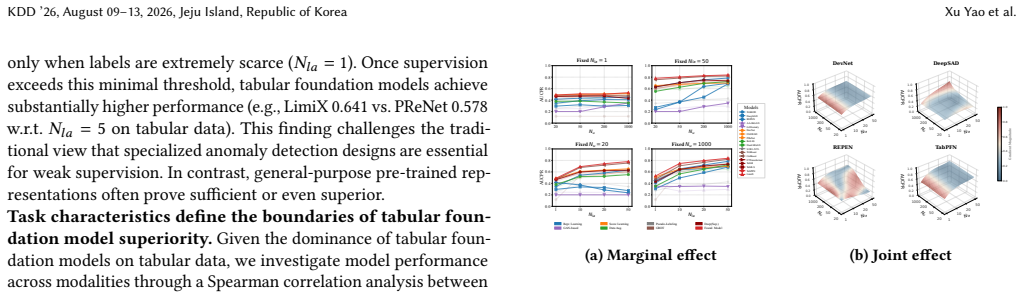
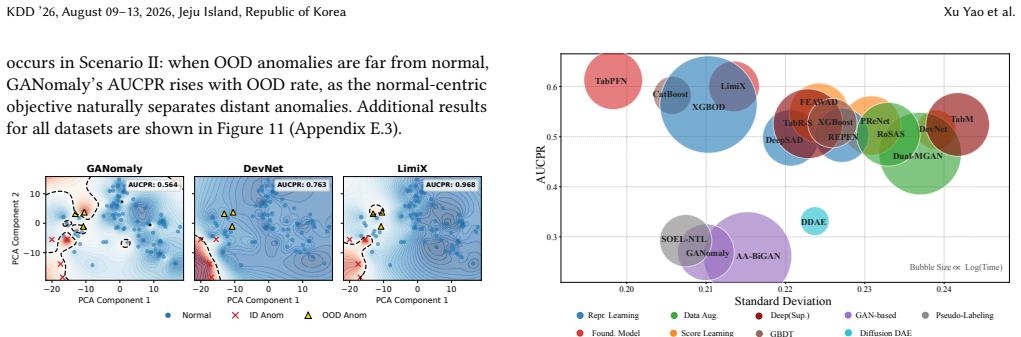
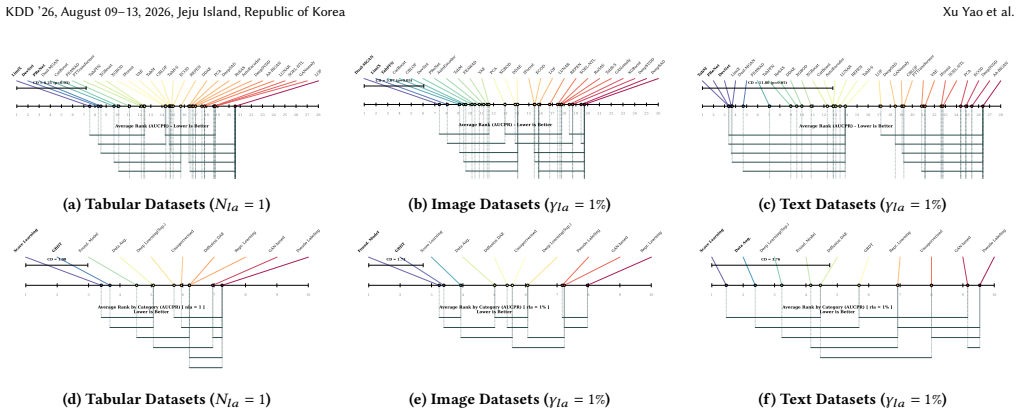
WSADBench shows that the three primary weak supervision scenarios exhibit strong intrinsic correlations, that specialized WSAD algorithms only outperform others in the most extreme label-scarcity regimes and are quickly surpassed by tabular foundation models and general classification methods as supervision increases or in out-of-distribution cases, that unlabeled data yields inconsistent and marginal gains compared with label refinement, and that models display asymmetric sensitivity to different forms of label noise.
What carries the argument
WSADBench, the benchmark that applies standardized protocols for varying label quantity, granularity, and quality to compare 36 algorithms across four modalities in a unified way.
If this is right
- Strong correlations between incomplete, inexact, and inaccurate supervision challenge the practice of isolating research on each direction.
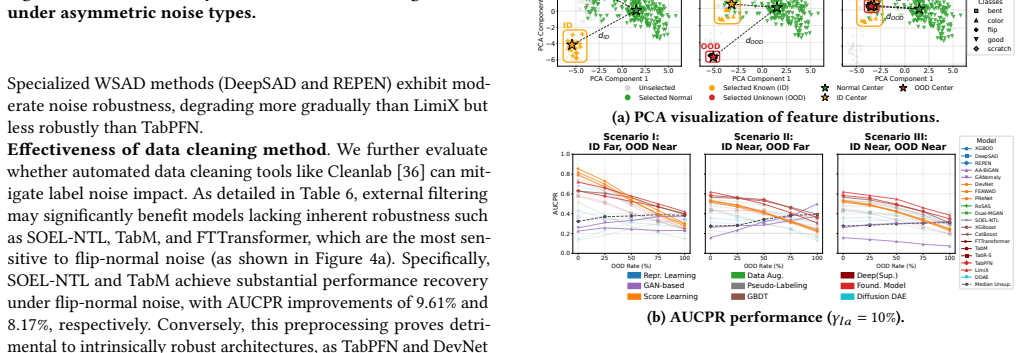
- Specialized WSAD algorithms are competitive only under extreme label scarcity and lose to foundation models and general classifiers otherwise or in OOD settings.
- Unlabeled data provides inconsistent and smaller benefits than improving the quality or granularity of existing labels.
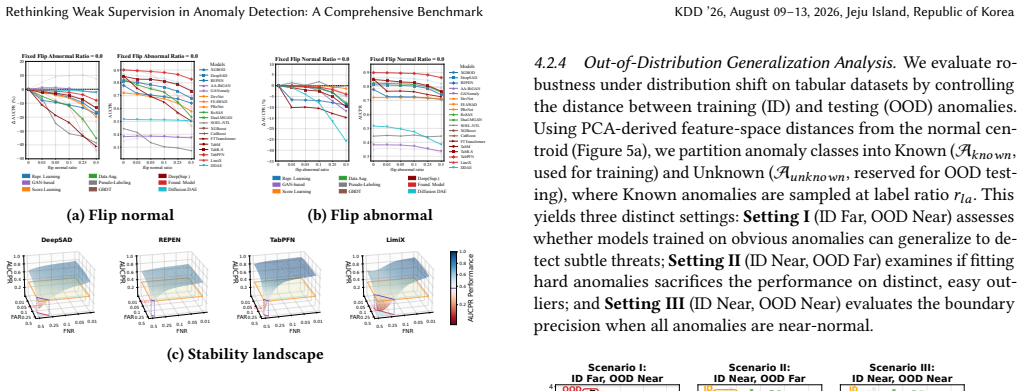
- Model performance reacts differently to different kinds of label noise, with some noise types hurting more than others.
Where Pith is reading between the lines
- Research effort might shift toward methods designed to exploit the shared structure across supervision types rather than building separate tools for each.
- Similar unified benchmarks could be useful in other weakly supervised domains to check whether apparent distinctions are real or artifacts of isolated evaluation.
- In practice, teams may gain more by investing in label cleaning than by collecting additional unlabeled examples.
- The observed asymmetry in noise sensitivity suggests targeted noise-robust training techniques could be developed for the most damaging noise types.
Load-bearing premise
The chosen collection of 36 algorithms, four modalities, and the particular ways of changing label quantity, granularity, and quality are representative enough to draw general conclusions about performance boundaries and correlations in real-world settings.
What would settle it
An independent replication that applies the same variation protocols to a substantially different set of algorithms or modalities and finds either no correlations between the supervision scenarios or continued dominance of specialized methods outside extreme scarcity would falsify the central claims.
Figures


read the original abstract
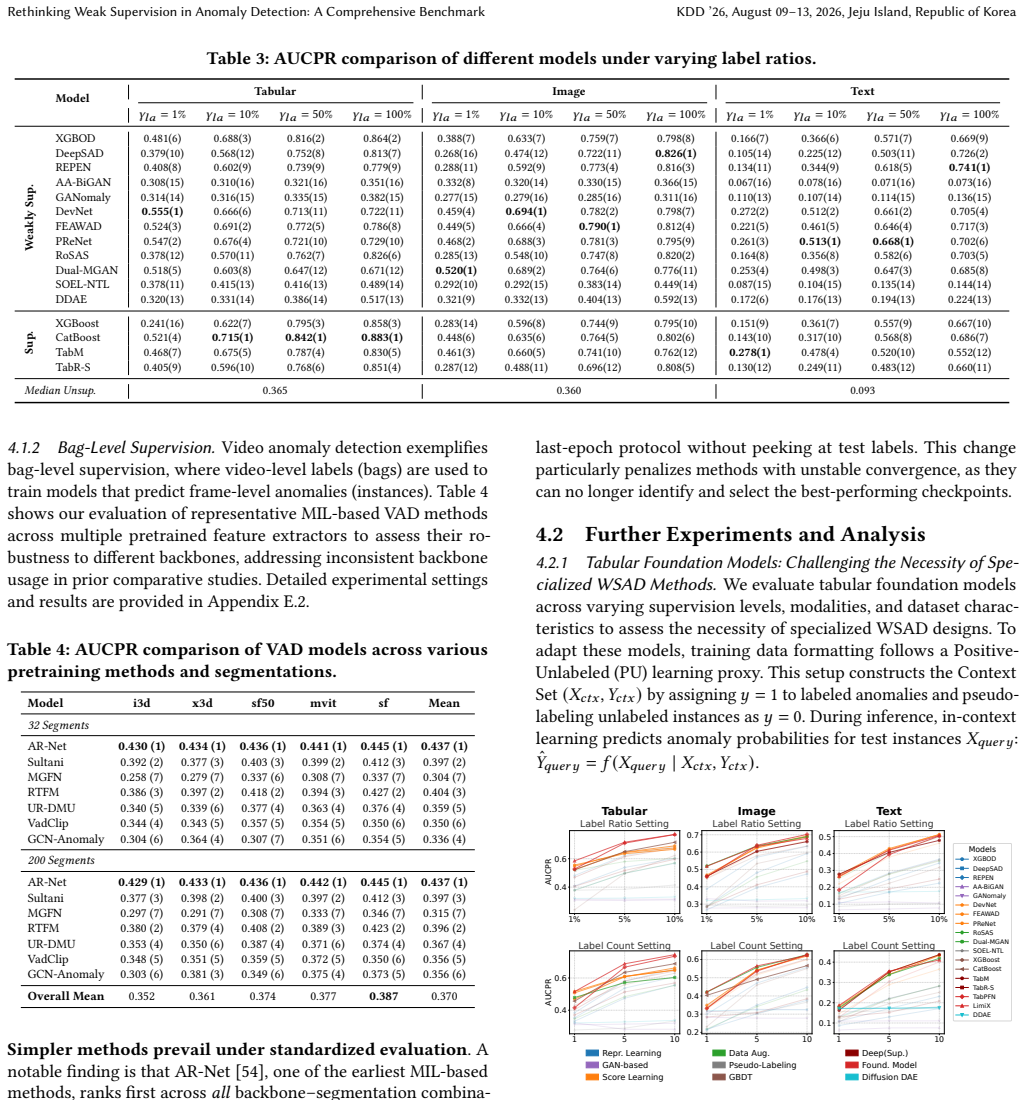
Weakly supervised anomaly detection (WSAD) has developed in three primary directions: incomplete, inexact, and inaccurate supervision. However, these directions remain isolated, lacking a unified framework to assess whether they address unique challenges or share fundamental mechanisms. This paper introduces WSADBench, the first benchmark that unifies evaluation across distinct weakly supervised scenarios, benchmarking diverse approaches from specialized WSAD methods to advanced tabular foundation models. WSADBench establishes standardized protocols to evaluate 36 algorithms across 4 modalities by systematically varying label quantity, granularity, and quality, revealing the performance boundaries of various methods. Based on over 700K experiments, WSADBench reveals four critical insights: (i) Strong intrinsic correlations exist between these weak supervision scenarios, challenging the isolation of current research directions. (ii) Specialized WSAD algorithms excel only in extreme label-scarcity regimes but are quickly dominated by tabular foundation models and general classification methods as supervision increases or in OOD scenarios. (iii) Unlabeled data shows inconsistent utility across settings, with marginal gains compared to label refinement. (iv) Models exhibit asymmetric sensitivity to different types of label noise. We release WSADBench as an open-source benchmark with code and datasets to facilitate future WSAD research: https://github.com/SUFE-AILAB/WSADBench.
Editorial analysis
A structured set of objections, weighed in public.
Referee Report
Summary. The paper introduces WSADBench, the first unified benchmark for weakly supervised anomaly detection across incomplete, inexact, and inaccurate supervision. It evaluates 36 algorithms across 4 modalities using standardized protocols that systematically vary label quantity, granularity, and quality, conducting over 700K experiments to derive four insights: strong intrinsic correlations between the supervision scenarios, specialized WSAD methods being dominated by tabular foundation models and general classifiers outside extreme scarcity or in OOD settings, inconsistent utility of unlabeled data relative to label refinement, and asymmetric model sensitivity to label noise types. Code and datasets are released.
Significance. If the experimental choices prove representative, the work supplies large-scale empirical evidence that isolated WSAD research directions may share mechanisms and that method superiority is regime-specific, which could guide future algorithm development and evaluation standards. The scale of the benchmark and open release are clear strengths for reproducibility.
major comments (2)
- [Experimental setup] Experimental setup (protocols for label quantity/granularity/quality and algorithm selection): the four insights, particularly (i) on intrinsic correlations and (ii) on method dominance, rest on the assumption that the fixed set of 36 algorithms and simulation protocols are sufficiently representative. Reuse of the same base datasets and noise models across scenarios risks inducing the observed correlations as artifacts rather than intrinsic properties; a sensitivity analysis to alternative dataset families or method classes (e.g., recent graph-based WSAD) is needed to support generalizability.
- [Results and analysis] Results and analysis sections: insight (iii) states unlabeled data shows 'marginal gains' and 'inconsistent utility,' yet no quantitative definition of marginal gain, statistical significance tests, or comparison baselines against label refinement are provided, weakening the claim that refinement is preferable.
minor comments (1)
- [Abstract] Abstract and introduction: the claim of 'strong intrinsic correlations' would benefit from a brief parenthetical on the correlation metric (e.g., Spearman rank or Pearson on performance surfaces) used to establish them.
Simulated Author's Rebuttal
We thank the referee for the constructive feedback and recommendation for minor revision. We address the major comments point by point below.
read point-by-point responses
-
Referee: [Experimental setup] Experimental setup (protocols for label quantity/granularity/quality and algorithm selection): the four insights, particularly (i) on intrinsic correlations and (ii) on method dominance, rest on the assumption that the fixed set of 36 algorithms and simulation protocols are sufficiently representative. Reuse of the same base datasets and noise models across scenarios risks inducing the observed correlations as artifacts rather than intrinsic properties; a sensitivity analysis to alternative dataset families or method classes (e.g., recent graph-based WSAD) is needed to support generalizability.
Authors: Our selection of 36 algorithms spans specialized WSAD methods, general classifiers, and tabular foundation models across four modalities to represent core paradigms. Consistent base datasets and noise models are required to isolate the effects of supervision type and enable the benchmark's unification goal. The correlations and dominance patterns hold consistently across 700K experiments and multiple modalities, indicating intrinsic properties. We will add a dedicated paragraph in the revised manuscript discussing the scope of our algorithm and dataset choices and outlining directions for future sensitivity analyses. revision: partial
-
Referee: [Results and analysis] Results and analysis sections: insight (iii) states unlabeled data shows 'marginal gains' and 'inconsistent utility,' yet no quantitative definition of marginal gain, statistical significance tests, or comparison baselines against label refinement are provided, weakening the claim that refinement is preferable.
Authors: We agree that insight (iii) requires more rigorous quantification to be fully convincing. In the revision we will introduce an explicit definition of marginal gains (relative improvement below 5%), report statistical significance via paired tests across runs, and add direct side-by-side comparisons of unlabeled-data utility versus label-refinement baselines. revision: yes
Circularity Check
Empirical benchmark with no derivation chain or self-referential reductions
full rationale
The paper conducts a large-scale empirical evaluation of 36 algorithms on 4 modalities using standardized protocols for label quantity, granularity, and quality, generating results from external algorithm implementations and public datasets. No equations, fitted parameters, or predictions are defined in terms of the paper's own outputs. The four insights are direct summaries of experimental performance surfaces rather than reductions to self-definitions, self-citations, or ansatzes. Self-citations, if present, are not load-bearing for any claimed derivation. This is a standard non-circular benchmark paper.
Axiom & Free-Parameter Ledger
axioms (1)
- domain assumption The 36 algorithms and 4 modalities are representative of current WSAD practice.
Reference graph
Works this paper leans on
-
[1]
Moshira Abdalla, Sajid Javed, Muaz Al Radi, Anwaar Ulhaq, and Naoufel Werghi
-
[2]
Video anomaly detection in 10 years: A survey and outlook.Neural Computing and Applications37, 32 (2025), 26321–26364
2025
-
[3]
Andra Acsintoae, Andrei Florescu, Mariana-Iuliana Georgescu, Tudor Mare, Paul Sumedrea, Radu Tudor Ionescu, Fahad Shahbaz Khan, and Mubarak Shah
-
[4]
InProceedings of the IEEE/CVF Conference on Computer Vision and Pattern Recognition (CVPR)
UBnormal: New Benchmark for Supervised Open-Set Video Anomaly Detection. InProceedings of the IEEE/CVF Conference on Computer Vision and Pattern Recognition (CVPR). 20125–20135
-
[5]
Charu C. Aggarwal. 2013.Outlier Analysis. Springer. doi:10.1007/978-1-4614- 6396-2
-
[6]
Samet Akcay, Amir Atapour-Abarghouei, and Toby P Breckon. 2018. Ganomaly: Semi-supervised anomaly detection via adversarial training. InAsian conference on computer vision. Springer, 622–637
2018
-
[7]
Fabrizio Angiulli and Clara Pizzuti. 2002. Fast outlier detection in high dimen- sional spaces. InEuropean conference on principles of data mining and knowledge discovery. Springer, 15–27
2002
-
[8]
Jinan Bao, Hanshi Sun, Hanqiu Deng, Yinsheng Brennan He, Zhaoxiang Zhang, and Xingyu Li. 2024. BMAD: Benchmarks for Medical Anomaly Detection. In Proceedings of the IEEE/CVF Conference on Computer Vision and Pattern Recognition. 4042–4053
2024
-
[9]
Mohamed Bouadi, Pratinav Seth, Aditya Tanna, and Vinay Kumar Sankarapu
-
[10]
arXiv preprint arXiv:2511.02818(2025)
Orion-MSP: Multi-Scale Sparse Attention for Tabular In-Context Learning. arXiv preprint arXiv:2511.02818(2025)
-
[11]
Markus M Breunig, Hans-Peter Kriegel, Raymond T Ng, and Jörg Sander. 2000. LOF: identifying density-based local outliers. InProceedings of the 2000 ACM SIGMOD international conference on Management of data. 93–104
2000
-
[12]
Joao Carreira and Andrew Zisserman. 2017. Quo vadis, action recognition? a new model and the kinetics dataset. Inproceedings of the IEEE Conference on Computer Vision and Pattern Recognition. 6299–6308
2017
-
[13]
Tianqi Chen and Carlos Guestrin. 2016. Xgboost: A scalable tree boosting system. InProceedings of the 22nd acm sigkdd international conference on knowledge discovery and data mining. 785–794
2016
-
[14]
Yingxian Chen, Zhengzhe Liu, Baoheng Zhang, Wilton Fok, Xiaojuan Qi, and Yik-Chung Wu. 2023. Mgfn: Magnitude-contrastive glance-and-focus network for weakly-supervised video anomaly detection. InProceedings of the AAAI conference on artificial intelligence, Vol. 37. 387–395
2023
-
[15]
Choubo Ding, Guansong Pang, and Chunhua Shen. 2022. Catching both gray and black swans: Open-set supervised anomaly detection. InProceedings of the IEEE/CVF conference on computer vision and pattern recognition. 7388–7398
2022
-
[16]
Yutao Dong, Qing Li, Richard O Sinnott, Yong Jiang, and Shutao Xia. 2021. ISP self-operated BGP anomaly detection based on weakly supervised learning. In 2021 IEEE 29th International Conference on Network Protocols (ICNP). IEEE, 1–11
2021
-
[17]
Marius Dragoi, Elena Burceanu, Emanuela Haller, Andrei Manolache, and Florin Brad. 2022. Anoshift: A distribution shift benchmark for unsupervised anomaly detection.Advances in Neural Information Processing Systems35 (2022), 32854– 32867
2022
-
[18]
Christoph Feichtenhofer, Haoqi Fan, Jitendra Malik, and Kaiming He. 2019. Slow- fast networks for video recognition. InProceedings of the IEEE/CVF international conference on computer vision. 6202–6211
2019
-
[19]
Adam Goodge, Bryan Hooi, See-Kiong Ng, and Wee Siong Ng. 2022. Lunar: Uni- fying local outlier detection methods via graph neural networks. InProceedings of the AAAI Conference on Artificial Intelligence, Vol. 36. 6737–6745
2022
-
[20]
Yury Gorishniy, Akim Kotelnikov, and Artem Babenko. 2025. Tabm: Advanc- ing tabular deep learning with parameter-efficient ensembling. InInternational Conference on Learning Representations, Vol. 2025. 77899–77935
2025
-
[21]
Yury Gorishniy, Ivan Rubachev, Nikolay Kartashev, Daniil Shlenskii, Akim Kotel- nikov, and Artem Babenko. 2024. Tabr: Tabular deep learning meets nearest neighbors. InInternational Conference on Learning Representations, Vol. 2024. 18209–18249
2024
-
[22]
Yury Gorishniy, Ivan Rubachev, Valentin Khrulkov, and Artem Babenko. 2021. Revisiting deep learning models for tabular data.Advances in neural information processing systems34 (2021), 18932–18943
2021
-
[23]
Sachin Goyal, Aditi Raghunathan, Moksh Jain, Harsha Vardhan Simhadri, and Prateek Jain. 2020. DROCC: Deep robust one-class classification. InInternational conference on machine learning. PMLR, 3711–3721
2020
-
[24]
Léo Grinsztajn, Klemens Flöge, Oscar Key, Felix Birkel, Philipp Jund, Brendan Roof, Benjamin Jäger, Dominik Safaric, Simone Alessi, Adrian Hayler, et al. 2025. Tabpfn-2.5: Advancing the state of the art in tabular foundation models.arXiv preprint arXiv:2511.08667(2025)
work page internal anchor Pith review Pith/arXiv arXiv 2025
-
[25]
Weinberger
Chuan Guo, Geoff Pleiss, Yu Sun, and Kilian Q. Weinberger. 2017. On Calibration of Modern Neural Networks. InProceedings of the 34th International Conference on Machine Learning. PMLR, 1321–1330
2017
-
[26]
Songqiao Han, Xiyang Hu, Hailiang Huang, Minqi Jiang, and Yue Zhao. 2022. ADBench: Anomaly Detection Benchmark. InNeurIPS
2022
-
[27]
Zengyou He, Xiaofei Xu, and Shengchun Deng. 2003. Discovering cluster-based local outliers.Pattern recognition letters24, 9-10 (2003), 1641–1650
2003
-
[28]
Tin Kam Ho and Mitra Basu. 2002. Complexity measures of supervised classifica- tion problems.IEEE transactions on pattern analysis and machine intelligence24, 3 (2002), 289–300
2002
-
[29]
Xi Jiang, Jian Li, Hanqiu Deng, Yong Liu, Bin-Bin Gao, Yifeng Zhou, Jialin Li, Chengjie Wang, and Feng Zheng. 2025. Mmad: A comprehensive benchmark for multimodal large language models in industrial anomaly detection. InInterna- tional conference on learning representations. 87273–87295
2025
-
[30]
Kingma and Max Welling
Diederik P. Kingma and Max Welling. 2014. Auto-Encoding Variational Bayes. In 2nd International Conference on Learning Representations
2014
-
[31]
Elizaveta Levina and Peter Bickel. 2004. Maximum likelihood estimation of intrinsic dimension.Advances in neural information processing systems17 (2004)
2004
-
[32]
Yuangang Li, Jiaqi Li, Zhuo Xiao, Tiankai Yang, Yi Nian, Xiyang Hu, and Yue Zhao. 2025. NLP-ADBench: NLP Anomaly Detection Benchmark. InFindings of the Association for Computational Linguistics: EMNLP 2025. 2464–2474. doi:10. 18653/v1/2025.findings-emnlp.133
2025
-
[33]
Zhe Li, Chunhua Sun, et al. 2022. Dual-MGAN: An Efficient Approach for Semi- supervised Outlier Detection with Few Identified Anomalies.TKDD(2022)
2022
-
[34]
Zheng Li, Yue Zhao, Xiyang Hu, Nicola Botta, Cezar Ionescu, and George H Chen. 2022. Ecod: Unsupervised outlier detection using empirical cumulative distribution functions.IEEE Transactions on Knowledge and Data Engineering35, 12 (2022), 12181–12193
2022
-
[35]
Fei Tony Liu, Kai Ming Ting, and Zhi-Hua Zhou. 2008. Isolation forest. In2008 eighth ieee international conference on data mining. IEEE, 413–422
2008
-
[36]
Wen Liu, Weixin Luo, Dongze Lian, and Shenghua Gao. 2018. Future frame prediction for anomaly detection–a new baseline. InProceedings of the IEEE conference on computer vision and pattern recognition. 6536–6545
2018
-
[37]
Cresswell, Keyvan Golestan, Guangwei Yu, Anthony L
Junwei Ma, Valentin Thomas, Rasa Hosseinzadeh, Alex Labach, Jesse C. Cresswell, Keyvan Golestan, Guangwei Yu, Anthony L. Caterini, and Maksims Volkovs. 2025. TabDPT: Scaling Tabular Foundation Models on Real Data. InThe Thirty-ninth Annual Conference on Neural Information Processing Systems
2025
-
[38]
Mahdi Pakdaman Naeini, Gregory Cooper, and Milos Hauskrecht. 2015. Obtaining Well Calibrated Probabilities Using Bayesian Binning. InProceedings of the AAAI Conference on Artificial Intelligence, Vol. 29. KDD ’26, August 09–13, 2026, Jeju Island, Republic of Korea Xu Yao et al
2015
-
[39]
Curtis Northcutt, Lu Jiang, and Isaac Chuang. 2021. Confident learning: Esti- mating uncertainty in dataset labels.Journal of Artificial Intelligence Research70 (2021), 1373–1411
2021
-
[40]
Guansong Pang, Longbing Cao, Ling Chen, and Huan Liu. 2018. Learning rep- resentations of ultrahigh-dimensional data for random distance-based outlier detection. InProceedings of the 24th ACM SIGKDD international conference on knowledge discovery & data mining. 2041–2050
2018
-
[41]
Guansong Pang, Chunhua Shen, Longbing Cao, and Anton Van Den Hengel. 2021. Deep learning for anomaly detection: A review.ACM computing surveys (CSUR) 54, 2 (2021), 1–38
2021
-
[42]
Guansong Pang, Chunhua Shen, Huidong Jin, and Anton Van Den Hengel. 2023. Deep weakly-supervised anomaly detection. InProceedings of the 29th ACM SIGKDD conference on knowledge discovery and data mining. 1795–1807
2023
-
[43]
Guansong Pang, Chunhua Shen, and Anton Van Den Hengel. 2019. Deep anomaly detection with deviation networks. InProceedings of the 25th ACM SIGKDD international conference on knowledge discovery & data mining. 353–362
2019
-
[44]
Lorenzo Perini, Vincent Vercruyssen, and Jesse Davis. 2023. Learning from positive and unlabeled multi-instance bags in anomaly detection. InProceedings of the 29th ACM SIGKDD conference on knowledge discovery and data mining. 1897–1906
2023
-
[45]
Liudmila Prokhorenkova, Gleb Gusev, Aleksandr Vorobev, Anna Veronika Doro- gush, and Andrey Gulin. 2018. CatBoost: unbiased boosting with categorical features.Advances in neural information processing systems31 (2018)
2018
-
[46]
Jingang Qu, David Holzmüller, Gaël Varoquaux, and Marine Le Morvan. 2026. TabICLv2: A better, faster, scalable, and open tabular foundation model. (2026)
2026
-
[47]
Olivier Roy and Martin Vetterli. 2007. The effective rank: A measure of effective dimensionality. In2007 15th European signal processing conference. IEEE, 606–610
2007
-
[48]
Lukas Ruff, Robert Vandermeulen, Nico Goernitz, Lucas Deecke, Shoaib Ahmed Siddiqui, Alexander Binder, Emmanuel Müller, and Marius Kloft. 2018. Deep one-class classification. InInternational conference on machine learning. PMLR, 4393–4402
2018
-
[49]
Vandermeulen, Nico Görnitz, Alexander Binder, Emmanuel Müller, Klaus-Robert Müller, and Marius Kloft
Lukas Ruff, Robert A. Vandermeulen, Nico Görnitz, Alexander Binder, Emmanuel Müller, Klaus-Robert Müller, and Marius Kloft. 2020. Deep Semi-Supervised Anomaly Detection. InInternational Conference on Learning Representations
2020
-
[50]
Timur Sattarov, Marco Schreyer, and Damian Borth. 2025. Diffusion-Scheduled Denoising Autoencoders for Anomaly Detection in Tabular Data. InProceedings of the 31st ACM SIGKDD Conference on Knowledge Discovery and Data Mining V
2025
-
[51]
Mei-Ling Shyu, Shu-Ching Chen, Kanoksri Sarinnapakorn, and LiWu Chang
-
[52]
Technical report, Miami Univ Coral Gables Fl Dept of Electrical and Computer Engineering
A novel anomaly detection scheme based on principal component classifier. Technical report, Miami Univ Coral Gables Fl Dept of Electrical and Computer Engineering
-
[53]
Hwanjun Song, Minseok Kim, Dongmin Park, Yooju Shin, and Jae-Gil Lee. 2022. Learning from noisy labels with deep neural networks: A survey.IEEE transactions on neural networks and learning systems34, 11 (2022), 8135–8153
2022
-
[54]
Waqas Sultani, Chen Chen, and Mubarak Shah. 2018. Real-world anomaly de- tection in surveillance videos. InProceedings of the IEEE conference on computer vision and pattern recognition. 6479–6488
2018
-
[55]
Bowen Tian, Qinliang Su, and Jian Yin. 2022. Anomaly Detection by Lever- aging Incomplete Anomalous Knowledge with Anomaly-Aware Bidirectional GANs. InProceedings of the Thirty-First International Joint Conference on Artificial Intelligence, IJCAI-22. 2255–2261
2022
-
[56]
Yu Tian, Guansong Pang, Yuanhong Chen, Rajvinder Singh, Johan W Verjans, and Gustavo Carneiro. 2021. Weakly-supervised video anomaly detection with robust temporal feature magnitude learning. InProceedings of the IEEE/CVF international conference on computer vision. 4975–4986
2021
-
[57]
Du Tran, Lubomir Bourdev, Rob Fergus, Lorenzo Torresani, and Manohar Paluri
-
[58]
In Proceedings of the IEEE international conference on computer vision
Learning spatiotemporal features with 3D convolutional networks. In Proceedings of the IEEE international conference on computer vision. 4489–4497
- [59]
-
[60]
Peng Wu, Jing Liu, Yujia Shi, Yujia Sun, Fangtao Shao, Zhaoyang Wu, and Zhiwei Yang. 2020. Not only look, but also listen: Learning multimodal violence detection under weak supervision. InEuropean conference on computer vision. Springer, 322–339
2020
-
[61]
Peng Wu, Xuerong Zhou, Guansong Pang, Lingru Zhou, Qingsen Yan, Peng Wang, and Yanning Zhang. 2024. Vadclip: Adapting vision-language models for weakly supervised video anomaly detection. InProceedings of the AAAI conference on artificial intelligence, Vol. 38. 6074–6082
2024
- [62]
-
[63]
Hongzuo Xu, Yijie Wang, Guansong Pang, Songlei Jian, Ning Liu, and Yongjun Wang. 2023. RoSAS: Deep semi-supervised anomaly detection with contamination-resilient continuous supervision.Information Processing & Man- agement60, 5 (2023), 103459
2023
-
[64]
Yajun Xu, Huan Hu, Chuwen Huang, Yibing Nan, Yuyao Liu, Kai Wang, Zhaox- iang Liu, and Shiguo Lian. 2025. TAD: A Large-Scale Benchmark for Traffic Accidents Detection From Video Surveillance.IEEE Access13 (2025), 2018–2033
2025
-
[65]
Jingkang Yang, Pengyun Wang, Dejian Zou, Zitang Zhou, Kunyuan Ding, Wenx- uan Peng, Haoqi Wang, Dilip Chen, Bo Li, Yiyou Sun, et al . 2022. OpenOOD: Benchmarking generalized out-of-distribution detection. InAdvances in Neural Information Processing Systems, Vol. 35. 32598–32611
2022
-
[66]
Chiyuan Zhang, Samy Bengio, Moritz Hardt, Benjamin Recht, and Oriol Vinyals
-
[67]
Understanding deep learning (still) requires rethinking generalization. Commun. ACM64, 3 (2021), 107–115
2021
-
[68]
Jieyu Zhang, Yue Yu, Yinghao Li, Yujing Wang, Yaming Yang, Mao Yang, and Alexander Ratner. 2021. WRENCH: A Comprehensive Benchmark for Weak Supervision. InProceedings of the Neural Information Processing Systems Track on Datasets and Benchmarks
2021
-
[69]
Xiyuan Zhang et al. 2025. Mitra: Mixed Synthetic Priors for Enhancing Tabular Foundation Models. InThe Thirty-ninth Annual Conference on Neural Information Processing Systems
2025
- [70]
-
[71]
Yue Zhao and Maciej K Hryniewicki. 2018. Xgbod: improving supervised outlier detection with unsupervised representation learning. In2018 International Joint Conference on Neural Networks (IJCNN). IEEE, 1–8
2018
-
[72]
Yue Zhao, Zain Nasrullah, and Zheng Li. 2019. Pyod: A python toolbox for scalable outlier detection.Journal of machine learning research20, 96 (2019), 1–7
2019
-
[73]
Yue Zhao, Guoqing Zheng, Subhabrata Mukherjee, Robert McCann, and Ahmed Awadallah. 2023. Admoe: Anomaly detection with mixture-of-experts from noisy labels. InProceedings of the AAAI Conference on Artificial Intelligence, Vol. 37. 4937–4945
2023
-
[74]
Jia-Xing Zhong, Nannan Li, Weijie Kong, Shan Liu, Thomas H Li, and Ge Li. 2019. Graph convolutional label noise cleaner: Train a plug-and-play action classifier for anomaly detection. InProceedings of the IEEE/CVF conference on computer vision and pattern recognition. 1237–1246
2019
-
[75]
Hang Zhou, Junqing Yu, and Wei Yang. 2023. Dual memory units with uncertainty regulation for weakly supervised video anomaly detection. InProceedings of the AAAI Conference on Artificial Intelligence, Vol. 37. 3769–3777
2023
-
[76]
Yingjie Zhou, Xucheng Song, Yanru Zhang, Fanxing Liu, Ce Zhu, and Lingqiao Liu. 2021. Feature encoding with autoencoders for weakly supervised anomaly detection.IEEE Transactions on Neural Networks and Learning Systems33, 6 (2021), 2454–2465
2021
-
[77]
Zhi-Hua Zhou. 2018. A brief introduction to weakly supervised learning.National science review5, 1 (2018), 44–53
2018
-
[78]
Bo Zong, Qi Song, Martin Renqiang Min, Wei Cheng, Cristian Lumezanu, Daeki Cho, and Haifeng Chen. 2018. Deep autoencoding gaussian mixture model for unsupervised anomaly detection. InInternational conference on learning represen- tations. A Benchmark Details A.1 Dataset Summaries and Processing Specs We detail the diverse collection of datasets evaluated ...
-
[79]
Table 24: The average ± standard deviation and ranking of AUCPR under different 𝑁𝑙𝑎 (=1, 3, 5, 10, 15, 20, 50) settings on tabular datasets
(p) TabR-S 0.5 0.25 0.1 0.05 0.01 FNR 0.5 0.25 0.1 0.05 0.01 FAR 0.2 0.4 0.6 0.8 1.0AUCPR 0.177 0.5 0.25 0.1 0.05 0.01 FNR 0.5 0.25 0.1 0.05 0.01 FAR 0.2 0.4 0.6 0.8 1.0AUCPR 0.277 0.5 0.25 0.1 0.05 0.01 FNR 0.5 0.25 0.1 0.05 0.01 FAR 0.2 0.4 0.6 0.8 1.0AUCPR 0.144 0.5 0.25 0.1 0.05 0.01 FNR 0.5 0.25 0.1 0.05 0.01 FAR 0.2 0.4 0.6 0.8 1.0AUCPR 0.141 (q) Ta...
2026
discussion (0)
Sign in with ORCID, Apple, or X to comment. Anyone can read and Pith papers without signing in.