A Modified Multi-Level Tracking Scheme for the Detection of Sunspot Umbral Dots
Pith reviewed 2026-07-01 16:55 UTC · model grok-4.3
The pith
A modified multi-level tracking method measures sunspot umbral dots 70-90 km smaller in diameter than the standard approach.
A machine-rendered reading of the paper's core claim, the machinery that carries it, and where it could break.
Core claim
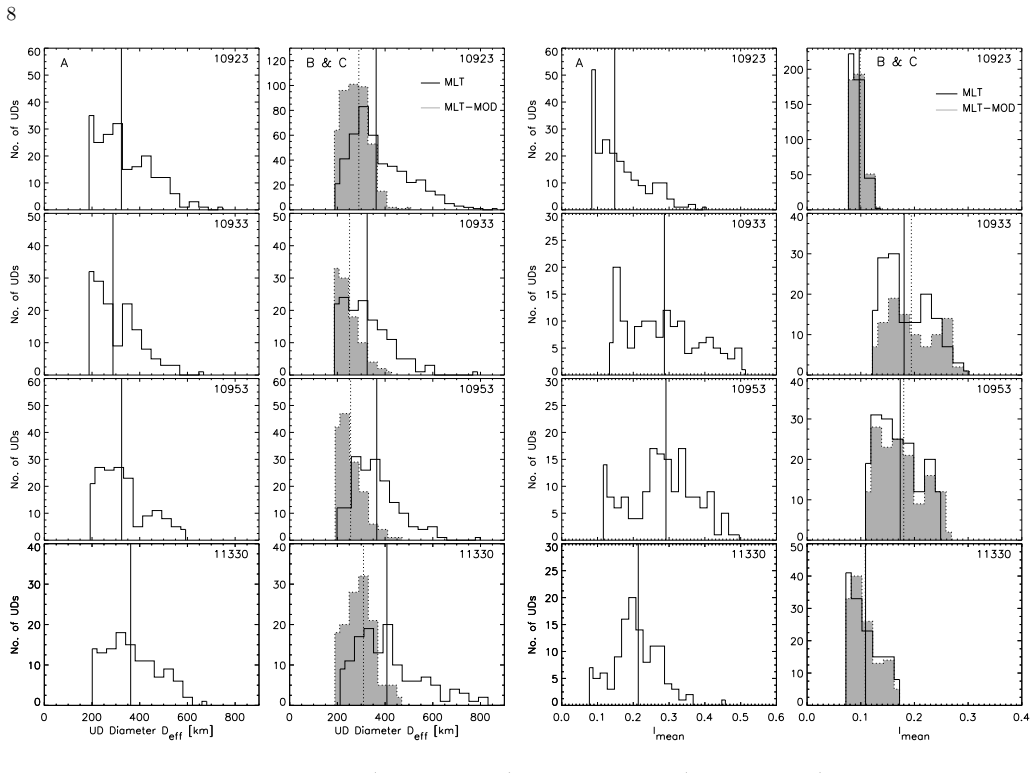
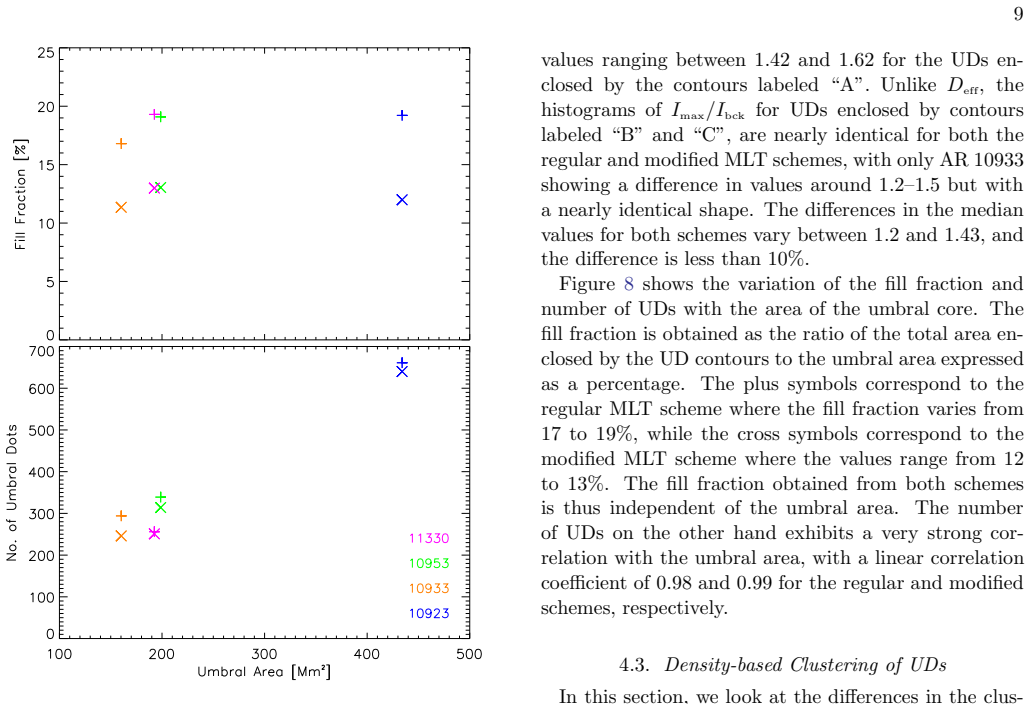
The modified multi-level tracking approach, which incorporates local intensity maxima and alters the threshold condition to enclose umbral dots, produces effective diameters with medians of 250-310 km, 70-90 km smaller than the regular method, corresponding to a UD fill fraction of 12-13% versus 17-19%, while mean intensity histograms and spatial clustering results are nearly identical.
What carries the argument
modified multi-level tracking (MLT) scheme that adds local intensity maxima and changes the threshold condition to enclose UDs without extending diffuse ones beyond their visual appearance
If this is right
- Effective diameters drop by 70-90 km on average.
- UD fill fraction falls to 12-13 percent.
- Mean intensity distributions of detected UDs remain essentially unchanged.
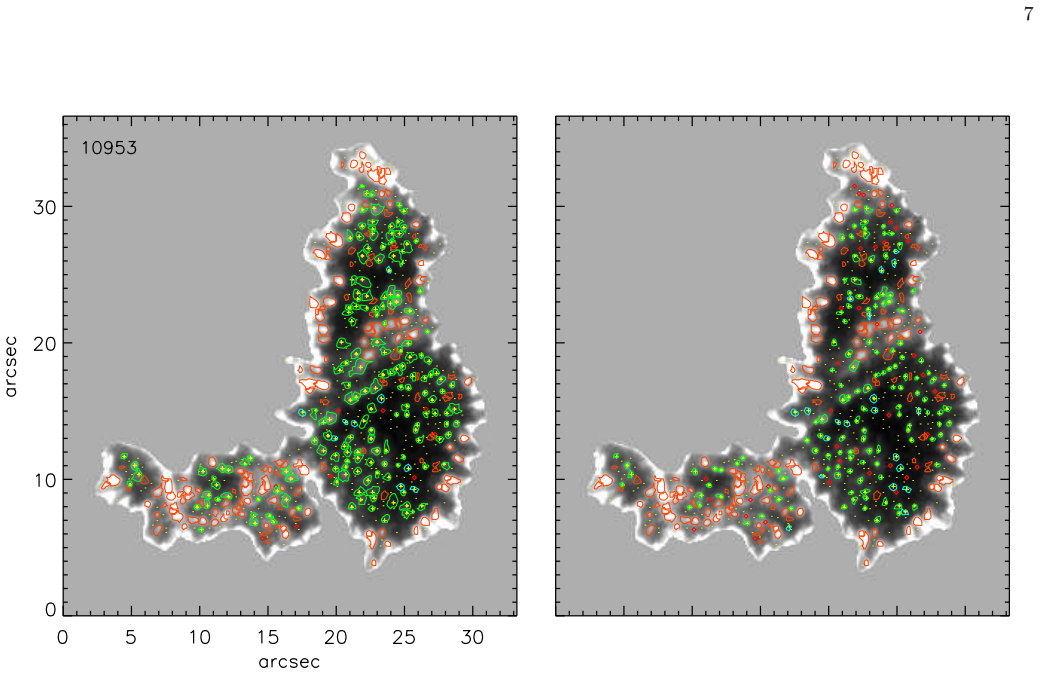
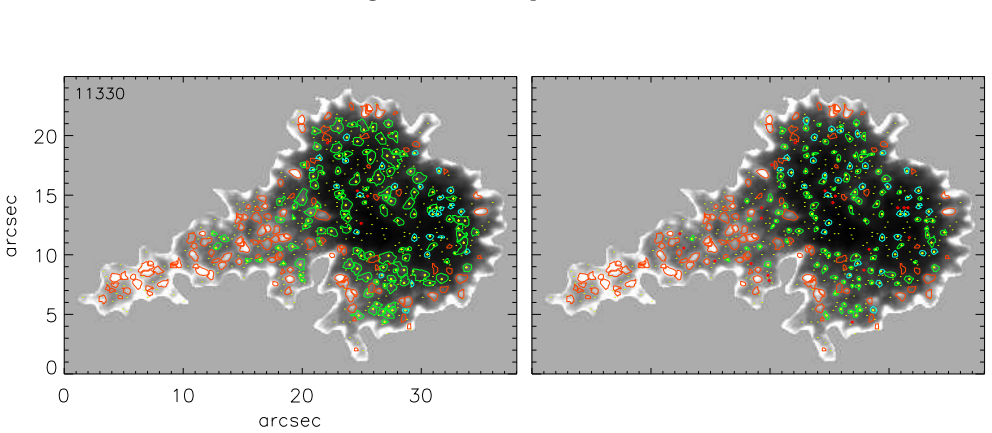
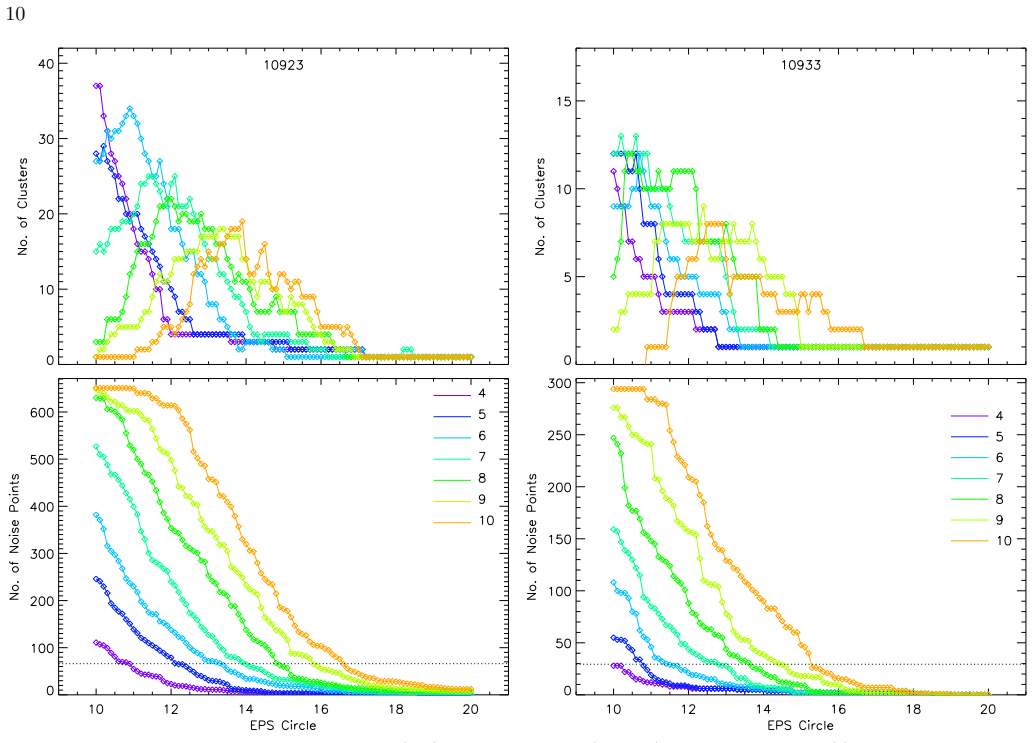
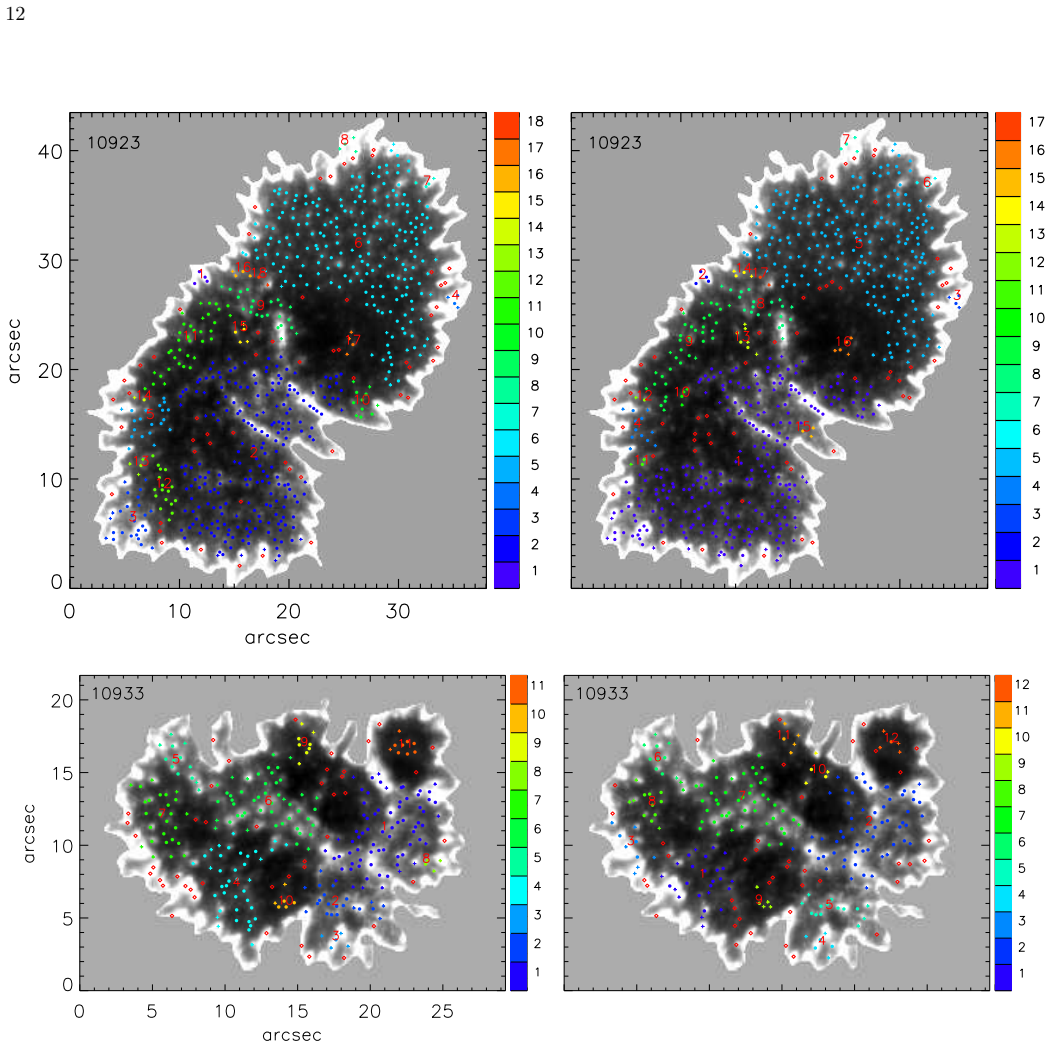
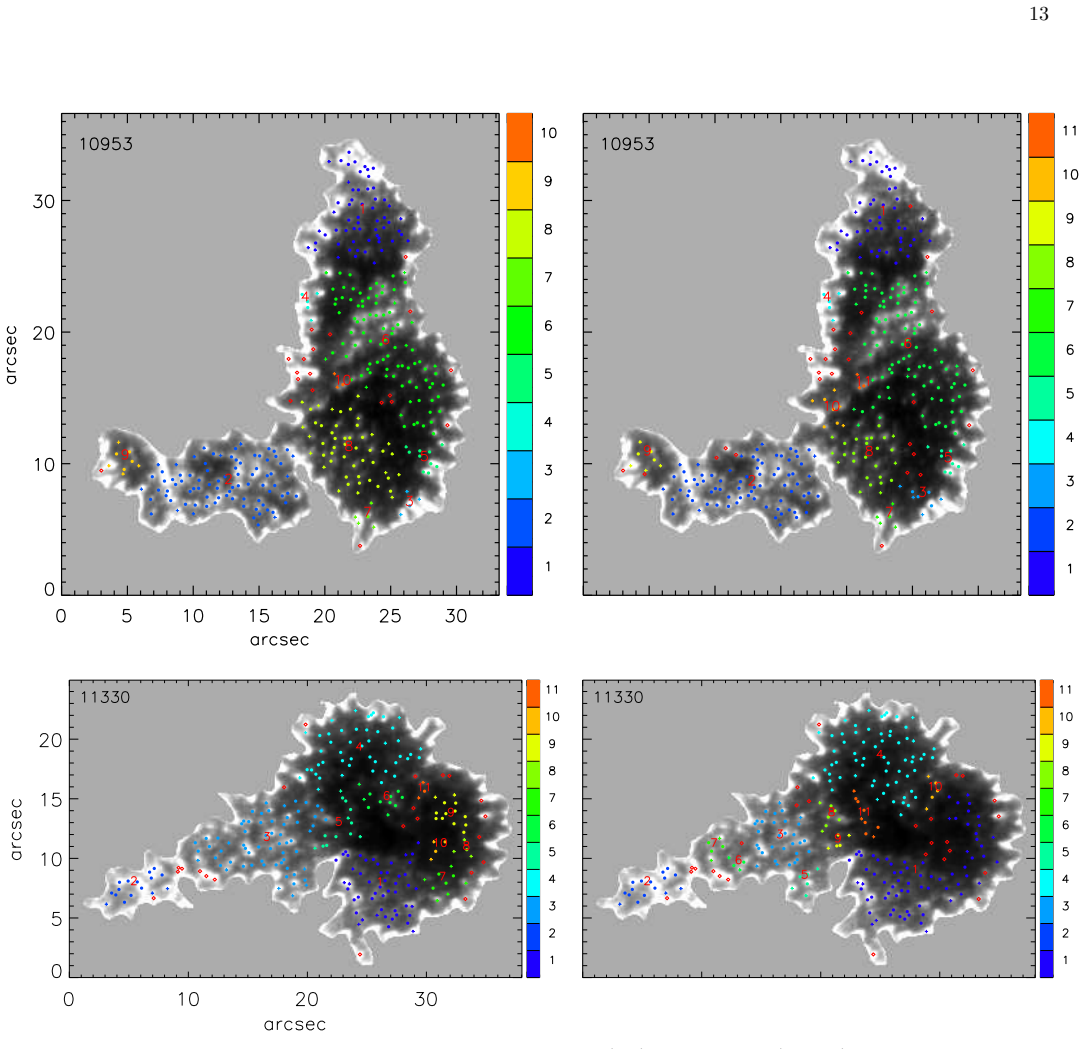
- Spatial clustering of UDs shows similar patterns, with concentrations near irregular umbral regions and faint light bridges.
Where Pith is reading between the lines
- The size reduction could lower estimates of total convective energy transport through the umbra in numerical models.
- Preferential clustering near light bridges implies that local magnetic field geometry influences where umbral dots form.
- Tracking how this clustering varies with sunspot age and complexity could link UD statistics to the overall magnetic evolution of the spot.
Load-bearing premise
The assumption that the revised threshold together with local intensity maxima correctly encloses each umbral dot so diffuse ones do not appear larger than they look.
What would settle it
Side-by-side visual comparison or manual boundary tracing on the same Hinode images to check whether the smaller detected sizes match the actual visual extent of diffuse umbral dots better than the regular method.
Figures

read the original abstract
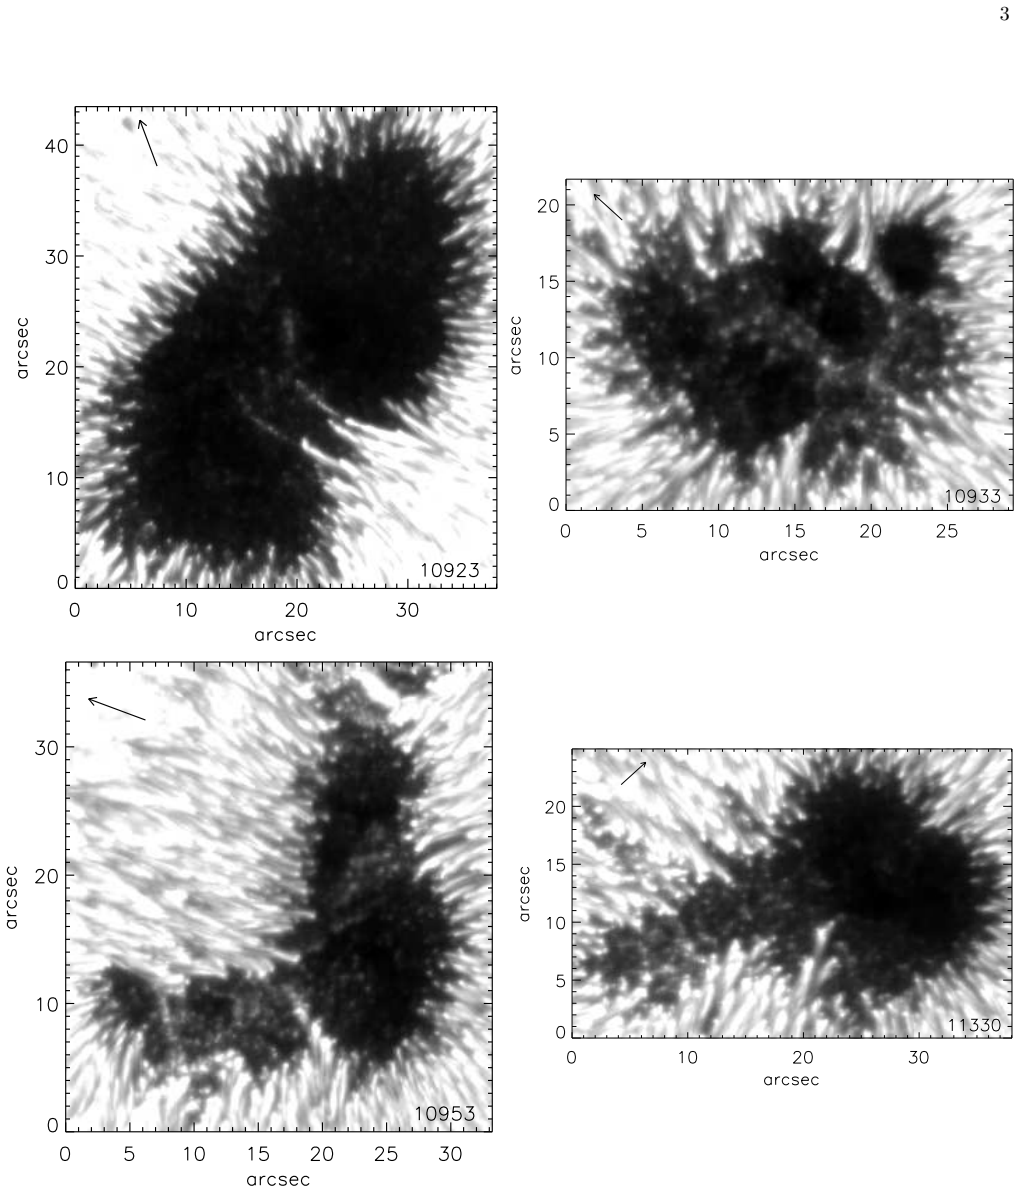
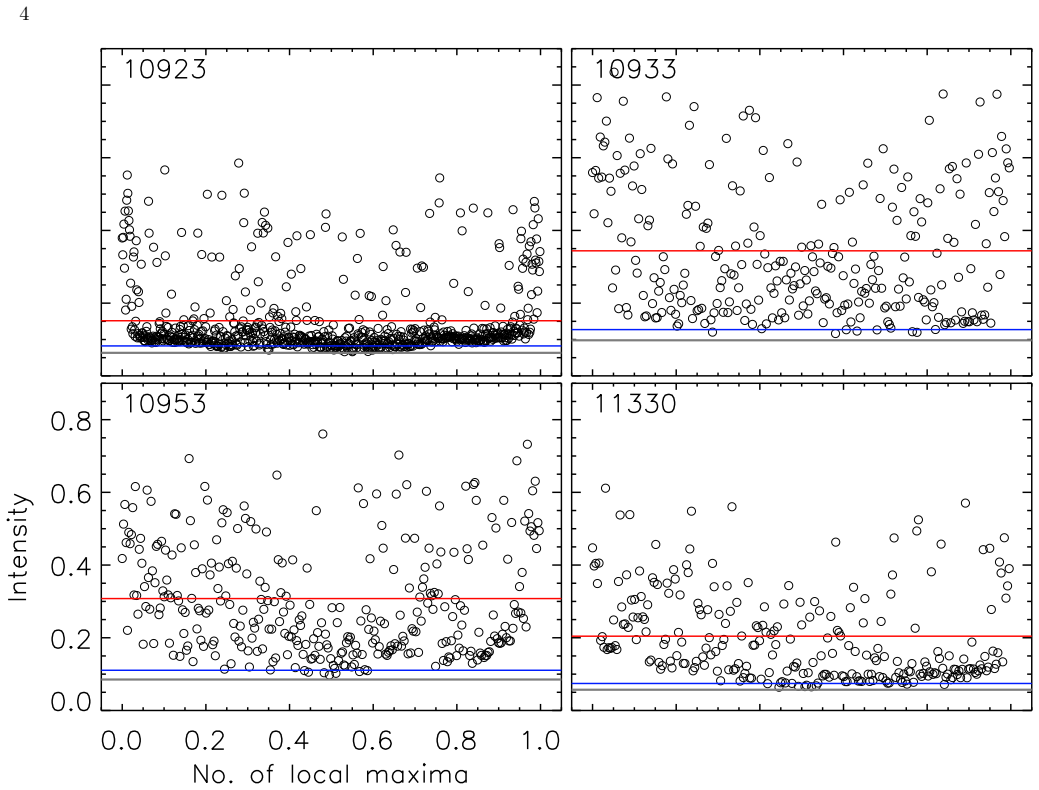
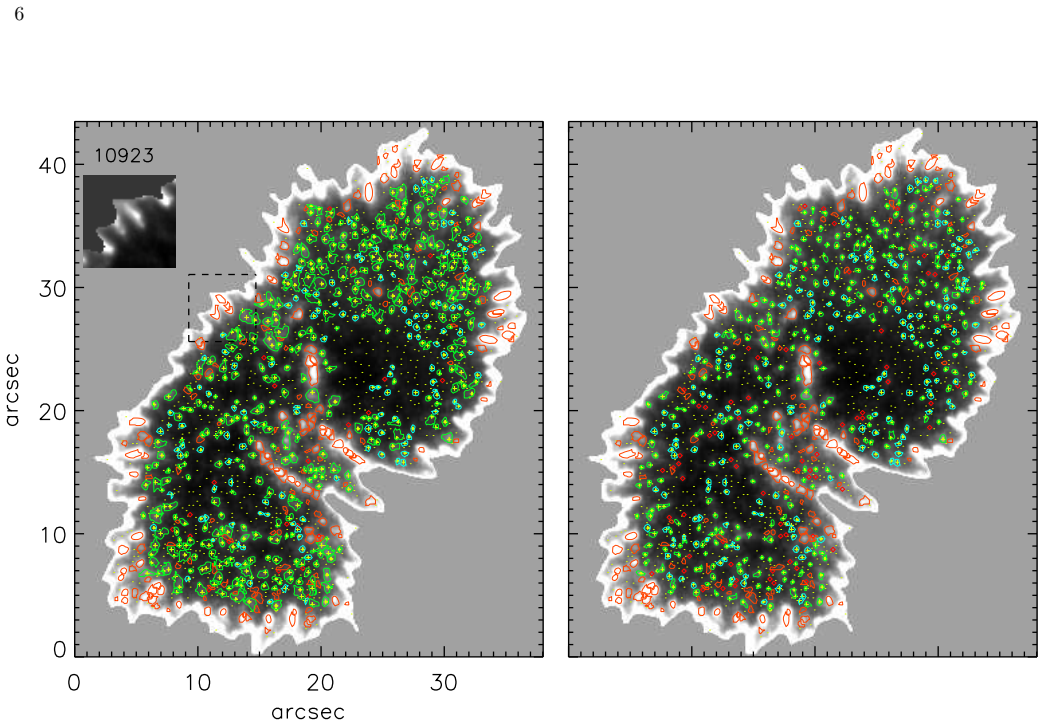
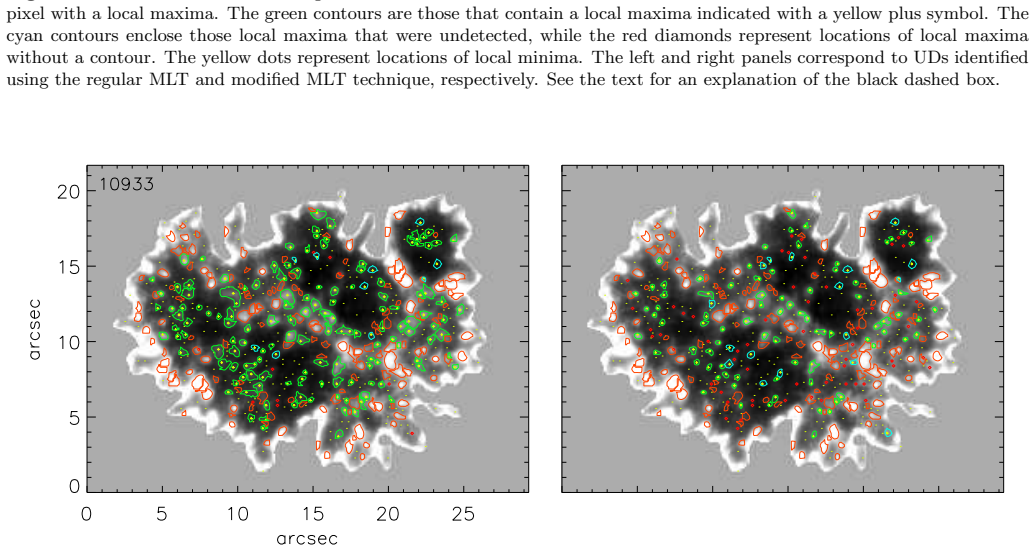
Umbral dots (UDs) are small-scale convective intrusions in the umbral core of sunspots and pores. Different methods have been used in the past to determine the physical properties of UDs. One of the methods typically used is multi-level tracking (MLT), which tags spatial structures at equi-spaced intensity levels from the highest level while progressing downward. A modified approach to the regular MLT is explored in this article that also uses the local intensity maxima with a change in the threshold condition to enclose a UD, such that diffuse UDs do not appear extended than they visually appear. The physical properties of UDs from these two MLT approaches are compared. The methods are implemented on high-resolution blue continuum images of four sunspots from the 50-cm Solar Optical Telescope on board Hinode. In addition, we introduce a density-based, spatial clustering routine for the first time to ascertain the differences resulting from the two tracking methods. The modified MLT approach yields an effective diameter with median values ranging from 250-310 km which is on average 70-90 km smaller than the regular MLT approach. The lower effective diameter in the modified method is associated with a reduced UD fill fraction of 12%-13% while the regular method yields 17-19%. However, these differences are still within the range of values cited by earlier works. On the other hand, the histogram of the mean intensity of UDs from both methods is nearly identical. The spatial clustering of UDs from both methods also shows very similar results. There is, however, a preferential spatial concentration of UDs, particularly at locations where the umbral core is highly irregular and in the vicinity of faint light bridges. The dependency of the localized clustering of UDs on the evolutionary phase of the sunspot and its magnetic complexity needs to be further explored.
Editorial analysis
A structured set of objections, weighed in public.
Referee Report
Summary. The paper proposes a modified multi-level tracking (MLT) method for detecting umbral dots (UDs) that adds local intensity maxima and alters the threshold condition to prevent diffuse UDs from appearing extended beyond their visual appearance. Applied to Hinode blue-continuum images of four sunspots, the modified MLT produces median effective diameters of 250-310 km (70-90 km smaller than standard MLT) and UD fill fractions of 12-13% (versus 17-19%), while mean intensity histograms and density-based spatial clustering results remain similar between methods. Differences are stated to lie within prior literature ranges.
Significance. If validated, the modification could refine UD size and fill-fraction measurements relevant to umbral convection studies, and the introduction of density-based clustering represents a useful methodological addition. The work is grounded in real high-resolution Hinode observations. However, because the reported differences remain inside the broad range of earlier studies, the overall advance is incremental rather than transformative.
major comments (3)
- [Abstract] Abstract (paragraph describing the modified approach): the specific change to the threshold condition is not quantified (no equation, numerical value, or selection criterion given), and no independent validation metric (overlap with manual contours, intensity-profile fitting, or comparison to another algorithm) is supplied to show that the new enclosure rule correctly bounds diffuse UDs rather than simply shrinking them by construction.
- [Abstract] Abstract (results paragraph): median effective diameters and fill fractions are reported as quantitative differences (70-90 km, 12-13% vs. 17-19%) without error bars, standard deviations, number of UDs per sunspot, or any statistical test of significance, leaving the central comparison only partially supported.
- [Abstract] Abstract (comparison to literature): the sole external check is that both methods yield values inside the broad literature range; this does not test whether the size reduction reflects improved boundary detection or is an artifact of the particular threshold choice.
minor comments (2)
- [Abstract] The abstract states that a density-based spatial clustering routine is introduced 'for the first time' but supplies neither a reference nor the algorithm parameters (e.g., epsilon, minPts) used.
- [Abstract] No information is given on how the four sunspots were selected or on their evolutionary phases, which could influence the reported spatial clustering preferences.
Simulated Author's Rebuttal
We thank the referee for the constructive feedback. We address the major comments point-by-point below and have revised the abstract accordingly to provide more quantitative information on the method and results.
read point-by-point responses
-
Referee: [Abstract] Abstract (paragraph describing the modified approach): the specific change to the threshold condition is not quantified (no equation, numerical value, or selection criterion given), and no independent validation metric (overlap with manual contours, intensity-profile fitting, or comparison to another algorithm) is supplied to show that the new enclosure rule correctly bounds diffuse UDs rather than simply shrinking them by construction.
Authors: The abstract provides a qualitative description of the modification. We will revise it to include the specific threshold condition (a numerical value based on local intensity maxima) used to enclose the UDs. Regarding validation, the manuscript relies on the consistency of intensity histograms and spatial clustering between methods as evidence that the modification improves boundary detection without arbitrary shrinking. We will add a brief explanation in the revised abstract and expand the methods section with the selection criterion. revision: yes
-
Referee: [Abstract] Abstract (results paragraph): median effective diameters and fill fractions are reported as quantitative differences (70-90 km, 12-13% vs. 17-19%) without error bars, standard deviations, number of UDs per sunspot, or any statistical test of significance, leaving the central comparison only partially supported.
Authors: We agree that additional statistical information would strengthen the abstract. In the revision, we will report the number of UDs analyzed for each sunspot and include the standard deviations for the median values. Due to space limitations in the abstract, detailed statistical tests will be presented in the main body of the paper, where they are already discussed. revision: yes
-
Referee: [Abstract] Abstract (comparison to literature): the sole external check is that both methods yield values inside the broad literature range; this does not test whether the size reduction reflects improved boundary detection or is an artifact of the particular threshold choice.
Authors: While the literature range provides context, the key support for the modification comes from the direct comparison of the two MLT methods on the same data, showing reduced sizes but unchanged intensity and clustering properties. This suggests the change specifically addresses diffuse UDs. We will revise the abstract to emphasize this internal validation and discuss the threshold selection process to address potential artifacts. revision: yes
Circularity Check
No significant circularity; results are direct algorithmic outputs on shared images
full rationale
The paper applies two variants of the multi-level tracking algorithm (regular MLT vs. modified MLT with altered threshold plus local maxima) to the same Hinode blue-continuum images and reports the resulting statistics on diameter, fill fraction, intensity, and clustering. No equations, fitted parameters, self-citations, or ansatzes are described that would make the reported median diameters (250-310 km) or fill fractions reduce to the input choices by construction. The modified method is explicitly designed to produce smaller enclosures for diffuse UDs; the observed difference is therefore an expected empirical outcome of the change rather than a circular derivation. The new density-based clustering routine is introduced independently and yields similar spatial results for both methods.
Axiom & Free-Parameter Ledger
free parameters (1)
- threshold condition
axioms (2)
- domain assumption Local intensity maxima correspond to the centers of umbral dots
- domain assumption Hinode blue continuum images accurately capture the intensity structure of sunspot umbrae at the relevant spatial scales
Reference graph
Works this paper leans on
-
[1]
1993, Pattern Recognition, 26, 375, doi: 10.1016/0031-3203(93)90045-X
Poeckert, R. 1993, Pattern Recognition, 26, 375, doi: 10.1016/0031-3203(93)90045-X
-
[2]
Beckers, J. M., & Schr¨ oter, E. H. 1968, SoPh, 4, 303, doi: 10.1007/BF00149561
-
[3]
2010, A&A, 510, A12, doi: 10.1051/0004-6361/200913328
Bharti, L., Beeck, B., & Sch¨ ussler, M. 2010, A&A, 510, A12, doi: 10.1051/0004-6361/200913328
-
[4]
1941, Vierteljahresschrift der Astronomisch en Gesellschaft, 76, 194
Biermann, L. 1941, Vierteljahresschrift der Astronomisch en Gesellschaft, 76, 194
1941
-
[5]
2001, SoPh, 201, 13, doi: 10.1023/A:1010344827952
Bovelet, B., & Wiehr, E. 2001, SoPh, 201, 13, doi: 10.1023/A:1010344827952
-
[6]
Chitre, S. M. 1963, MNRAS, 126, 431, doi: 10.1093/mnras/126.5.431
-
[7]
Choudhuri, A. R. 1986, ApJ, 302, 809, doi: 10.1086/164042
-
[8]
Danielson, R. E. 1964, ApJ, 139, 45, doi: 10.1086/147738
-
[9]
1965, ApJ, 141, 548, doi: 10.1086/148144
Deinzer, W. 1965, ApJ, 141, 548, doi: 10.1086/148144
-
[10]
Gough, D. O., & Tayler, R. J. 1966, MNRAS, 133, 85, doi: 10.1093/mnras/133.1.85
-
[11]
Grossmann-Doerth, U., Schmidt, W., & Schroeter, E. H. 1986, A&A, 156, 347
1986
-
[12]
2008, SoPh, 250, 17, doi: 10.1007/s11207-008-9201-0
Hamedivafa, H. 2008, SoPh, 250, 17, doi: 10.1007/s11207-008-9201-0
-
[13]
2007, SoPh, 243, 3, doi: 10.1007/s11207-007-9014-6
Kosugi, T., Matsuzaki, K., Sakao, T., et al. 2007, SoPh, 243, 3, doi: 10.1007/s11207-007-9014-6
-
[14]
Liao, P.-S., Chen, T.-S., Chung, P.-C., et al. 2001, J. Inf. Sci. Eng., 17, 713
2001
-
[15]
E., Bray, R
Loughhead, R. E., Bray, R. J., & Tappere, E. J. 1979, A&A, 79, 128 15
1979
-
[16]
Louis, R. E., Mathew, S. K., Bellot Rubio, L. R., et al. 2012, ApJ, 752, 109, doi: 10.1088/0004-637X/752/2/109
-
[17]
Louis, R. E., Mathew, S. K., & Raja Bayanna, A. 2024, Advances in Space Research, 73, 3256, doi: 10.1016/j.asr.2023.12.046
-
[18]
Ortiz, A., Bellot Rubio, L. R., & Rouppe van der Voort, L. 2010, ApJ, 713, 1282, doi: 10.1088/0004-637X/713/2/1282
-
[19]
Otsu, N. 1979, IEEE Transactions on Systems, Man, and Cybernetics, 9, 62, doi: 10.1109/TSMC.1979.4310076
-
[20]
Parker, E. N. 1979, ApJ, 234, 333, doi: 10.1086/157501
-
[21]
2011, ApJ, 729, 5, doi: 10.1088/0004-637X/729/1/5
Rempel, M. 2011, ApJ, 729, 5, doi: 10.1088/0004-637X/729/1/5
-
[22]
Rempel, M., Sch¨ ussler, M., Cameron, R. H., & Kn¨ olker, M. 2009, Science, 325, 171, doi: 10.1126/science.1173798 Riethm¨ uller, T. L., Solanki, S. K., Zakharov, V., &
-
[23]
2008, A&A, 492, 233, doi: 10.1051/0004-6361:200810701
Gandorfer, A. 2008, A&A, 492, 233, doi: 10.1051/0004-6361:200810701
-
[24]
Rimmele, T. 2008, ApJ, 672, 684, doi: 10.1086/523702 Sainz Dalda, A., de la Cruz Rodr ´ ıguez, J., De Pontieu, B., & Goˇ si´ c, M. 2019, ApJL, 875, L18, doi: 10.3847/2041-8213/ab15d9 Sch¨ ussler, M., & V¨ ogler, A. 2006, ApJL, 641, L73, doi: 10.1086/503772
-
[25]
2009, ApJ, 694, 1080, doi: 10.1088/0004-637X/694/2/1080
Sobotka, M., & Jurˇ c´ ak, J. 2009, ApJ, 694, 1080, doi: 10.1088/0004-637X/694/2/1080
-
[26]
Sobotka, M., & Puschmann, K. G. 2009, A&A, 504, 575, doi: 10.1051/0004-6361/200912365
-
[27]
2002, A&A, 388, 1048, doi: 10.1051/0004-6361:20020542
Tritschler, A., & Schmidt, W. 2002, A&A, 388, 1048, doi: 10.1051/0004-6361:20020542
-
[28]
2008, SoPh, 249, 167, doi: 10.1007/s11207-008-9174-z Viticchi´ e, B., & S´ anchez Almeida, J
Tsuneta, S., Ichimoto, K., Katsukawa, Y., et al. 2008, SoPh, 249, 167, doi: 10.1007/s11207-008-9174-z Viticchi´ e, B., & S´ anchez Almeida, J. 2011, A&A, 530, A14, doi: 10.1051/0004-6361/201016096
-
[29]
R., de la Cruz Rodr ´ ıguez, J., & Rouppe van der Voort, L
Watanabe, H., Bellot Rubio, L. R., de la Cruz Rodr ´ ıguez, J., & Rouppe van der Voort, L. 2012, ApJ, 757, 49, doi: 10.1088/0004-637X/757/1/49
-
[30]
2009, ApJ, 702, 1048, doi: 10.1088/0004-637X/702/2/1048
Watanabe, H., Kitai, R., & Ichimoto, K. 2009, ApJ, 702, 1048, doi: 10.1088/0004-637X/702/2/1048
-
[31]
Proctor, M. R. E. 1990, MNRAS, 245, 434, doi: 10.1093/mnras/245.3.434
-
[32]
Yadav, R., Louis, R. E., & Mathew, S. K. 2018, ApJ, 855, 8, doi: 10.3847/1538-4357/aaaeba
discussion (0)
Sign in with ORCID, Apple, or X to comment. Anyone can read and Pith papers without signing in.