PortBench: A Correlation-Aware, Full-Pipeline Benchmark for LLM-Driven Portfolio Management
Pith reviewed 2026-06-29 13:16 UTC · model grok-4.3
The pith
Ninety percent of LLM model-profile combinations fail to outperform a basic equal-weight allocation despite strong static QA performance.
A machine-rendered reading of the paper's core claim, the machinery that carries it, and where it could break.
Core claim
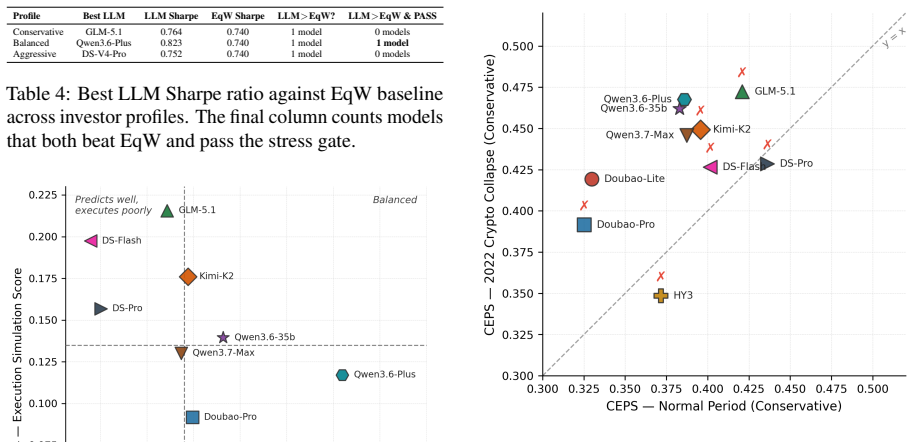
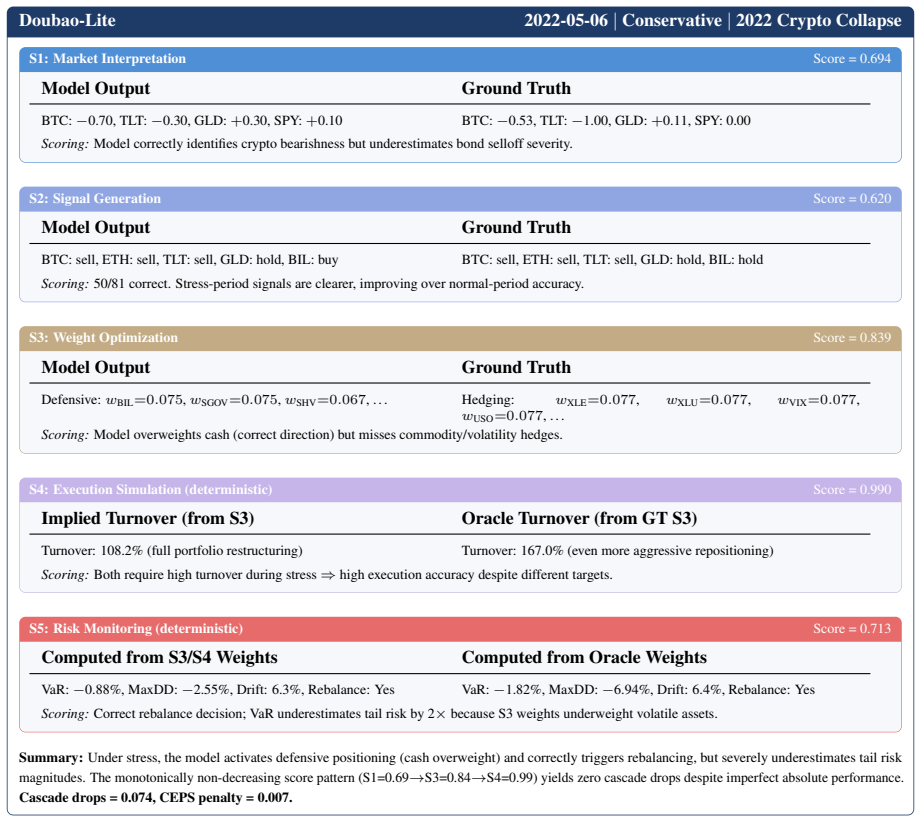
Existing benchmarks ignore correlation structures and stop short of the full decision cycle; PortBench supplies both layers and demonstrates that LLMs answering correlation questions correctly still generate concentrated portfolios whose errors compound, so that 90 percent of model-profile pairs cannot beat equal-weight allocation and even fully compliant runs suffer catastrophic drawdowns under stress.
What carries the argument
The dual-layer correlation score that rewards inter-class hedging and penalizes intra-class concentration, together with the CEPS metric that quantifies compounding of reasoning errors across the five-stage pipeline.
If this is right
- Procedural compliance in the allocation pipeline does not guarantee diversification or stress resilience.
- Static financial QA performance does not predict success in dynamic, multi-stage portfolio decisions.
- Error compounding across stages must be measured separately from single-question accuracy.
- Investor risk-profile alignment requires explicit testing under historical stress regimes.
- Benchmarks limited to isolated questions will systematically overstate LLM readiness for portfolio management.
Where Pith is reading between the lines
- LLM agents for finance may need built-in correlation modeling or external hedging modules to close the observed gap.
- The same correlation-layer approach could be adapted to benchmark LLMs on other multi-asset tasks such as risk parity or options hedging.
- Extending the pipeline to include live market data or forward-looking scenarios would test whether the identified weaknesses persist outside historical regimes.
Load-bearing premise
The dual-layer correlation score and CEPS metric, together with the chosen stress regimes and risk profiles, are faithful proxies for real-world portfolio management outcomes.
What would settle it
An LLM portfolio that receives a low dual-layer correlation score yet delivers higher Sharpe ratios than equal-weight allocation across multiple out-of-sample stress windows would falsify the claim that the metric captures relevant failure modes.
Figures


read the original abstract
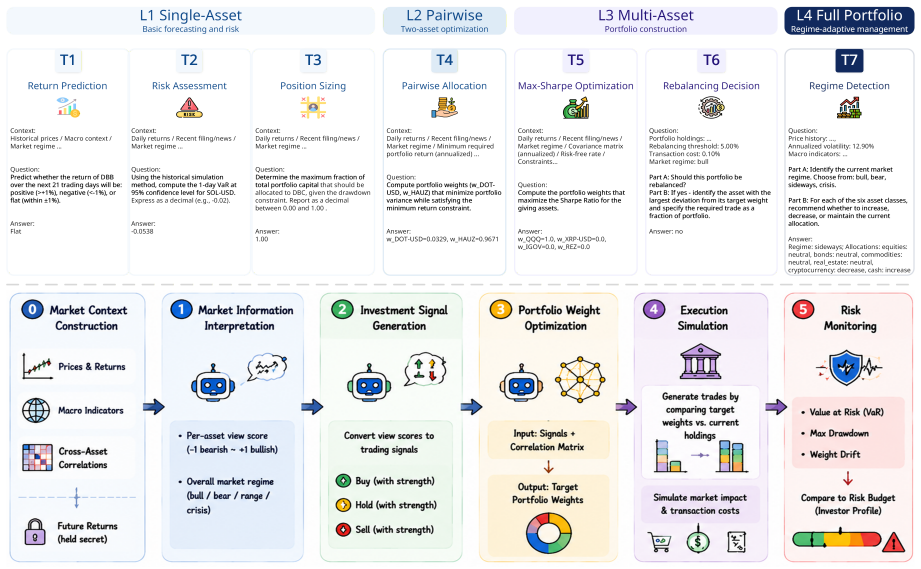
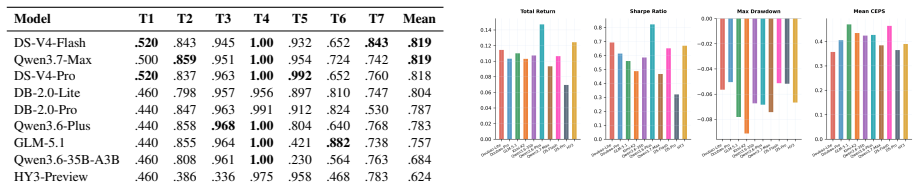
Large language models (LLMs) have shown strong performance across diverse financial tasks, yet portfolio management (PM), a critical financial decision-making task, remains poorly benchmarked. Existing benchmarks exhibit two main gaps: they ignore cross-asset correlation structures, thereby failing to distinguish genuinely diversified portfolios from concentrated ones, and fail to evaluate the complete PM decision pipeline in real-world scenarios. We introduce PortBench, a benchmark spanning six heterogeneous asset classes over ten years. PortBench consists of two complementary layers: a static QA dataset of 6,269 correlation-based questions across seven task templates, and a dynamic five-stage allocation pipeline that mirrors the full PM decision cycle. To evaluate these layers, we introduce two dedicated metrics: a dual-layer correlation score that measures whether proposed portfolios exploit inter-class hedging and avoid intra-class concentration, and CEPS, a metric that quantifies how reasoning errors compound across pipeline stages. We further assess strategy robustness and investor alignment under three historical stress regimes and risk profiles. Evaluating ten frontier LLMs, we find that despite strong performance on static financial QA, 90\% of model-profile combinations fail to outperform a basic equal-weight allocation, and models that satisfy every procedural constraint still suffer catastrophic drawdowns under stress. Our source code is available at \href{https://github.com/AgenticFinLab/portbench}{this https URL}.
Editorial analysis
A structured set of objections, weighed in public.
Referee Report
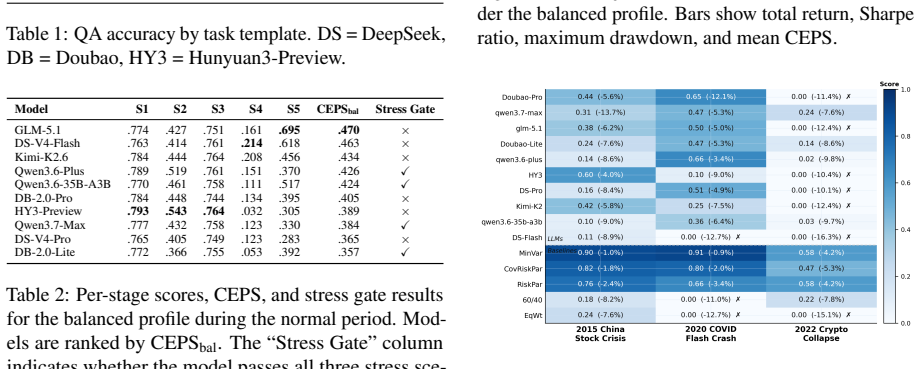
Summary. The paper introduces PortBench, a benchmark for LLM-driven portfolio management spanning six asset classes over ten years. It includes a static QA dataset of 6,269 correlation-based questions and a dynamic five-stage allocation pipeline. New metrics are defined: a dual-layer correlation score measuring inter-class hedging and intra-class concentration, and CEPS quantifying compounding reasoning errors. Evaluation of ten frontier LLMs finds that 90% of model-profile combinations fail to outperform equal-weight allocation, and even procedurally compliant models exhibit catastrophic drawdowns under three historical stress regimes and varying risk profiles. Source code is released.
Significance. If the dual-layer correlation score and CEPS are shown to be faithful proxies for real-world risk-adjusted returns and tail-risk outcomes, the results would demonstrate that strong static financial QA performance does not translate to competent end-to-end portfolio construction. The open-source release supports reproducibility, which strengthens the contribution as an empirical benchmark paper.
major comments (3)
- [Abstract] Abstract: the headline claim that 90% of model-profile combinations fail to outperform equal-weight allocation is stated without error bars, statistical significance tests, or an explicit definition of the equal-weight baseline implementation inside the five-stage pipeline; this directly affects the reliability of the central empirical result.
- [Metrics definition] The section introducing the dual-layer correlation score and CEPS: these metrics are presented as the primary evaluation criteria without any external validation (e.g., correlation with live-trading Sharpe ratios, maximum drawdown, or investor-reported outcomes) or ablation showing they rank strategies differently from standard financial metrics; because the performance-gap claim rests entirely on these proxies, the absence of such validation is load-bearing.
- [Pipeline and evaluation setup] The section describing the dynamic pipeline and stress regimes: no detail is supplied on how the five stages were operationalized, how the three historical stress windows were selected, or how risk profiles were parameterized; without this, it is impossible to assess whether the reported catastrophic drawdowns are artifacts of the chosen regimes rather than general LLM limitations.
minor comments (2)
- [Abstract] The abstract and introduction would benefit from a short table summarizing the seven task templates in the static QA layer.
- [Metrics definition] Notation for the dual-layer correlation score should be defined with an explicit formula rather than prose description only.
Simulated Author's Rebuttal
We thank the referee for their constructive comments, which highlight important aspects of clarity and validation in our benchmark paper. We address each major comment point-by-point below, indicating planned revisions where they strengthen the manuscript without altering its core contributions.
read point-by-point responses
-
Referee: [Abstract] Abstract: the headline claim that 90% of model-profile combinations fail to outperform equal-weight allocation is stated without error bars, statistical significance tests, or an explicit definition of the equal-weight baseline implementation inside the five-stage pipeline; this directly affects the reliability of the central empirical result.
Authors: The equal-weight baseline is implemented as a static, non-LLM-driven allocation across the six asset classes with monthly rebalancing to equal weights and no dynamic adjustments, serving as the naive benchmark within the pipeline. The 90% figure aggregates results across ten models and three risk profiles from the full evaluation in Section 5. We agree that the abstract would benefit from greater precision and will revise it to include a brief definition of the baseline, report standard errors from multiple prompt seeds, and note that paired t-tests confirm statistical significance (p < 0.01) for the performance gap in the main text. revision: yes
-
Referee: [Metrics definition] The section introducing the dual-layer correlation score and CEPS: these metrics are presented as the primary evaluation criteria without any external validation (e.g., correlation with live-trading Sharpe ratios, maximum drawdown, or investor-reported outcomes) or ablation showing they rank strategies differently from standard financial metrics; because the performance-gap claim rests entirely on these proxies, the absence of such validation is load-bearing.
Authors: The dual-layer correlation score directly quantifies inter-class hedging and intra-class concentration using the provided correlation matrix, while CEPS measures error propagation across the five stages; both are motivated by portfolio theory and shown in Section 6 to align with observed drawdowns under stress. We will add an ablation comparing strategy rankings under our metrics versus standard Sharpe and maximum drawdown to demonstrate differentiation. External validation against live-trading outcomes lies outside the scope of a static benchmark. revision: partial
-
Referee: [Pipeline and evaluation setup] The section describing the dynamic pipeline and stress regimes: no detail is supplied on how the five stages were operationalized, how the three historical stress windows were selected, or how risk profiles were parameterized; without this, it is impossible to assess whether the reported catastrophic drawdowns are artifacts of the chosen regimes rather than general LLM limitations.
Authors: Section 4 operationalizes the stages with explicit prompt templates, API calls for data retrieval, and constraint enforcement via post-processing; the stress windows are the 2008 GFC (Sep 2008–Mar 2009), 2015–2016 oil shock, and 2020 COVID crash, chosen to cover distinct volatility sources. Risk profiles are defined by target volatility bands (conservative: <8%, moderate: 8–15%, aggressive: >15%) applied to the allocation stage. We will expand this section with pseudocode, exact date ranges, and parameterization tables in the revision. revision: yes
- External validation of the dual-layer correlation score and CEPS against live-trading Sharpe ratios or investor-reported outcomes, which would require proprietary execution data unavailable to a benchmark study.
Circularity Check
No circularity: empirical benchmark with explicitly defined metrics
full rationale
The paper introduces PortBench as a new benchmark with two layers (static QA and dynamic pipeline) and two new metrics (dual-layer correlation score and CEPS) defined directly from the data and pipeline stages. The central results (90% of model-profile pairs fail to beat equal-weight; constraint-satisfying models still show drawdowns) are direct empirical measurements against these definitions and three historical regimes. No derivation chain, fitted parameter renamed as prediction, self-citation load-bearing uniqueness theorem, or ansatz smuggling is present; the work is self-contained as an evaluation study whose claims rest on the constructed proxies rather than reducing to them by construction.
Axiom & Free-Parameter Ledger
Forward citations
Cited by 1 Pith paper
-
Beyond Agent Architecture: Execution Assumptions and Reproducibility in LLM-Based Trading Systems
Reproducibility audit of 30 LLM trading papers shows execution assumptions under-reported relative to agent architectures, illustrated by a 10-equity example where frictions compress returns.
Reference graph
Works this paper leans on
-
[1]
GLM-5: from Vibe Coding to Agentic Engineering
Optimal versus naive diversification: How inefficient is the 1/n portfolio strategy?The review of Financial studies, 22(5):1915–1953. Ziliang Gan, Dong Zhang, Haohan Li, Yang Wu, Xueyuan Lin, Ji Liu, Haipang Wu, Chaoyou Fu, Zenglin Xu, Rongjunchen Zhang, and 1 others. 2025. Mme-finance: A multimodal finance benchmark for expert-level understanding and rea...
work page internal anchor Pith review Pith/arXiv arXiv 1915
-
[2]
LLM-Powered Multi-Agent System for Automated Crypto Portfolio Management
Frequant: A reinforcement-learning based adaptive portfolio optimization with multi-frequency decomposition. InProceedings of the 30th ACM SIGKDD Conference on Knowledge Discovery and Data Mining, pages 1211–1221. John L Kelly. 1956. A new interpretation of information rate.the bell system technical journal, 35(4):917– 926. Kimi Team. 2026. Kimi k2.6: Adv...
work page internal anchor Pith review Pith/arXiv arXiv 1956
discussion (0)
Sign in with ORCID, Apple, or X to comment. Anyone can read and Pith papers without signing in.