JWST's Dusty Blue BOAT -- GRB 221009A
Pith reviewed 2026-06-29 10:15 UTC · model grok-4.3
The pith
Joint DSBPL fit to GRB 221009A spectra gives A_V = 4.40 and β = 0.447, implying p = 1.89
A machine-rendered reading of the paper's core claim, the machinery that carries it, and where it could break.
Core claim
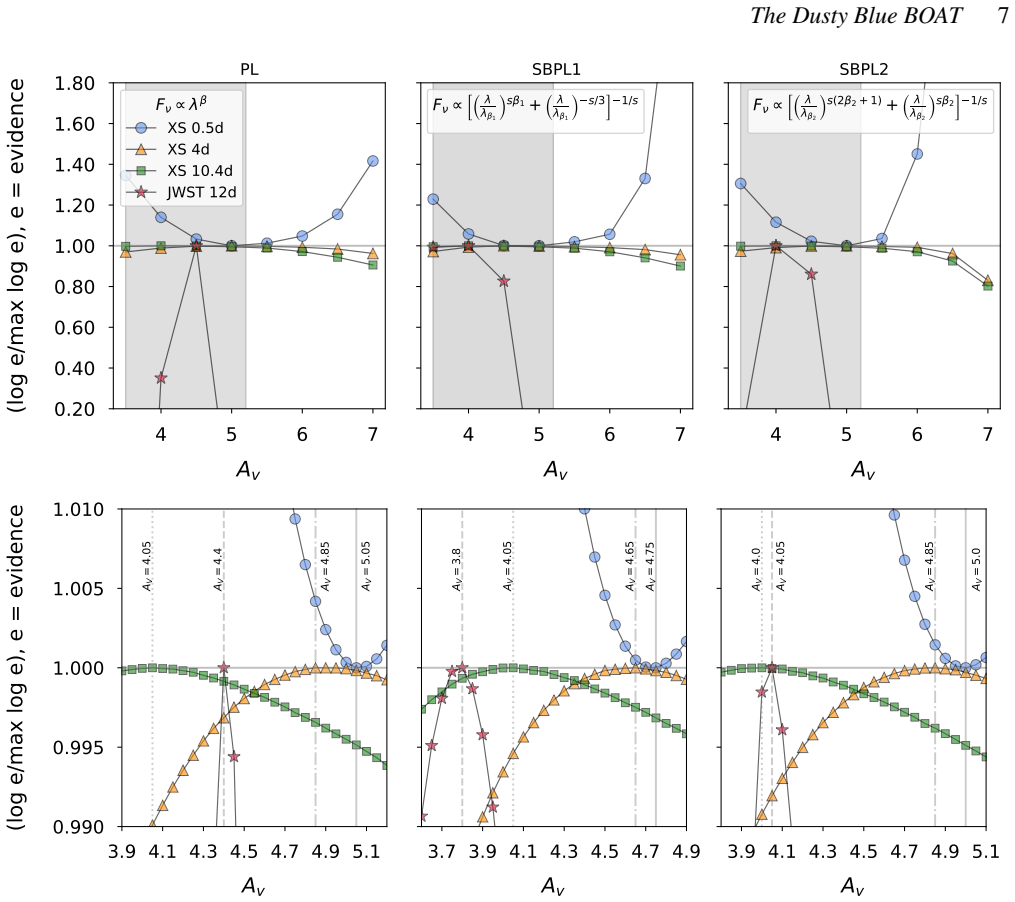
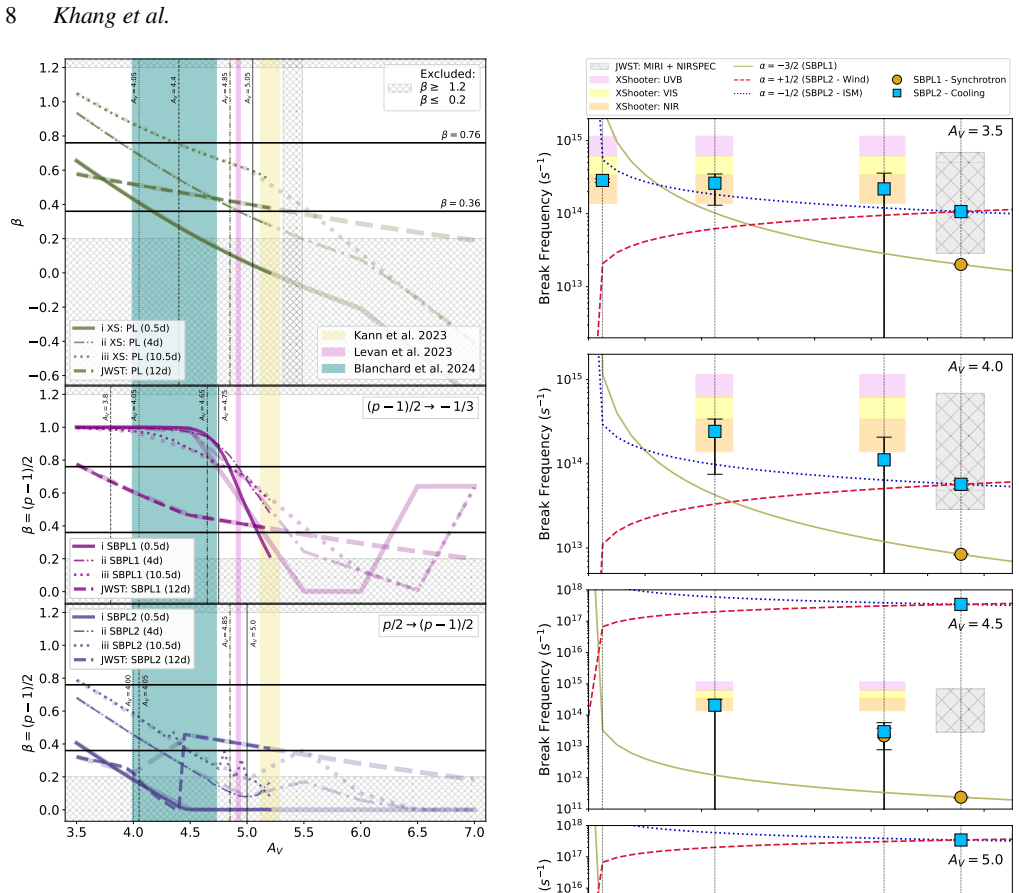
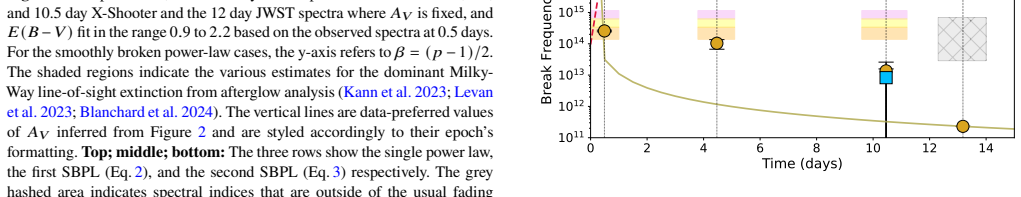
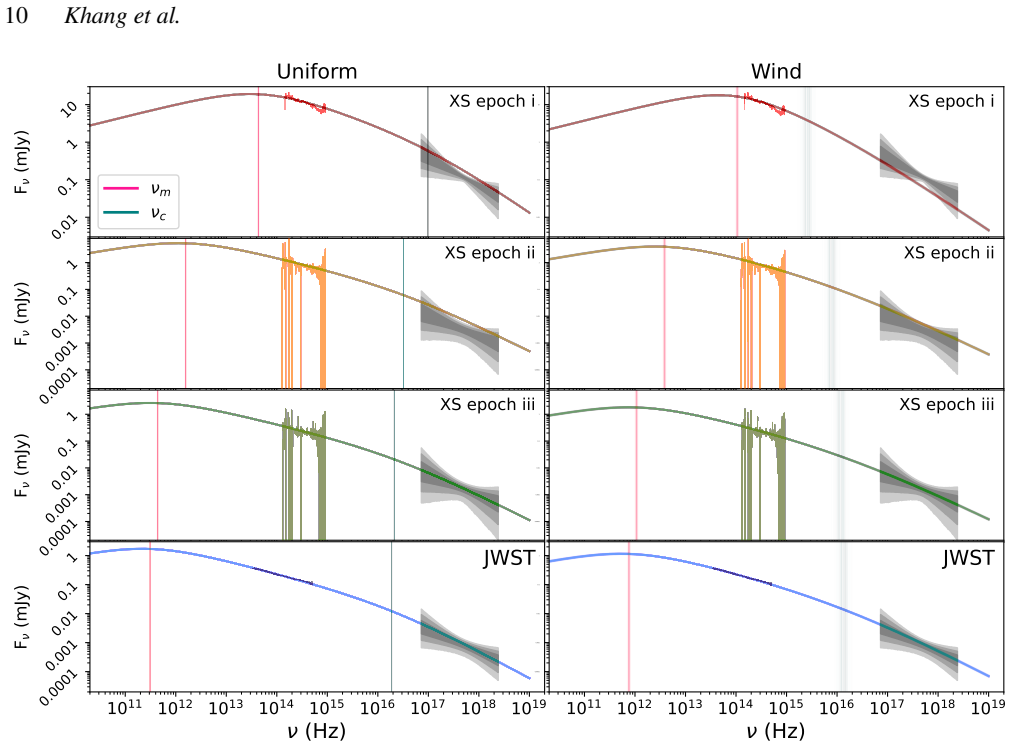
Our analysis reveals a strong degeneracy between the assumed extinction and the inferred intrinsic spectral index, particularly in the optical, explaining the diversity of previous results. The joint DSBPL fit yields a total line-of-sight extinction of A_V = 4.40 ± 0.01 and a blue continuum, with an intrinsic spectral index of β = 0.447 ± 0.001. Although marginally preferred by the spectral fits, a wind medium can be rejected by the temporal evolution of the afterglow light curve. The fit spectral index and temporal decline are only consistent with a uniform density medium if an early jet break at ∼ 0.5-1.0 days is invoked. Our results imply a hard electron distribution index of p = 1.89 < 2
What carries the argument
The double smoothly broken power-law (DSBPL) model fitted jointly to all epochs, which resolves the degeneracy between extinction and spectral index
If this is right
- The spectral index and temporal decline are only consistent with a uniform density medium if an early jet break at ∼0.5-1.0 days is invoked
- A wind medium is rejected by the temporal evolution of the afterglow light curve
- The implied electron distribution index is p = 1.89, which is less than 2
- A narrow, energetic jet core dominates the early optical-to-X-ray emission
Where Pith is reading between the lines
- Confirmation of p less than 2 would require revisions to standard diffusive shock acceleration to allow harder particle spectra
- Similar high-extinction GRBs may need joint multi-epoch modeling to avoid the extinction-spectral index degeneracy seen here
- The suggested early jet break time could be directly tested with dense photometric monitoring between 0.3 and 2 days post-burst
Load-bearing premise
A single family of double smoothly broken power-law spectra plus standard extinction fully describes the intrinsic emission from optical through mid-infrared across all epochs without additional spectral components or time-dependent changes in the extinction law
What would settle it
A measured temporal decay index inconsistent with the value predicted for p = 1.89 in a uniform-density medium with a jet break at 0.5-1 day, or the detection of spectral components not captured by the DSBPL model
Figures


read the original abstract
GRB 221009A, the Brightest Of All Time (BOAT), presents a challenge for afterglow modelling due to its low Galactic latitude and consequent high line-of-sight extinction. This has led to a wide range of conflicting values for the optical spectral index and dust extinction in the literature. We present a re-analysis of the afterglow spectra, using VLT X-Shooter data at 0.5, 4, and 10.5 days, and JWST NIRSpec$/$MIRI data at 13.3 days post-burst. We fit the data with single and smoothly broken power-law models and perform a joint fit with a double smoothly broken power-law (DSBPL) across all epochs. Our analysis reveals a strong degeneracy between the assumed extinction and the inferred intrinsic spectral index, particularly in the optical, explaining the diversity of previous results. The joint DSBPL fit yields a total line-of-sight extinction of $A_{V} = 4.40 \pm 0.01$ and a blue continuum, with an intrinsic spectral index of $\beta = 0.447 \pm 0.001$. Although marginally preferred by the spectral fits, a wind medium can be rejected by the temporal evolution of the afterglow light curve. The fit spectral index and temporal decline are only consistent with a uniform density medium if an early jet break at $\sim 0.5-1.0$ days is invoked. Our results imply a hard electron distribution index of $p = 1.89 < 2$, challenging standard particle acceleration models and suggesting a narrow, energetic jet core dominates the early optical-to-X-ray emission.
Editorial analysis
A structured set of objections, weighed in public.
Referee Report
Summary. The manuscript re-analyzes the afterglow of GRB 221009A using VLT X-Shooter spectra at 0.5, 4 and 10.5 days plus JWST NIRSpec/MIRI data at 13.3 days. It identifies a strong A_V–β degeneracy in optical fits, performs single and smoothly broken power-law modeling, and reports a joint double smoothly broken power-law (DSBPL) fit across all epochs that yields total line-of-sight extinction A_V = 4.40 ± 0.01 and intrinsic spectral index β = 0.447 ± 0.001. From the latter it derives an electron index p = 1.89 < 2, rejects a wind medium on temporal grounds, and requires an early jet break in a uniform-density medium; the result is interpreted as evidence that a narrow, energetic jet core dominates the early optical-to-X-ray emission.
Significance. If the joint-fit β value is robust, the work is significant because it supplies a quantitative resolution to the long-standing scatter in published extinction and spectral-index values for this exceptionally bright, low-latitude GRB and because a confirmed p < 2 would directly challenge the canonical diffusive-shock-acceleration expectation. The explicit recognition of the extinction–spectral-index degeneracy and the incorporation of JWST mid-infrared coverage are clear strengths.
major comments (2)
- [joint DSBPL fit description and results] The headline result β = 0.447 ± 0.001 (and therefore p = 1.89) is obtained exclusively from the joint DSBPL fit that enforces a single, time-independent intrinsic spectrum plus fixed extinction across the entire 0.5–13.3 d baseline. This modeling choice is load-bearing: any epoch-dependent change in break frequencies, the appearance of an additional mid-IR component, or a time-varying extinction law would shift the recovered β. The manuscript should demonstrate that the assumption is required by showing the χ² increase when epoch-specific β or break parameters are allowed, or by presenting the individual-epoch DSBPL fits for comparison.
- [temporal-evolution discussion] The statement that a wind medium is rejected by the temporal evolution while a uniform-density medium requires an early jet break at ∼0.5–1 d is central to the physical interpretation, yet the closure-relation test is not shown explicitly. A table or figure comparing the observed temporal indices in each band to the predicted values for both media (with and without jet break) is needed to substantiate the claim.
minor comments (2)
- [abstract] The abstract reports the joint-fit parameters but omits any goodness-of-fit statistic (χ², reduced χ², or degrees of freedom) and any description of the data-reduction pipeline or error treatment; these details should be added for reproducibility.
- [model description] Notation for the double smoothly broken power-law (DSBPL) parameters (break frequencies, smoothness indices) is introduced without a compact equation or table; a single equation defining the functional form would improve clarity.
Simulated Author's Rebuttal
We thank the referee for the constructive report. We address both major comments below and will revise the manuscript accordingly to strengthen the presentation of the joint-fit results and the temporal analysis.
read point-by-point responses
-
Referee: The headline result β = 0.447 ± 0.001 (and therefore p = 1.89) is obtained exclusively from the joint DSBPL fit that enforces a single, time-independent intrinsic spectrum plus fixed extinction across the entire 0.5–13.3 d baseline. This modeling choice is load-bearing: any epoch-dependent change in break frequencies, the appearance of an additional mid-IR component, or a time-varying extinction law would shift the recovered β. The manuscript should demonstrate that the assumption is required by showing the χ² increase when epoch-specific β or break parameters are allowed, or by presenting the individual-epoch DSBPL fits for comparison.
Authors: We agree that the robustness of the joint DSBPL assumptions should be quantified. In the revised manuscript we will add the individual-epoch DSBPL fits (with their best-fit β and break frequencies) and report the χ² and Δχ² relative to the joint model. We will also show the χ² increase obtained when β is allowed to vary freely per epoch. These additions will directly test whether the time-independent spectrum is required by the data. revision: yes
-
Referee: The statement that a wind medium is rejected by the temporal evolution while a uniform-density medium requires an early jet break at ∼0.5–1 d is central to the physical interpretation, yet the closure-relation test is not shown explicitly. A table or figure comparing the observed temporal indices in each band to the predicted values for both media (with and without jet break) is needed to substantiate the claim.
Authors: We acknowledge that an explicit closure-relation comparison was omitted. The revised manuscript will include a dedicated table listing the observed temporal indices α in the optical (X-Shooter epochs), X-ray, and JWST mid-IR bands. For each band we will tabulate the predicted α values from the standard closure relations for both wind and ISM media, before and after a jet break. This will make the rejection of the wind medium and the requirement for an early jet break in the ISM case fully transparent. revision: yes
Circularity Check
No significant circularity; results from direct data fitting with external relation for p
full rationale
The paper's central results (A_V = 4.40, β = 0.447) are obtained by fitting DSBPL models directly to the X-Shooter and JWST spectra across epochs, with the joint fit enforcing shared parameters as an explicit modeling choice. The value p = 1.89 follows from applying the standard synchrotron relation p = 2β + 1 to the fitted β; this is an independent theoretical mapping, not a reduction to the paper's fitted inputs or self-citations. No load-bearing steps reduce by construction to prior fits or author-specific uniqueness theorems. The derivation chain is self-contained against the observational data.
Axiom & Free-Parameter Ledger
free parameters (2)
- A_V =
4.40
- beta =
0.447
axioms (2)
- domain assumption Synchrotron emission from a power-law electron distribution produces a power-law spectrum whose slope β directly determines the electron index via p = 2β + 1.
- domain assumption The extinction curve is adequately described by a standard Milky-Way-like law when fitting A_V.
Reference graph
Works this paper leans on
-
[1]
Measuring Reddening with SDSS Stellar Spectra and Recalibrating SFD
Abe K., et al., 2025, ApJ, 988, L42 Achterberg A., Gallant Y. A., Kirk J. G., Guthmann A. W., 2001, MNRAS, 328, 393 Ashton G., et al., 2019, Astrophys. J. Suppl., 241, 27 Blanchard P. K., et al., 2024, Nature Astronomy, 8, 774 Burns E., et al., 2023, The Astrophysical Journal Letters, 946, L31 Campana S., Braito V., Lazzati D., Tiengo A., 2024, ApJ, 972, ...
work page internal anchor Pith review doi:10.1088/0004-637x/737/2/103 2025
-
[2]
and their corresponding spectral indices in an alternate form. We let 𝑋𝑖 = 𝜆 𝜆𝑖, where𝑖can either be the synchrotron peak (𝑚) or cooling break (𝑐) notations, 𝐹𝑚 =𝑓 𝑚 h 𝑋 −𝛽1𝑠1 𝑚 +𝑋 −𝛽2𝑠1 𝑚 i − 1 𝑠1 ,(C1) 𝐹𝑐 =𝑓 𝑐 h 𝑋 −𝛽2𝑠2 𝑐 +𝑋 −𝛽3𝑠2 𝑐 i − 1 𝑠2 ,(C2) where the ’sharpness’ parameters are defined by Granot & Sari (2002).𝛽 1 describes the slope where𝜆 > 𝜆 𝑚,𝛽...
discussion (0)
Sign in with ORCID, Apple, or X to comment. Anyone can read and Pith papers without signing in.