CrystalXRD-Bench: Benchmarking Vision-Language Models for XRD Peak Indexing Across Diverse Crystalline Materials
Pith reviewed 2026-06-29 07:25 UTC · model grok-4.3
The pith
Vision-language models reach at most 0.5888 Jaccard score when recovering Miller indices from XRD images plus CIF data.
A machine-rendered reading of the paper's core claim, the machinery that carries it, and where it could break.
Core claim
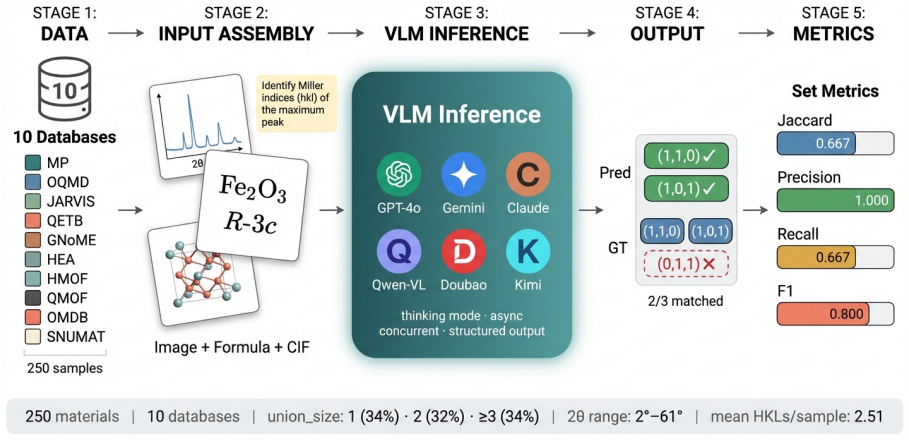
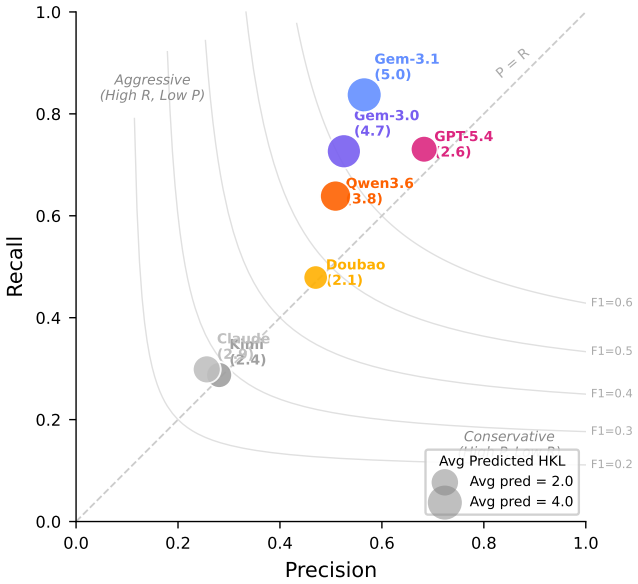
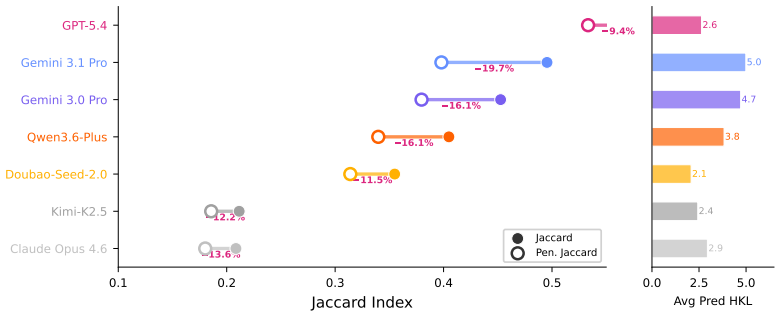
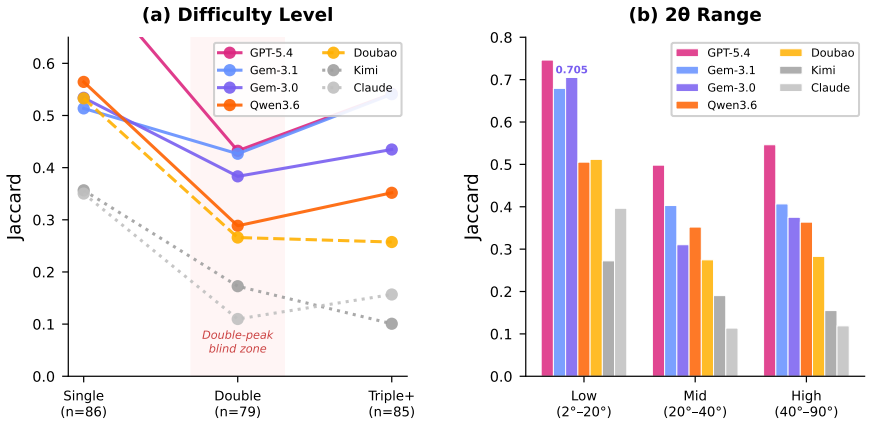
CrystalXRD-Bench supplies each rendered XRD image together with its originating CIF text and chemical formula so visual extraction can be measured separately from crystallographic calculation; on the single task of recovering every HKL that contributes to the highest-intensity peak, the best model reaches a Jaccard score of 0.5888 with 37.6 percent exact matches while six of seven models remain below 0.50, and error patterns reveal systematic weaknesses on double-peak cases, over-prediction by recall-heavy models, and limited help from CIF access.
What carries the argument
CrystalXRD-Bench, the 250-sample test set that requires recovering the complete set of HKLs for the highest-intensity peak from a rendered XRD image paired with CIF text and formula.
If this is right
- Double-peak XRD patterns remain especially difficult for current models.
- Recall-oriented models increase coverage mainly by over-predicting HKLs rather than improving extraction accuracy.
- Access to the source CIF text does not close the gap in performing the required crystallographic calculations.
- The benchmark isolates concrete conditions under which vision-language models fail on quantitative scientific figures.
Where Pith is reading between the lines
- Specialized visual processing for curve and peak data may be required before these models can support routine crystallography workflows.
- Extending the same evaluation protocol to full-pattern indexing or to weaker peaks would likely reveal additional failure modes.
- Hybrid systems that combine vision-language output with external symbolic crystallography routines could be tested directly on this benchmark.
Load-bearing premise
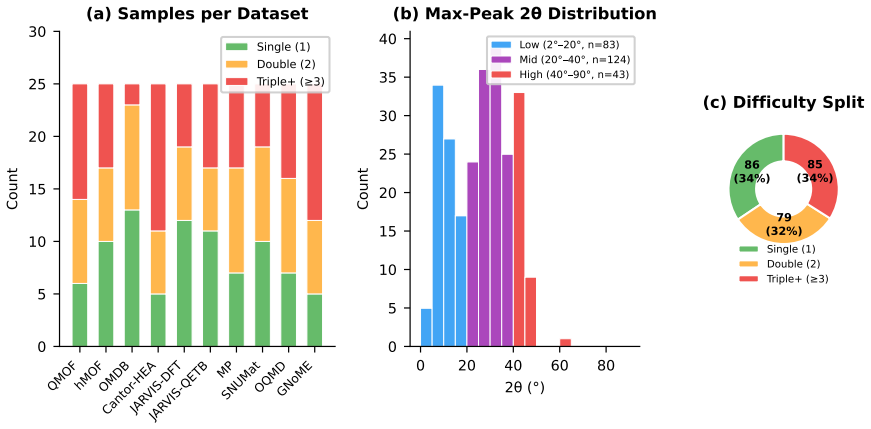
The 250 samples drawn from ten public crystallographic databases form a representative test without unaccounted confounding factors from peak rendering or database choice.
What would settle it
A model that reaches Jaccard scores above 0.8 on the full set of 250 samples, or a controlled study showing that rendering choices alone produce the observed error rates.
Figures


read the original abstract
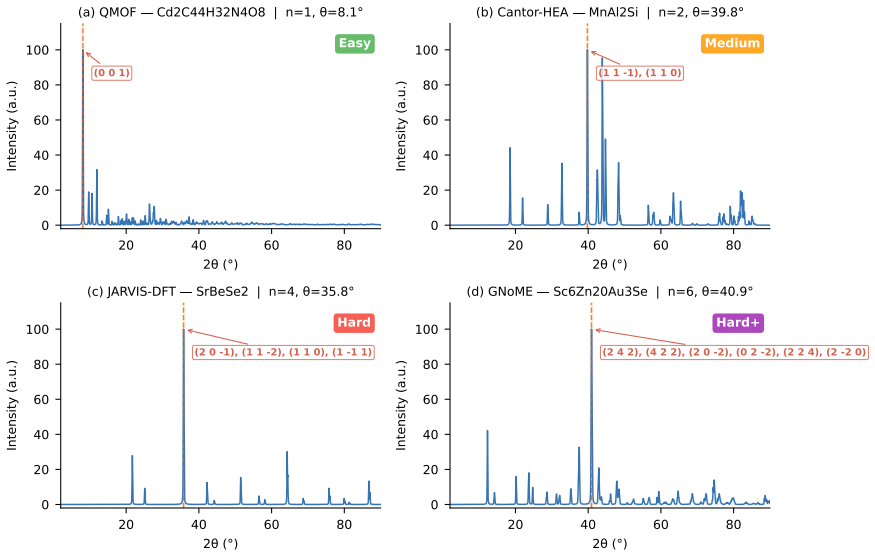
Miller-index identification from powder XRD patterns requires capabilities untested by existing multimodal benchmarks: the model must read a narrow peak location from a rendered scientific curve and then connect that observation to multi-step crystallographic reasoning. We introduce CrystalXRD-Bench, a 250-sample benchmark built from 10 public crystallographic databases for a single task: recover the full set of HKLs contributing to the highest-intensity peak in an XRD pattern. Each sample pairs the rendered XRD image with the source CIF text and chemical formula, so visual extraction errors and reasoning errors can be examined side by side. We evaluate seven vision-language models. The best Jaccard score is 0.5888 (GPT-5.4) with an exact-match rate of 37.6%, yet six of seven models remain below Jaccard 0.50; the task is far from solved. Error patterns vary systematically: double-peak cases are especially brittle, recall-heavy models gain coverage by over-predicting HKLs, and access to CIF text does not close the gap in crystallographic calculation. Alongside model rankings, the benchmark identifies the conditions under which current VLMs fail on quantitative scientific figures. All data and evaluation code will be publicly available.
Editorial analysis
A structured set of objections, weighed in public.
Referee Report
Summary. The paper introduces CrystalXRD-Bench, a 250-sample benchmark drawn from 10 public crystallographic databases. Each sample pairs a rendered XRD image with the source CIF text and chemical formula; the single task is to recover the full set of HKLs contributing to the highest-intensity peak. Seven vision-language models are evaluated on Jaccard overlap and exact-match rate. The best result is Jaccard 0.5888 and 37.6% exact match (GPT-5.4); six of seven models remain below Jaccard 0.50. The authors conclude that the task is far from solved, document systematic error patterns (double-peak brittleness, recall-heavy over-prediction, limited benefit from CIF text), and state that all data and evaluation code will be released publicly.
Significance. If the benchmark construction is shown to be free of rendering artifacts, the work supplies a concrete, reproducible test of visual quantitative-figure reading plus multi-step crystallographic reasoning that is absent from existing multimodal benchmarks. The planned public release of data and code is a clear strength that would allow direct follow-up and extension.
major comments (2)
- [Abstract / Dataset Construction] Abstract and (presumed) §3 Dataset Construction: the description of the rendered XRD images supplies no parameters for peak profile (Gaussian/Lorentzian), width, noise level, axis scaling, or intensity normalization. Because the central claim is that low Jaccard scores reflect genuine limits in visual peak extraction plus HKL reasoning, the absence of these details is load-bearing; idealized delta-function peaks or fixed widths could create failure modes absent from experimental data.
- [Abstract / Dataset Construction] Abstract and (presumed) §3: the 250 samples are drawn from 10 databases, yet no breakdown by crystal system, space-group complexity, or peak-overlap statistics is provided. Without this distribution, it is impossible to verify that the reported performance gap is not driven by an unrepresentative subset of easy or hard cases.
minor comments (1)
- [Abstract] Abstract: the model identifier 'GPT-5.4' should be clarified (version, API date, or whether it is a hypothetical label) so that the ranking can be reproduced.
Simulated Author's Rebuttal
We thank the referee for the constructive comments on dataset construction. We agree that both points require clarification and will revise the manuscript accordingly to strengthen the work.
read point-by-point responses
-
Referee: [Abstract / Dataset Construction] Abstract and (presumed) §3 Dataset Construction: the description of the rendered XRD images supplies no parameters for peak profile (Gaussian/Lorentzian), width, noise level, axis scaling, or intensity normalization. Because the central claim is that low Jaccard scores reflect genuine limits in visual peak extraction plus HKL reasoning, the absence of these details is load-bearing; idealized delta-function peaks or fixed widths could create failure modes absent from experimental data.
Authors: We agree that the rendering parameters are essential for interpreting the results and supporting the claim that performance gaps reflect model limitations rather than artifacts. The original manuscript omitted these specifics in §3. In the revision we will add a precise description of the peak profile (Gaussian with specified FWHM), noise level, axis scaling, and intensity normalization, including the exact parameter values used when generating images from the CIF files. revision: yes
-
Referee: [Abstract / Dataset Construction] Abstract and (presumed) §3: the 250 samples are drawn from 10 databases, yet no breakdown by crystal system, space-group complexity, or peak-overlap statistics is provided. Without this distribution, it is impossible to verify that the reported performance gap is not driven by an unrepresentative subset of easy or hard cases.
Authors: We acknowledge that a statistical breakdown of the 250 samples is needed to demonstrate representativeness. In the revised manuscript we will include in §3 (or a new table) the distribution by crystal system, space-group complexity metrics (e.g., number of atoms per unit cell or number of possible HKLs), and peak-overlap statistics (e.g., fraction of samples with overlapping peaks near the highest-intensity reflection). This will allow readers to assess whether the performance gap is driven by dataset composition. revision: yes
Circularity Check
Empirical benchmark with no derivation chain or self-referential steps
full rationale
The paper introduces CrystalXRD-Bench as a 250-sample dataset drawn from public crystallographic databases and reports direct empirical evaluations of seven vision-language models on the task of HKL indexing from rendered XRD images. No equations, fitted parameters, predictions derived from prior fits, or load-bearing self-citations appear in the abstract or described content. The central claims (Jaccard scores, exact-match rates, error patterns) rest on straightforward model evaluation against the new benchmark rather than any reduction to inputs by construction. This is a standard empirical benchmark paper whose results are externally falsifiable via the released data and code.
Axiom & Free-Parameter Ledger
Reference graph
Works this paper leans on
-
[1]
Cullity and S.R
B.D. Cullity and S.R. Stock.Elements of X-Ray Diffraction. Prentice Hall, 3rd edition, 2001
2001
-
[2]
DVQA: Understanding data visualizations via question answering
Kushal Kafle, Brian Price, Scott Cohen, and Christopher Kanan. DVQA: Understanding data visualizations via question answering. InProceedings of the IEEE Conference on Computer Vision and Pattern Recognition (CVPR), pages 5648–5656, 2018
2018
-
[3]
Khapra, and Pratyush Kumar
Nitesh Methani, Pritha Ganguly, Mitesh M. Khapra, and Pratyush Kumar. PlotQA: Reasoning over scientific plots. InProceedings of the IEEE/CVF Winter Conference on Applications of Computer Vision (WACV), pages 1527–1536, 2020
2020
-
[4]
ChartQA:Abenchmark for question answering about charts with visual and logical reasoning
AhmedMasry,DoXuanLong,JiaQingTan,ShafiqJoty,andEnamulHoque. ChartQA:Abenchmark for question answering about charts with visual and logical reasoning. InFindings of the Association for Computational Linguistics: ACL 2022, pages 2263–2279, 2022
2022
-
[5]
arXiv preprint arXiv:2312.15915 , year=
ZhengzhuoXuetal. ChartBench: Abenchmarkforcomplexvisualreasoningincharts.arXivpreprint arXiv:2312.15915, 2023. 13
-
[6]
FigureQA: An Annotated Figure Dataset for Visual Reasoning
Samira Ebrahimi Kahou, Vincent Michalski, Adam Atkinson, Ákos Kádár, Adam Trischler, and Yoshua Bengio. FigureQA: An annotated figure dataset for visual reasoning. InICLR 2018 Workshop on Learning to Reason, 2018. URLhttps://arxiv.org/abs/1710.07300. arXiv:1710.07300
work page internal anchor Pith review Pith/arXiv arXiv 2018
-
[7]
MMC: Advancing multimodal chart understanding with large-scale instruction tuning
Fuxiao Liu, Xiaoyang Wang, Wenlin Yao, Jianshu Chen, Kaiqiang Song, Sangwoo Cho, and Yaser Yacoob. MMC: Advancing multimodal chart understanding with large-scale instruction tuning. InProceedings of the 2024 Conference of the North American Chapter of the Association for Computational Linguistics (NAACL), 2024. URL https://arxiv.org/abs/2311.10774. arXiv:...
-
[8]
ChartX & ChartVLM: A versatile benchmark and foundation model for complicated chart reasoning
Renqiu Xia, Bo Zhang, Hancheng Ye, Xiangchao Yan, Qi Liu, Hongbin Zhou, Zijun Chen, Min Shi, Tao Yan, Junchi Jiang, et al. ChartX & ChartVLM: A versatile benchmark and foundation model for complicated chart reasoning. InProceedings of the 32nd ACM International Conference on Multimedia (MM), 2024. URLhttps://arxiv.org/abs/2402.12185. arXiv:2402.12185
-
[9]
LLM4Mat- Bench: Benchmarking large language models for materials property knowledge
AndreNiyongaboRubungo,KyleSwanson,TianXie,BoruiPeng,andJeffreyC.Grossman. LLM4Mat- Bench: Benchmarking large language models for materials property knowledge. InNeurIPS 2024 Workshop on AI for Accelerated Materials Design (AI4Mat), 2024
2024
-
[10]
Yu Song, Santiago Miret, and Bang Liu. MatSci-NLP: Evaluating scientific language models on materials science language tasks using text-to-schema modeling. InProceedings of the 61st Annual Meeting of the Association for Computational Linguistics (ACL), pages 3621–3639, 2023. URL https://arxiv.org/abs/2305.08264. arXiv:2305.08264
-
[11]
Classification of crystal structure using a convolutional neural network.IUCrJ, 4(4):486–494, 2017
Won Bae Park, Jiyong Chung, Jaeyoung Jung, Keemin Sohn, Satendra Pal Singh, Myoungho Pyo, Namsoo Shin, and Kee-Sun Sohn. Classification of crystal structure using a convolutional neural network.IUCrJ, 4(4):486–494, 2017
2017
-
[12]
A deep-learning technique for phase identification in multiphase inorganic compounds using synthetic XRD powder patterns.Nature Communications, 11:86, 2020
Jong-Won Lee, Won Bae Park, Jin Hee Lee, Satendra Pal Singh, and Kee-Sun Sohn. A deep-learning technique for phase identification in multiphase inorganic compounds using synthetic XRD powder patterns.Nature Communications, 11:86, 2020
2020
-
[13]
Rosen, Shaelyn M
Andrew S. Rosen, Shaelyn M. Iyer, Debmalya Ray, Zhenpeng Yao, Alán Aspuru-Guzik, Laura Gagliardi, Justin M. Notestein, and Randall Q. Snurr. Machine learning the quantum-chemical properties of metal–organic frameworks for accelerated materials discovery.Matter, 4(5):1578–1597, 2021
2021
-
[14]
Wilmer, Michael Leaf, Crystal Y
Christopher E. Wilmer, Michael Leaf, Crystal Y. Lee, Omar K. Farha, Brad G. Hauser, Joseph T. Hupp,andRandallQ.Snurr. Large-scalescreeningofhypotheticalmetal–organicframeworks.Nature Chemistry, 4:83–89, 2012
2012
-
[15]
Borysov, R
Stanislav S. Borysov, R. Matthias Geilhufe, and Alexander V. Balatsky. Organic materials database: An open-access online database for data mining.PLoS ONE, 12(2):e0171501, 2017
2017
-
[16]
Database of Cantor high-entropy alloys.Scientific Data, 2024
Gowoon Cheon et al. Database of Cantor high-entropy alloys.Scientific Data, 2024. Cantor High-Entropy Alloy Database
2024
-
[17]
Garrity, Andrew C.E
Kamal Choudhary, Kevin F. Garrity, Andrew C.E. Reid, Brian DeCost, Adam J. Biacchi, Angela R. Hight Walker, Francesca Tavazza, Ichiro Takeuchi, Alden A. Dima, and Jason R. Hattrick-Simpers. The joint automated repository for various integrated simulations (JARVIS) for data-driven materials design.npj Computational Materials, 6:173, 2020
2020
-
[18]
Anubhav Jain, Shyue Ping Ong, Geoffroy Hautier, Wei Chen, William Davidson Richards, Stephen Dacek, Shreyas Cholia, Dan Gunter, David Skinner, Gerbrand Ceder, and Kristin A. Persson. Commentary: The Materials Project: A materials genome approach to accelerating materials innovation.APL Materials, 1(1):011002, 2013
2013
-
[19]
SNUMat: A large materials database for machine learning.npj Computational Materials, 2023
Jaehyeok Lee et al. SNUMat: A large materials database for machine learning.npj Computational Materials, 2023. 14
2023
-
[20]
Saal, Scott Kirklin, Muratahan Aykol, Bryce Meredig, and C
James E. Saal, Scott Kirklin, Muratahan Aykol, Bryce Meredig, and C. Wolverton. Materials design anddiscoverywithhigh-throughputdensityfunctionaltheory: TheOpenQuantumMaterialsDatabase (OQMD).JOM, 65:1501–1509, 2013
2013
-
[21]
Schoenholz, Muratahan Aykol, Gowoon Cheon, and Ekin Dogus Cubuk
Amil Merchant, Simon Batzner, Samuel S. Schoenholz, Muratahan Aykol, Gowoon Cheon, and Ekin Dogus Cubuk. Scaling deep learning for materials discovery.Nature, 624:80–85, 2023
2023
-
[22]
Chevrier, Kristin A
Shyue Ping Ong, William Davidson Richards, Anubhav Jain, Geoffroy Hautier, Michael Kocher, Shreyas Cholia, Dan Gunter, Vincent L. Chevrier, Kristin A. Persson, and Gerbrand Ceder. Python Materials Genomics (pymatgen): A robust, open-source Python library for materials analysis. Computational Materials Science, 68:314–319, 2013
2013
-
[23]
Thompson, D.E
P. Thompson, D.E. Cox, and J.B. Hastings. Rietveld refinement of Debye–Scherrer synchrotron X-ray data from Al2O3.Journal of Applied Crystallography, 20:79–83, 1987
1987
-
[24]
The distribution of the flora in the alpine zone.New Phytologist, 11(2):37–50, 1912
Paul Jaccard. The distribution of the flora in the alpine zone.New Phytologist, 11(2):37–50, 1912
1912
-
[25]
A review on multi-label learning algorithms.IEEE Transactions on Knowledge and Data Engineering, 26(8):1819–1837, 2014
Min-Ling Zhang and Zhi-Hua Zhou. A review on multi-label learning algorithms.IEEE Transactions on Knowledge and Data Engineering, 26(8):1819–1837, 2014
2014
-
[26]
SauliusGražulis,DanielChateigner,RobertT.Downs,A.F.T.Yokochi,MiguelQuirós,LucaLutterotti, Elena Manakova, Justas Butkus, Peter Moeck, and Armel Le Bail. Crystallography open database - an open-accesscollectionofcrystalstructures.JournalofAppliedCrystallography,42(4):726–729,2009. doi: 10.1107/S0021889809016690. URLhttps://doi.org/10.1107/S0021889809016690...
-
[27]
An XRD pattern image (intensity vs. 2theta)
-
[28]
The CIF of the material: <CIF_TEXT>
-
[29]
The chemical formula: <FORMULA> Task: Identify ALL Miller indices (hkl) for the HIGHEST peak. It may result from superposition of multiple crystallographic planes. Return JSON: {"max_peak_hkls": [[h,k,l], ...]} For hexagonal and trigonal systems, the prompt switches to 4-index Miller-Bravais notation[hkil] with the constrainti=−(h+k). B Detailed Per-Datas...
discussion (0)
Sign in with ORCID, Apple, or X to comment. Anyone can read and Pith papers without signing in.