Resolution Diagnostics for Paired LLM Evaluation
Pith reviewed 2026-06-29 07:13 UTC · model grok-4.3
The pith
Many displayed pairwise rankings on public LLM leaderboards fail to meet conventional paired-test resolution targets.
A machine-rendered reading of the paper's core claim, the machinery that carries it, and where it could break.
Core claim
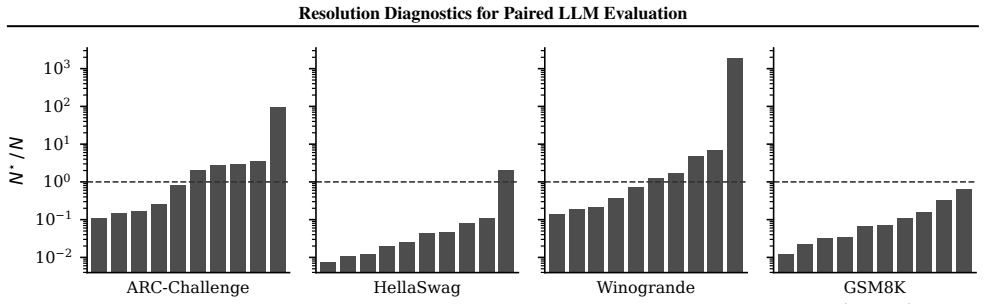
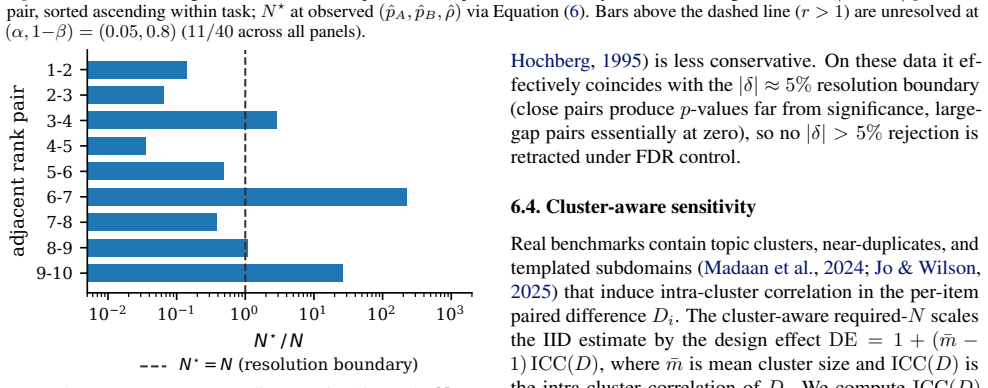
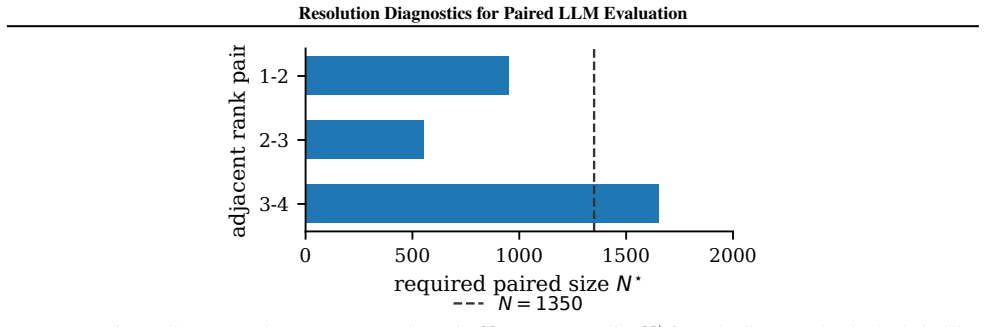
Across two public LLM leaderboards, 11 of 40 Open LLM Leaderboard v1 pairwise comparisons and 4 of 9 MMLU-Pro top-10 adjacent-rank pairs remain unresolved at (alpha, 1-beta) = (0.05, 0.8). The MMLU-Pro count increases to 6 of 9 under subject-level clustering and stays between 5 and 6 of 9 in nearly all category-bootstrap resamples. The paper inverts standard level-alpha, power-(1-beta) tests to produce a per-pair resolution ratio q = N/N* and shows that the unpaired Cohen-h-plus-(1-rho) shortcut deviates from the correct N* by approximately a factor of two in the close-comparison regime. The unresolved-pair pattern persists under multiplicity correction and anytime-valid sequential testing.
What carries the argument
The resolution ratio q = N/N*, obtained by inverting a paired hypothesis test to find the minimum sample size N* needed for given alpha and power and then comparing it to the actual number of paired evaluations N.
If this is right
- Leaderboard displays should include per-pair resolution diagnostics to indicate which rankings rest on adequate evidence.
- Close model comparisons require substantially more evaluations than current practice supplies to reach conventional power targets.
- The common unpaired Cohen-h adjustment, even after post-multiplication by (1-rho), systematically understates the sample size needed for paired LLM comparisons.
- Subject-level clustering increases the number of unresolved pairs and should be accounted for in future leaderboard analyses.
- The unresolved pattern holds after standard multiplicity corrections and under sequential testing procedures.
Where Pith is reading between the lines
- Evaluation budgets may need to concentrate on deeper testing of near-tied models rather than spreading effort across many models.
- The same diagnostic could be applied to other ranking systems that rely on paired human or automatic judgments.
- If the resolution ratio becomes standard, model-release announcements would likely report evaluation counts relative to the required N* for their claimed superiority.
- Clustering effects imply that prompt or subject diversity in evaluation sets directly affects the reliability of reported rankings.
Load-bearing premise
Leaderboard scores can be modeled as draws from a standard paired hypothesis test whose power is fully determined by an estimable correlation and effect size, without large unmodeled dependence or selection effects.
What would settle it
Re-analysis of the raw per-prompt scores underlying the leaderboards that finds every reported adjacent pair actually achieves at least 80 percent power at alpha 0.05 under the paired test.
Figures


read the original abstract
Across two public LLM leaderboards, many displayed pairwise rankings do not meet a conventional paired-test resolution target under the actual paired evaluation design: 11 of 40 Open LLM Leaderboard v1 pairwise comparisons and 4 of 9 MMLU-Pro top-10 adjacent-rank pairs are unresolved at (alpha, 1-beta) = (0.05, 0.8). The MMLU-Pro count rises to 6/9 under real subject-level clustering and stays at 5-6 out of 9 in 99.9% of category-bootstrap resamples. We frame paired LLM evaluation as a hypothesis-testing problem, invert level-alpha, power-(1-beta) tests, and report a per-pair resolution ratio q = N/N* as the primary diagnostic. A sharp small-effect expansion with an explicit second-order constant shows that the widely-used unpaired Cohen-h-plus-(1-rho) shortcut deviates from the correct N* by approximately a factor of two in the close-comparison regime, a deficit that three of five off-the-shelf calculators(Cohen 1988, G*Power, R pwr) silently inherit when the user post-multiplies their per-arm output by (1-rho). The unresolved-pair pattern remains under multiplicity correction and anytime-valid sequential testing.
Editorial analysis
A structured set of objections, weighed in public.
Referee Report
Summary. The paper claims that many pairwise rankings on public LLM leaderboards do not achieve conventional statistical resolution under paired evaluation designs. Specifically, it reports that 11 of 40 comparisons on the Open LLM Leaderboard v1 and 4 of 9 adjacent pairs on MMLU-Pro are unresolved at (alpha=0.05, 1-beta=0.8), with the MMLU-Pro figure increasing to 6/9 under subject-level clustering. The central contribution is the resolution ratio q = N/N* obtained by inverting the paired-test power equation, along with a small-effect expansion showing that common Cohen's h shortcuts underestimate required N by a factor of two.
Significance. Should the empirical counts and derivations prove robust, this work would be significant for the field of LLM evaluation by providing a concrete, falsifiable diagnostic for when leaderboard differences are statistically resolvable. The explicit critique of off-the-shelf power calculators and the second-order expansion represent technical strengths that could improve evaluation standards if adopted.
major comments (3)
- Abstract: The counts of unresolved pairs rely on estimates of rho and per-item variances for the Open LLM Leaderboard v1 pairs, but the abstract (and by extension the methods) does not describe how these are obtained, leaving open whether shared training data or prompt overlap affects the effective variance used in N*.
- Power formula inversion (central derivation): The resolution ratio q is derived from observed deltas; this post-hoc approach means that pairs with small observed differences (due to noise or otherwise) are automatically labeled unresolved, which is the classic post-hoc power pathology and requires explicit discussion of its implications for the diagnostic.
- MMLU-Pro analysis: While subject-level clustering is applied, the manuscript should specify the exact model for clustering (e.g., which equation for the variance inflation) and how it interacts with the rho estimation to produce the increase from 4/9 to 6/9.
minor comments (1)
- Abstract: The phrase 'three of five off-the-shelf calculators' could be clarified by naming them explicitly in the main text for reproducibility.
Simulated Author's Rebuttal
We thank the referee for these constructive comments that highlight opportunities to strengthen the clarity of the manuscript. We respond to each major comment below.
read point-by-point responses
-
Referee: Abstract: The counts of unresolved pairs rely on estimates of rho and per-item variances for the Open LLM Leaderboard v1 pairs, but the abstract (and by extension the methods) does not describe how these are obtained, leaving open whether shared training data or prompt overlap affects the effective variance used in N*.
Authors: The rho and per-item variance estimates are computed empirically from the observed paired item-level scores on each benchmark. We will revise the abstract to reference this empirical estimation and add an explicit methods paragraph describing the computation from the leaderboard data. This will make clear that any effects from shared training data or prompt overlap are already incorporated into the observed variances used for N*. revision: yes
-
Referee: Power formula inversion (central derivation): The resolution ratio q is derived from observed deltas; this post-hoc approach means that pairs with small observed differences (due to noise or otherwise) are automatically labeled unresolved, which is the classic post-hoc power pathology and requires explicit discussion of its implications for the diagnostic.
Authors: The diagnostic intentionally conditions on the observed delta to assess whether a reported leaderboard difference meets the resolution target under the actual paired design and sample size; this differs from the classic pathology of using post-hoc power to reinterpret a non-significant result. Nevertheless, we will add a dedicated discussion paragraph distinguishing the two uses and addressing implications for noisy small deltas, including sensitivity checks. revision: yes
-
Referee: MMLU-Pro analysis: While subject-level clustering is applied, the manuscript should specify the exact model for clustering (e.g., which equation for the variance inflation) and how it interacts with the rho estimation to produce the increase from 4/9 to 6/9.
Authors: We will expand the MMLU-Pro section to state the exact variance inflation model VIF = 1 + (k-1) rho_s (with k items per subject and rho_s the intra-subject correlation estimated from the data) and show how this adjusted variance is combined with the pairwise rho before inverting the power equation. The revised text will also report the intermediate values that produce the shift from 4/9 to 6/9 unresolved pairs. revision: yes
Circularity Check
No significant circularity; standard power inversion applied to external leaderboard data
full rationale
The paper inverts conventional paired t-test power formulas (with explicit small-effect expansion) to obtain per-pair resolution ratio q = N/N* from observed deltas and estimated rho on public leaderboards. This is a direct application of textbook hypothesis-testing machinery to independent external scores rather than any self-definitional loop, fitted-input prediction, or self-citation chain. The reported counts (11/40, 4/9, etc.) are empirical tallies under the chosen (alpha, 1-beta) targets; no equation reduces to its own inputs by construction, and the derivation remains self-contained against external statistical references.
Axiom & Free-Parameter Ledger
free parameters (2)
- rho (pairwise correlation)
- effect size delta
axioms (1)
- domain assumption Paired observations follow the standard model for which the power formula N* is derived (typically normality or binomial with known variance).
Reference graph
Works this paper leans on
-
[2]
URL https://arxiv.org/abs/2503.10694. ICML 2025 (Position track). Bean, A. M., Kearns, R. O., Romanou, A., Hafner, F. S., Mayne, H., et al. Measuring what matters: Con- struct validity in large language model benchmarks. arXiv preprint arXiv:2511.04703,
-
[3]
NeurIPS 2025 Datasets and Benchmarks Track
URL https: //arxiv.org/abs/2511.04703. NeurIPS 2025 Datasets and Benchmarks Track. Benjamini, Y . and Hochberg, Y . Controlling the false discov- ery rate: A practical and powerful approach to multiple testing.Journal of the Royal Statistical Society: Series B (Methodological), 57(1):289–300,
-
[4]
With little power comes great respon- sibility
Card, D., Henderson, P., Khandelwal, U., Jia, R., Mahowald, K., and Jurafsky, D. With little power comes great respon- sibility. InProceedings of the 2020 Conference on Empir- ical Methods in Natural Language Processing (EMNLP), pp. 9263–9274,
2020
-
[6]
9 Resolution Diagnostics for Paired LLM Evaluation Grünwald, P., de Heide, R., and Koolen, W
URL https://arxiv.org/abs/2510.23191. 9 Resolution Diagnostics for Paired LLM Evaluation Grünwald, P., de Heide, R., and Koolen, W. Safe testing. Journal of the Royal Statistical Society: Series B (Statis- tical Methodology),
-
[8]
Position: AI Evaluations Should be Grounded on a Theory of Capability
URL https://arxiv.org/abs/2509.19590. Liddell, F. D. K. Simplified exact analysis of case-referent studies: Matched pairs; dichotomous exposure.Journal of Epidemiology and Community Health, 37(1):82–84,
work page internal anchor Pith review Pith/arXiv arXiv
-
[10]
URL https:// arxiv.org/abs/2406.10229. McNemar, Q. Note on the sampling error of the differ- ence between correlated proportions or percentages.Psy- chometrika, 12(2):153–157,
-
[12]
URL https://arxiv. org/abs/2411.00640. Polo, F. M., Weber, L., Choshen, L., Sun, Y ., Xu, G., and Yurochkin, M. tinyBenchmarks: Evaluating LLMs with fewer examples. InProceedings of the 41st International Conference on Machine Learning (ICML),
-
[13]
reject the firstnat whiche n ≥1/α
under H0. With a discrete mixture priorνover the alternative discordance probabilityθ∈(0, 1 2)∪( 1 2 ,1), the e-process is en = Z θbn(1−θ) cn (1/2)bn+cn dν(θ),(24) 12 Resolution Diagnostics for Paired LLM Evaluation 102 103 paired sample size n 0.0 0.2 0.4 0.6 0.8 1.0bootstrap power Δ ̄μ = 0.02 Δ ̄μ = 0.04 Δ ̄μ = 0.08 paired-t N⋆ Figure 6.Non-Bernoulli st...
2024
-
[14]
Empirically, a Beta(2,2) mixture and a discrete two-point mixture at θ∈ {0.4,0.6} both produce stopping times within ≈8% of the uniform on our calibration pairs
require knowing the alternative density and are sensitive to misspecification. Empirically, a Beta(2,2) mixture and a discrete two-point mixture at θ∈ {0.4,0.6} both produce stopping times within ≈8% of the uniform on our calibration pairs. Calibration.We calibrate the mixture e-process on simulated paired Bernoulli calibrated to two ARC pairs ( ˆδ= 2.4%,...
2026
-
[15]
Table 6.Raw discordance and pair details for the seven OLL v1 close pairs ( |ˆδ| ≤2 pp)
without re-running the code, and trace each rank pair to its concrete model identifiers. Table 6.Raw discordance and pair details for the seven OLL v1 close pairs ( |ˆδ| ≤2 pp). b=nAB and c=nBA are the discordant counts; ˆρ is the empirical Bernoulli correlation; N ⋆ is the McNemar-Connor required-N from Equation (6). The HellaSwag row reconciles the §1 1...
2000
discussion (0)
Sign in with ORCID, Apple, or X to comment. Anyone can read and Pith papers without signing in.