Waiting at the front door: Continuous monitoring of latency in the host network stack
Pith reviewed 2026-06-28 12:22 UTC · model grok-4.3
The pith
netstacklat captures latency at multiple points in the Linux host network stack while increasing tail latency by at most 6%.
A machine-rendered reading of the paper's core claim, the machinery that carries it, and where it could break.
Core claim
We present netstacklat, a monitoring tool that captures latency at several points in the host network, from the early parts of the Linux kernel network stack all the way until the application reads the data, while showing low monitoring overhead that does not inflate tail latency by more than 6%, where previous monitoring solutions increase it by over 100%.
What carries the argument
netstacklat, a collection of timestamped measurement points placed at successive stages of packet handling inside the Linux kernel network stack.
If this is right
- Continuous, low-overhead monitoring of host-internal latency sources becomes practical for ongoing operations.
- Direct comparisons of latency contributions across many workload configurations are now feasible without distorting the results.
- Production deployments can surface concrete data on how much of observed delay originates inside the host rather than on the wire.
Where Pith is reading between the lines
- The same instrumentation strategy could be applied to other packet-processing paths such as user-space networking libraries.
- Repeated measurements at the identified points might highlight specific kernel or scheduler changes that reduce host latency further.
- Similar monitoring could be added to container or virtual-machine environments to isolate latency introduced by virtualization layers.
Load-bearing premise
The chosen measurement points and the 144 tested HTTP workload variations represent the main latency sources that appear in real production traffic, and the measured overhead generalizes beyond the test environment.
What would settle it
A production run in which enabling netstacklat causes tail latency to rise by more than 6% under comparable workloads, or in which the latencies recorded by the tool fail to match independent application-level delay measurements.
Figures


read the original abstract
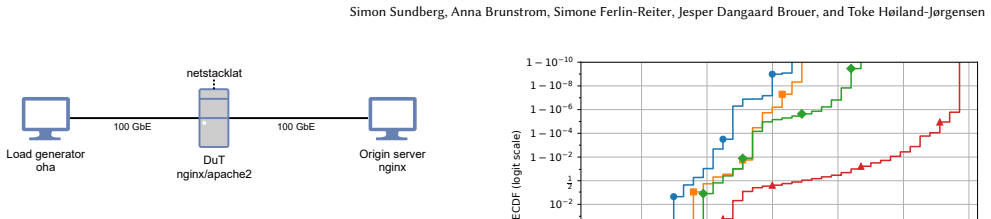
With networking moving into the sub-millisecond latency domain, latency in the end host itself can become a significant barrier to achieving consistently low application latency. Both the physical interconnect between the network card and the CPU, the kernel network stack, and the scheduling of applications themselves can be considerable sources of latency. Previous work has studied host latency at various levels, yet there remains a lack of methods and tools to continuously monitor host latency in production. To remedy this, we present netstacklat, a monitoring tool that captures latency at several points in the host network, from the early parts of the Linux kernel network stack all the way until the application reads the data. We evaluate netstacklat in a testbed, demonstrating its ability to capture host latency across 144 variations of HTTP workloads for Nginx and Apache, while also showing how the low monitoring overhead does not inflate tail latency by more than 6%, where previous monitoring solutions increase it by over 100%. Furthermore, we share our initial findings from deploying netstacklat in Cloudflare's global CDN network.
Editorial analysis
A structured set of objections, weighed in public.
Referee Report
Summary. The paper presents netstacklat, a monitoring tool that captures latency at multiple points in the Linux host network stack (from early kernel processing to application read). It evaluates the tool across 144 HTTP workload variations for Nginx and Apache in a testbed, claiming the ability to measure host latency while incurring at most 6% tail-latency inflation (compared to >100% for prior tools). It additionally shares initial findings from a deployment in Cloudflare's global CDN.
Significance. If the testbed results hold, the work addresses a practical gap in continuous, low-overhead host-latency monitoring for sub-millisecond networking. The broad coverage of 144 configurations and explicit comparison against prior monitoring solutions are strengths that support the low-overhead claim. The real-world CDN deployment experience adds deployment relevance, though it is presented only as initial findings without quantitative metrics.
major comments (2)
- [§4 (Evaluation)] §4 (Evaluation): The central claim that netstacklat inflates tail latency by no more than 6% (versus >100% for prior tools) is load-bearing for the contribution on practicality. The manuscript provides no details on the precise definition of tail latency (e.g., 99th percentile), number of runs, statistical tests, or data-exclusion rules used to establish this bound across the 144 configurations.
- [§5 (Deployment)] §5 (Deployment): The production findings from Cloudflare's CDN are described only qualitatively as 'initial findings' with no reported overhead numbers, tail-latency deltas, or workload coverage. This leaves the generalization of the testbed 6% bound unquantified, which is relevant to the paper's motivation for production monitoring.
minor comments (2)
- [Abstract / Introduction] The abstract and introduction could more clearly separate the quantitative testbed results from the qualitative deployment findings to avoid conflating the two.
- [Figures in §4] Figure captions and axis labels in the evaluation section would benefit from explicit units and workload identifiers to improve readability of the 144-configuration results.
Simulated Author's Rebuttal
We thank the referee for the constructive feedback highlighting the need for greater methodological transparency in the evaluation and for clarifying the scope of the deployment results. We address each major comment below and will revise the manuscript to improve reproducibility and context.
read point-by-point responses
-
Referee: [§4 (Evaluation)] §4 (Evaluation): The central claim that netstacklat inflates tail latency by no more than 6% (versus >100% for prior tools) is load-bearing for the contribution on practicality. The manuscript provides no details on the precise definition of tail latency (e.g., 99th percentile), number of runs, statistical tests, or data-exclusion rules used to establish this bound across the 144 configurations.
Authors: We agree that additional methodological details are required to support the 6% bound. In the revised manuscript we will add a dedicated subsection to §4 specifying: tail latency is the 99th percentile of per-request host-stack latency; each of the 144 configurations was run 10 times with independent restarts; statistical significance was assessed via paired Wilcoxon signed-rank tests (p < 0.01 threshold); and data-exclusion rules removed runs whose median exceeded 3 standard deviations from the configuration mean. These additions will be placed before the overhead results so readers can directly evaluate the claim. revision: yes
-
Referee: [§5 (Deployment)] §5 (Deployment): The production findings from Cloudflare's CDN are described only qualitatively as 'initial findings' with no reported overhead numbers, tail-latency deltas, or workload coverage. This leaves the generalization of the testbed 6% bound unquantified, which is relevant to the paper's motivation for production monitoring.
Authors: The deployment is intentionally labeled 'initial findings' because its purpose was to demonstrate operational feasibility inside a live global CDN rather than to replicate the controlled testbed quantification. Collecting precise per-packet overhead and tail-latency deltas at Cloudflare scale would have required instrumentation changes that were outside the scope of this first deployment. In revision we will (1) explicitly state that the 6% bound is supported only by the testbed experiments and (2) add the available workload descriptors (HTTP request mix, geographic distribution) to give readers a clearer picture of the production context without claiming quantitative generalization. revision: partial
Circularity Check
No circularity: empirical tool evaluation with direct measurements only
full rationale
The paper presents netstacklat as a monitoring tool and reports empirical results from testbed experiments (144 HTTP workload variations) plus initial deployment observations. No equations, parameter fitting, predictions derived from fits, or derivation chains appear in the abstract or described structure. Central claims rest on measured overhead bounds rather than any self-referential construction, self-citation load-bearing premises, or renamed known results. This matches the provided reader's assessment of score 1.0 with no mathematical content that could reduce to inputs.
Axiom & Free-Parameter Ledger
Reference graph
Works this paper leans on
-
[1]
Saksham Agarwal, Rachit Agarwal, Behnam Montazeri, Masoud Moshref, Khaled Elmeleegy, Luigi Rizzo, Marc Asher de Kruijf, Gautam Kumar, Sylvia Ratnasamy, David Culler, and Amin Vahdat. 2022. Understanding Host Interconnect Con- gestion. InProceedings of the 21st ACM Workshop on Hot Topics in Networks (HotNets ’22). Association for Computing Machinery, New Y...
2022
-
[2]
doi:10.1145/3563766.3564110
-
[3]
Saksham Agarwal, Arvind Krishnamurthy, and Rachit Agarwal. 2023. Host Congestion Control. InProceedings of the ACM SIGCOMM 2023 Conference (Acm Sigcomm ’23). Association for Computing Machinery, New York, NY, USA, 275–
2023
-
[4]
doi:10.1145/3603269.3604878
-
[5]
Shinichi Awamoto and Michio Honda. 2025. Opening up Kernel-Bypass TCP Stacks. InProceedings of the 2025 USENIX Annual Technical Conference. Boston, USA. https://www.usenix.org/conference/atc25/presentation/awamoto
2025
-
[6]
Ivan Babrou, Jesper Dangaard Brouer, and Dao Quang Minh Daniel. 2025. ebpf_exporter: Prometheus Exporter for Custom eBPF Metrics. https://github. com/cloudflare/ebpf_exporter Accessed: 2025-11-14
2025
-
[7]
Runge, Florian Wohlfart, Bernd E
Alexander Beifuß, Daniel Raumer, Paul Emmerich, Torsten M. Runge, Florian Wohlfart, Bernd E. Wolfìnger, and Georg Carle. 2015. A Study of Networking Simon Sundberg, Anna Brunstrom, Simone Ferlin-Reiter, Jesper Dangaard Brouer, and Toke Høiland-Jørgensen Software Induced Latency. In2015 International Conference and Workshops on Networked Systems (NetSys). ...
-
[8]
Geoffrey Blake and Ali G. Saidi. 2015. Where Does the Time Go? Characterizing Tail Latency in Memcached. In2015 IEEE International Symposium on Perfor- mance Analysis of Systems and Software (ISPASS). 21–31. doi:10.1109/ISPASS. 2015.7095781
-
[9]
Richard Boulton, Steve Goldsmith, Maurizio Abba, and Matthew Bullock. 2025. Cloudflare Just Got Faster and More Secure, Powered by Rust. https://blog. cloudflare.com/20-percent-internet-upgrade/ Accessed: 2026-04-08
2025
-
[10]
Peter Cai and Martin Karsten. 2023. Kernel vs. User-Level Networking: Don’t Throw out the Stack with the Interrupts.Proceedings of the ACM on Measurement and Analysis of Computing Systems7, 3, Article 49 (Dec. 2023). doi:10.1145/ 3626780
2023
-
[11]
Qizhe Cai, Shubham Chaudhary, Midhul Vuppalapati, Jaehyun Hwang, and Rachit Agarwal. 2021. Understanding Host Network Stack Overheads. InProceed- ings of the 2021 ACM SIGCOMM 2021 Conference (SIGCOMM ’21). Association for Computing Machinery, New York, NY, USA, 65–77. doi:10.1145/3452296.3472888
-
[12]
Qizhe Cai, Midhul Vuppalapati, Jaehyun Hwang, Christos Kozyrakis, and Rachit Agarwal. 2022. Towardsµs Tail Latency and Terabit Ethernet: Disaggregating the Host Network Stack. InProceedings of the ACM SIGCOMM 2022 Conference (Sigcomm ’22). Association for Computing Machinery, New York, NY, USA, 767–
2022
-
[13]
doi:10.1145/3544216.3544230
-
[14]
Alexander Daichendt, Florian Wiedner, Jonas Andre, and Georg Carle. 2024. Applicability of Hardware-Supported Containers in Low-Latency Networking. In2024 20th International Conference on Network and Service Management (CNSM). 1–7. doi:10.23919/CNSM62983.2024.10814577
-
[15]
DPDK Project. 2026. DPDK – The Open Source Data Plane Development Kit Accelerating Network Performance. https://www.dpdk.org/ Accessed: 2026-01- 09
2026
-
[16]
Ted Dunning and Otmar Ertl. 2019. Computing Extremely Accurate Quantiles Using T-Digests. arXiv:1902.04023 [stat] doi:10.48550/arXiv.1902.04023
work page internal anchor Pith review Pith/arXiv arXiv doi:10.48550/arxiv.1902.04023 2019
-
[17]
Paul Emmerich, Daniel Raumer, Florian Wohlfart, and Georg Carle. 2014. A Study of Network Stack Latency for Game Servers. In2014 13th Annual Workshop on Network and Systems Support for Games. 1–6. doi:10.1109/NetGames.2014. 7008960
-
[18]
Sebastian Gallenmüller, Florian Wiedner, Johannes Naab, and Georg Carle. 2021. Ducked Tails: Trimming the Tail Latency of(f) Packet Processing Systems. In 2021 17th International Conference on Network and Service Management (CNSM). 537–543. doi:10.23919/CNSM52442.2021.9615532
-
[19]
Johan Garcia, Simon Sundberg, and Anna Brunstrom. 2025. A Detailed Charac- terization of Starlink One-Way Delay. InProceedings of the 2025 3rd Workshop on LEO Networking and Communication (LEO-NET ’25). Association for Computing Machinery, New York, NY, USA, 43–49. doi:10.1145/3748749.3749090
-
[20]
Bolaji Gbadamosi, Luigi Leonardi, Tobias Pulls, Toke Høiland-Jørgensen, Simone Ferlin-Reiter, Simo Sorce, and Anna Brunström. 2024. The eBPF Runtime in the Linux Kernel. arXiv:2410.00026 [cs] doi:10.48550/arXiv.2410.00026
-
[21]
Roni Haecki, Radhika Niranjan Mysore, Lalith Suresh, Gerd Zellweger, Bo Gan, Timothy Merrifield, Sujata Banerjee, and Timothy Roscoe. 2022. How to Diag- nose Nanosecond Network Latencies in Rich End-Host Stacks. In19th USENIX Symposium on Networked Systems Design and Implementation (NSDI 22). USENIX Association, Renton, WA, 861–877. https://www.usenix.org...
2022
-
[22]
Heinrich Hartmann and Theo Schlossnagle. 2020. Circllhist - A Log-Linear Histogram Data Structure for IT Infrastructure Monitoring.ArXivabs/2001.06561 (2020), 16. https://arxiv.org/pdf/2001.06561.pdf
arXiv 2020
-
[23]
Hengyoush. 2024. Kyanos. https://kyanos.pages.dev/ Accessed: 2026-01-20
2024
-
[24]
2025.Intel 64 and IA-32 Architectures Software Developer’s Manual
Intel Corporation. 2025.Intel 64 and IA-32 Architectures Software Developer’s Manual. Technical Report Volume 3C. https://www.intel.com/content/www/ us/en/developer/articles/technical/intel-sdm.html
2025
-
[25]
Matthias Jasny, Muhammad El-Hindi, Tobias Ziegler, and Carsten Binnig. 2025. A Wake-up Call for Kernel-Bypass on Modern Hardware. InProceedings of the 21st International Workshop on Data Management on New Hardware (DaMoN ’25). Association for Computing Machinery, New York, NY, USA, 1–5. doi:10.1145/ 3736227.3736235
arXiv 2025
-
[26]
Jialin Li, Naveen Kr. Sharma, Dan R. K. Ports, and Steven D. Gribble. 2014. Tales of the Tail: Hardware, OS, and Application-Level Sources of Tail Latency. In Proceedings of the ACM Symposium on Cloud Computing (Socc ’14). Association for Computing Machinery, New York, NY, USA, 1–14. doi:10.1145/2670979.2670988
-
[27]
Gray Liang and Martynas Pumputis. 2024. Pwru - Linux Kernel and BPF-based Networking Debugger. https://lpc.events/event/18/contributions/1942/
2024
-
[28]
2021.Investigating Causes of Jitter in Container Networking
Felix Maurer. 2021.Investigating Causes of Jitter in Container Networking. Master’s thesis. KTH Royal Institute of Technology. https://urn.kb.se/resolve?urn=urn: nbn:se:kth:diva-304351
2021
-
[29]
Davide Miola, Fulvio Risso, and Federico Parola. 2024. Measuring the Cost of the Linux Network Stack in Real-Time. In2024 IEEE 10th International Conference on Network Softwarization (NetSoft). 295–303. doi:10.1109/NetSoft60951.2024. 10588891
-
[30]
Ferguson, Hendrik Cech, Rohan Bose, Prakita Rayyan Renatin, Mahesh K
Nitinder Mohan, Andrew E. Ferguson, Hendrik Cech, Rohan Bose, Prakita Rayyan Renatin, Mahesh K. Marina, and Jörg Ott. 2024. A Multifaceted Look at Star- link Performance. InProceedings of the ACM Web Conference 2024 (WWW ’24). Association for Computing Machinery, New York, NY, USA, 2723–2734. doi:10.1145/3589334.3645328
-
[31]
Dejene Boru Oljira, Anna Brunstrom, Javid Taheri, and Karl-Johan Grinnemo
-
[32]
In2016 IEEE Global Communications Conference (GLOBECOM)
Analysis of Network Latency in Virtualized Environments. In2016 IEEE Global Communications Conference (GLOBECOM). 1–6. doi:10.1109/GLOCOM. 2016.7841603
-
[33]
Prometheus Authors and The Linux Foundation. 2025. Native Histograms | Prometheus. https://prometheus.io/docs/specs/native_histograms/ Accessed: 2025-11-19
2025
-
[34]
Shixiong Qi, Leslie Monis, Ziteng Zeng, Ian-chin Wang, and K. K. Ramakrish- nan. 2022. SPRIGHT: Extracting the Server from Serverless Computing! High- Performance eBPF-based Event-Driven, Shared-Memory Processing. InProceed- ings of the ACM SIGCOMM 2022 Conference (SIGCOMM ’22). Association for Com- puting Machinery, New York, NY, USA, 780–794. doi:10.114...
-
[35]
Mubashir Adnan Qureshi, Junhua Yan, Yuchung Cheng, Soheil Hassas Yeganeh, Yousuk Seung, Neal Cardwell, Willem De Bruijn, Van Jacobson, Jasleen Kaur, David Wetherall, and Amin Vahdat. 2023. Fathom: Understanding Datacenter Application Network Performance. InProceedings of the ACM SIGCOMM 2023 Conference (Acm Sigcomm ’23). Association for Computing Machiner...
-
[36]
Dylan Reimerink. 2025. Trampolines - eBPF Docs. https://docs.ebpf.io/linux/ concepts/trampolines/ Accessed: 2025-09-26
2025
-
[37]
Dylan Reimerink, Paul Houssel, Ali Ghaffarian, and Mahnur Asif. 2026. BPF_PROG_TYPE_KPROBE - eBPF Docs. https://docs.ebpf.io/linux/program- type/BPF_PROG_TYPE_KPROBE/ Accessed: 2026-04-07
2026
-
[38]
Dylan Reimerink and Giuseppe Ognibene. 2026. USDT - eBPF Docs. https: //docs.ebpf.io/linux/concepts/usdt/ Accessed: 2026-04-07
2026
-
[39]
2010.Dapper, a Large-Scale Distributed Systems Tracing Infrastructure
Benjamin H Sigelman, Luiz Andre Barroso, Mike Burrows, Pat Stephenson, Manoj Plakal, Donald Beaver, Saul Jaspan, and Chandan Shanbhag. 2010.Dapper, a Large-Scale Distributed Systems Tracing Infrastructure. Google Technical Report
2010
-
[40]
Junya Sugita, William Howard, and Amos Wenger. 2025. Oha. https://github. com/hatoo/oha Accessed: 2025-10-02
2025
-
[41]
Antoine Tenart, Paolo Valerio, and Adrián Moreno. 2025. Challenges and Limitations of Debugging Increasingly Complex Virtualized Networks with Retis. https://netdevconf.info/0x19/sessions/tutorial/challenges-and-limitations- of-debugging-increasingly-complex-virtualized-networks-with-retis.html
2025
-
[42]
The kernel development community. 2025. Segmentation Offloads — The Linux Kernel Documentation. https://docs.kernel.org/networking/segmentation- offloads.html#generic-segmentation-offload Accessed: 2025-11-21
2025
-
[43]
The kernel development community. 2025. Timestamping — The Linux Kernel Documentation. https://www.kernel.org/doc/html/latest/networking/ timestamping.html Accessed: 2025-09-25
2025
-
[44]
The Linux Foundation. 2026. Linux Kernel Source Code - Net/Core/Dev.c. https://git.kernel.org/pub/scm/linux/kernel/git/stable/linux.git/tree/net/core/ dev.c?h=v6.19.11#n5964 Accessed: 2026-04-08
2026
-
[45]
Midhul Vuppalapati, Saksham Agarwal, Henry Schuh, Baris Kasikci, Arvind Krishnamurthy, and Rachit Agarwal. 2024. Understanding the Host Net- work. InProceedings of the ACM SIGCOMM 2024 Conference (Acm Sigcomm ’24). Association for Computing Machinery, New York, NY, USA, 581–594. doi:10.1145/3651890.3672271
-
[46]
Johannes Weiner. 2018. PSI - Pressure Stall Information — The Linux Kernel Documentation. https://docs.kernel.org/accounting/psi.html Accessed: 2025-11- 20. A Ethics This work does not raise any ethical issues. B Additional details from testbed experiments We here share some additional information about the results from the experiments in the testbed cove...
2018
discussion (0)
Sign in with ORCID, Apple, or X to comment. Anyone can read and Pith papers without signing in.