Beyond Point Estimates: Reliable Evaluation of Prediction Performance Metrics under Clustered Data
Pith reviewed 2026-06-28 09:07 UTC · model grok-4.3
The pith
Representing prediction performance metrics as smooth functionals of confusion-matrix probabilities enables cluster-robust inference under dependent data.
A machine-rendered reading of the paper's core claim, the machinery that carries it, and where it could break.
Core claim
A broad class of prediction performance metrics can be expressed as smooth functionals of the cell probabilities in the confusion matrix; this representation justifies the use of the cluster-robust sandwich estimator to obtain valid asymptotic inference for both binary and multiclass classification under clustered sampling.
What carries the argument
Smooth functional representation of metrics in terms of confusion-matrix probabilities, which licenses the cluster-robust sandwich variance estimator.
Load-bearing premise
A broad class of performance metrics admit representation as smooth functionals of confusion-matrix probabilities.
What would settle it
Empirical coverage probabilities of the resulting intervals falling well below the nominal level in Monte Carlo experiments with clustered data for a metric outside the smooth-functional class.
Figures
read the original abstract
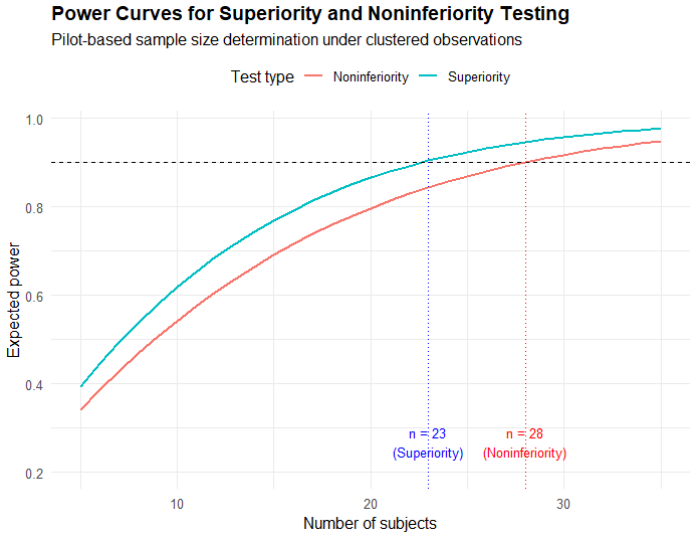
Prediction performance metrics such as accuracy and the F1 score are typically reported as single numbers, with no measure of uncertainty. The omission has been tolerable in exploratory settings, where model evaluation is used for informal comparison rather than formal decision-making. But as machine learning is deployed in real-world applications, evaluation results are increasingly used to support binary decisions -- whether a model meets a required standard or not -- making uncertainty quantification essential. The problem is compounded when data are dependent, as in repeated measurements, clustered subjects, or time series, where variability is harder to assess and easy to underestimate. We develop a unified framework that links a broad class of performance metrics through their representation as smooth functionals of confusion-matrix probabilities. This representation allows the use of the cluster-robust sandwich variance estimator to obtain asymptotically valid confidence intervals, hypothesis tests, and paired model comparisons for both binary and multiclass problems under clustered data. We also provide power and sample size approximations based on pilot data, enabling principled study design for model evaluation. Simulations show that the proposed methods achieve near-nominal coverage across a range of dependence structures, while naive methods underestimate variability. A real-data application further illustrates how accounting for clustering can materially change conclusions. These results offer a practical foundation for uncertainty quantification and study design in prediction performance evaluation, in settings where decisions should be justified under dependent and clustered data.
Editorial analysis
A structured set of objections, weighed in public.
Referee Report
Summary. The paper develops a unified framework representing a broad class of prediction performance metrics (accuracy, F1, etc.) as smooth functionals g(θ) of confusion-matrix cell probabilities θ. Cluster-level averages yield θ̂ whose asymptotic covariance is estimated by the cluster-robust sandwich; the delta method then supplies the asymptotic variance of g(θ̂). This yields CIs, tests, and paired comparisons under clustered data for binary and multiclass settings, plus power/sample-size approximations from pilot data. Simulations show near-nominal coverage; a real-data example illustrates changed conclusions when clustering is accounted for.
Significance. If the representation and regularity conditions hold, the work supplies a practical, asymptotically justified tool for uncertainty quantification in ML evaluation under dependence—an increasingly relevant need as metrics support binary decisions. It applies standard M-estimation/sandwich theory to this domain without circularity. Credit is due for the explicit simulation confirmation of coverage across dependence structures and for including pilot-data-based study-design formulas.
major comments (2)
- [Abstract and functional-representation section] Abstract and the section introducing the functional representation: the claim that a broad class of metrics (including F1) admit smooth functional representations g(θ) requires explicit statement of the differentiability conditions and handling of points where denominators vanish; without these, the delta-method justification for asymptotic validity under clustering is not fully load-bearing.
- [Simulation section] Simulation results (coverage tables): the reported near-nominal coverage is consistent with theory, but the manuscript must specify the exact cluster sizes, intra-cluster correlation values, and multiclass zero-cell handling rules used, because these directly test the weakest assumption that the functional representation remains valid at the simulated operating points.
minor comments (3)
- Introduce the notation θ and g(θ) with a short display equation in the introduction rather than deferring it.
- [Real-data application] In the real-data application, state the number of clusters and average cluster size explicitly.
- [Method section] Add a short remark on whether the sandwich estimator is the usual one or a finite-sample variant.
Simulated Author's Rebuttal
We thank the referee for the constructive comments and positive recommendation. We address each major comment below.
read point-by-point responses
-
Referee: [Abstract and functional-representation section] Abstract and the section introducing the functional representation: the claim that a broad class of metrics (including F1) admit smooth functional representations g(θ) requires explicit statement of the differentiability conditions and handling of points where denominators vanish; without these, the delta-method justification for asymptotic validity under clustering is not fully load-bearing.
Authors: We agree that the differentiability conditions and treatment of vanishing denominators should be stated explicitly. The revised manuscript will add a paragraph in the functional-representation section specifying that g is continuously differentiable in a neighborhood of the true θ (with the gradient bounded away from zero) and will note that the probability of denominator zero events vanishes asymptotically under the maintained assumption that class probabilities are bounded away from zero; boundary cases are handled by continuity of the metric. This makes the delta-method argument fully rigorous. revision: yes
-
Referee: [Simulation section] Simulation results (coverage tables): the reported near-nominal coverage is consistent with theory, but the manuscript must specify the exact cluster sizes, intra-cluster correlation values, and multiclass zero-cell handling rules used, because these directly test the weakest assumption that the functional representation remains valid at the simulated operating points.
Authors: We accept the request for greater transparency. The revised simulation section will include an explicit table (or expanded text) listing the precise cluster sizes, intra-cluster correlation values, and the zero-cell handling rule employed for multiclass problems. This addition will allow direct verification that the functional representation remains valid at the simulated points. revision: yes
Circularity Check
No significant circularity
full rationale
The paper's core contribution is a direct application of M-estimation and the delta method: performance metrics are expressed as smooth functionals g(θ) of confusion-matrix cell probabilities θ (estimated via cluster averages), with the cluster-robust sandwich providing the asymptotic covariance of θ̂ and the delta method supplying the variance of g(θ̂). This is standard estimating-equation theory under independent clusters and does not reduce any target quantity to a parameter fitted from the same data by construction, nor does it rely on self-citations, uniqueness theorems, or smuggled ansatzes. Simulations and the real-data example serve as external checks rather than internal definitions. The derivation chain is therefore self-contained against external statistical benchmarks.
Axiom & Free-Parameter Ledger
axioms (1)
- domain assumption Performance metrics can be represented as smooth functionals of confusion-matrix probabilities
Reference graph
Works this paper leans on
-
[1]
doi:https://doi.org/10.1093/qje/qjac038
When should you adjust standard errors for clustering? The Quarterly Journal of Eco- nomics 138, 1–35. doi:https://doi.org/10.1093/qje/qjac038. Abnoosian, K., Farnoosh, R., Behzadi, M.H.,
-
[2]
Journal of medical Internet research 27, e72216
At-home evaluation of both wearable and touchless digital health tech- nologies for measuring nocturnal scratching in atopic dermatitis: Ana- lytical validation study. Journal of medical Internet research 27, e72216. doi:https://doi.org/10.2196/72216. Bartko, J.J.,
-
[3]
Psychological reports 19, 3–11
The intraclass correlation coefficient as a measure of re- liability. Psychological reports 19, 3–11. doi:https://doi.org/10.2466/ pr0.1966.19.1.3. Berk, R., Brown, L., Buja, A., Zhang, K., Zhao, L.,
1966
-
[4]
The Annals of Statistics , 802–837doi:http://doi
Valid post- selection inference. The Annals of Statistics , 802–837doi:http://doi. org/10.1214/12-AOS1077. Billingsley, P.,
-
[5]
Convergence of probability measures. John Wiley & Sons, New York. doi:https://doi.org/10.1002/9780470316962. Cameron, A.C., Gelbach, J.B., Miller, D.L.,
-
[6]
doi:https://doi.org/10.1198/jbes.2010.07136. Chan, I.S., Zhang, Z.,
-
[7]
Test-based exact confidence intervals for the difference of two binomial proportions. Biometrics 55, 1202–1209. doi:https://doi.org/10.1111/j.0006-341X.1999.01202.x. 48 Chekroud, A.M., Hawrilenko, M., Loho, H., Bondar, J., Gueorguieva, R., Hasan, A., Kambeitz, J., Corlett, P.R., Koutsouleris, N., Krumholz, H.M., et al.,
-
[8]
Illusory generalizability of clinical prediction models. Science 383, 164–167. doi:https://doi.org/10.1126/science.adg8538. Chicco, D., Jurman, G.,
-
[9]
The use of confidence or fiducial limits illustrated in the case of the binomial. Biometrika 26, 404–413. doi:https: //doi.org/10.2307/2331986. Colin Cameron, A., Miller, D.L.,
-
[10]
Journal of human resources 50, 317–372
A practitioner’s guide to cluster- robust inference. Journal of human resources 50, 317–372. doi:https: //doi.org/10.3368/jhr.50.2.317. Esteva, A., Kuprel, B., Novoa, R.A., Ko, J., Swetter, S.M., Blau, H.M., Thrun, S.,
-
[11]
Japanese journal of radiol- ogy 37, 466–472
Distinction between benign and malignant breast masses at breast ultrasound using deep learn- ing method with convolutional neural network. Japanese journal of radiol- ogy 37, 466–472. doi:https://doi.org/10.1007/s11604-019-00831-5. Hastie, T., Tibshirani, R., Friedman, J.,
-
[12]
The elements of statistical learning: data mining, inference, and prediction. 2nd ed., Springer, New York. doi:https://doi.org/10.1007/978-0-387-84858-7. Itaya, Y., Tamura, J., Hayashi, K., Yamamoto, K.,
-
[13]
Statistics in Medicine 44, e10303
Asymptotic proper- ties of matthews correlation coefficient. Statistics in Medicine 44, e10303. doi:https://doi.org/10.1002/sim.10303. Joe, H.,
-
[14]
1st ed., Chapman and Hall/CRC, New York
Dependence modeling with copulas. 1st ed., Chapman and Hall/CRC, New York. doi:https://doi.org/10.1201/b17116. 49 Liang, K.Y., Zeger, S.L.,
-
[15]
Journal of Applied Econometrics 32, 233–254
Wild bootstrap inference for wildly different cluster sizes. Journal of Applied Econometrics 32, 233–254. doi:https://doi.org/10.1002/jae.2508. Maleki, F., Ovens, K., Gupta, R., Reinhold, C., Spatz, A., Forghani, R.,
-
[16]
Radiology: Artificial Intelligence 5, e220028
Generalizability of machine learning models: quantitative evaluation of three methodological pitfalls. Radiology: Artificial Intelligence 5, e220028. doi:https://doi.org/10.1148/ryai.220028. Manning, C.D., Raghavan, P., Schütze, H.,
-
[17]
Cambridge University Press, Cambridge
Introduction to information retrieval. Cambridge University Press, Cambridge. doi:https://doi.org/ 10.1017/CBO9780511809071. Matthews, B.W.,
-
[18]
doi:https: //doi.org/10.1038/s41746-023-00841-8. Müller, R., Büttner, P.,
-
[19]
Statistics in medicine 13, 2465–2476
A critical discussion of intraclass correlation coefficients. Statistics in medicine 13, 2465–2476. doi:https://doi.org/ 10.1002/sim.4780132310. Oehlert, G.W.,
-
[20]
HTTP Mailbox - Asynchronous RESTful Communication
A note on the delta method. The American Statistician 46, 27–29. doi:https://doi.org/10.1080/00031305.1992.10475842. Sathyanarayana, A., Joty, S., Fernandez-Luque, L., Ofli, F., Srivastava, J., Elmagarmid, A., Arora, T., Taheri, S.,
work page internal anchor Pith review Pith/arXiv arXiv doi:10.1080/00031305.1992.10475842 1992
-
[21]
JMIR mHealth and uHealth 4, e6562
Sleep quality prediction from wearable data using deep learning. JMIR mHealth and uHealth 4, e6562. doi:https://doi.org/10.2196/mhealth.6562. Stone, M.,
-
[22]
Journal of the royal statistical society: Series B (Methodolog- ical) 36, 111–133
Cross-validatory choice and assessment of statistical pre- dictions. Journal of the royal statistical society: Series B (Methodolog- ical) 36, 111–133. doi:https://doi.org/10.1111/j.2517-6161.1974. tb00994.x. 50 Takahashi, K., Yamamoto, K., Kuchiba, A., Koyama, T.,
-
[23]
Statistics in medicine 42, 4177–4192
Hypothesis testing procedure for binary and multi-class f1-scores in the paired design. Statistics in medicine 42, 4177–4192. doi:https://doi. org/10.1002/sim.9853. Van der Vaart, A.W.,
-
[24]
Cambridge university press, Cambridge
Asymptotic statistics. Cambridge university press, Cambridge. doi:https://doi.org/10.1017/CBO9780511802256. Walker, E., Nowacki, A.S.,
-
[25]
Journal of general internal medicine 26, 192–196
Understanding equivalence and non- inferiority testing. Journal of general internal medicine 26, 192–196. doi:https://doi.org/10.1007/s11606-010-1513-8. Windmeijer, F.,
-
[26]
Journal of econometrics 126, 25–51
A finite sample correction for the variance of linear efficient two-step gmm estimators. Journal of econometrics 126, 25–51. doi:https://doi.org/10.1016/j.jeconom.2004.02.005. Zwack, C.C., Haghani, M., Hollings, M., Zhang, L., Gauci, S., Gallagher, R., Redfern, J.,
-
[27]
doi:https: //doi.org/10.1038/s41746-022-00734-2. 51
discussion (0)
Sign in with ORCID, Apple, or X to comment. Anyone can read and Pith papers without signing in.