Building drag and shielding in a realistic urban environment
Pith reviewed 2026-06-30 11:27 UTC · model grok-4.3
The pith
Upstream shielding primarily controls drag on individual buildings in realistic urban layouts.
A machine-rendered reading of the paper's core claim, the machinery that carries it, and where it could break.
Core claim
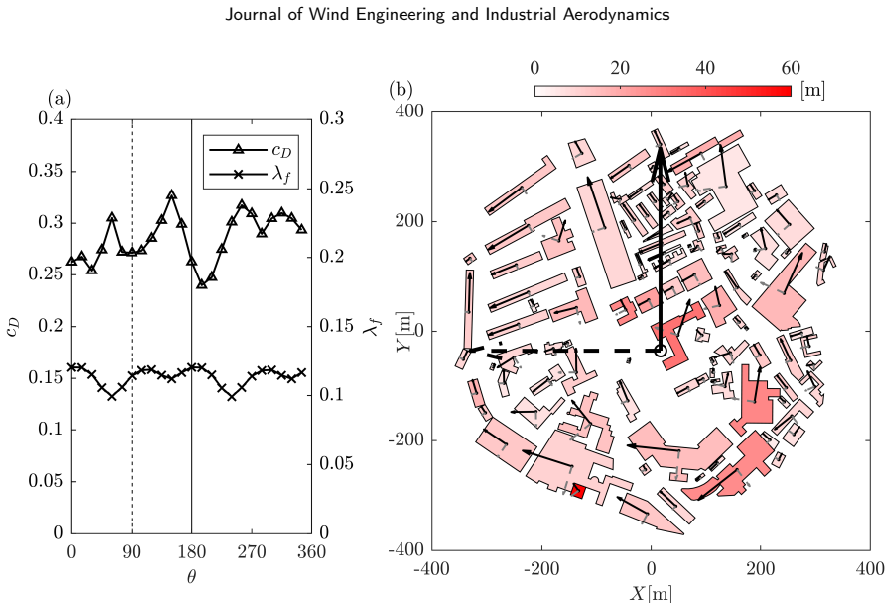
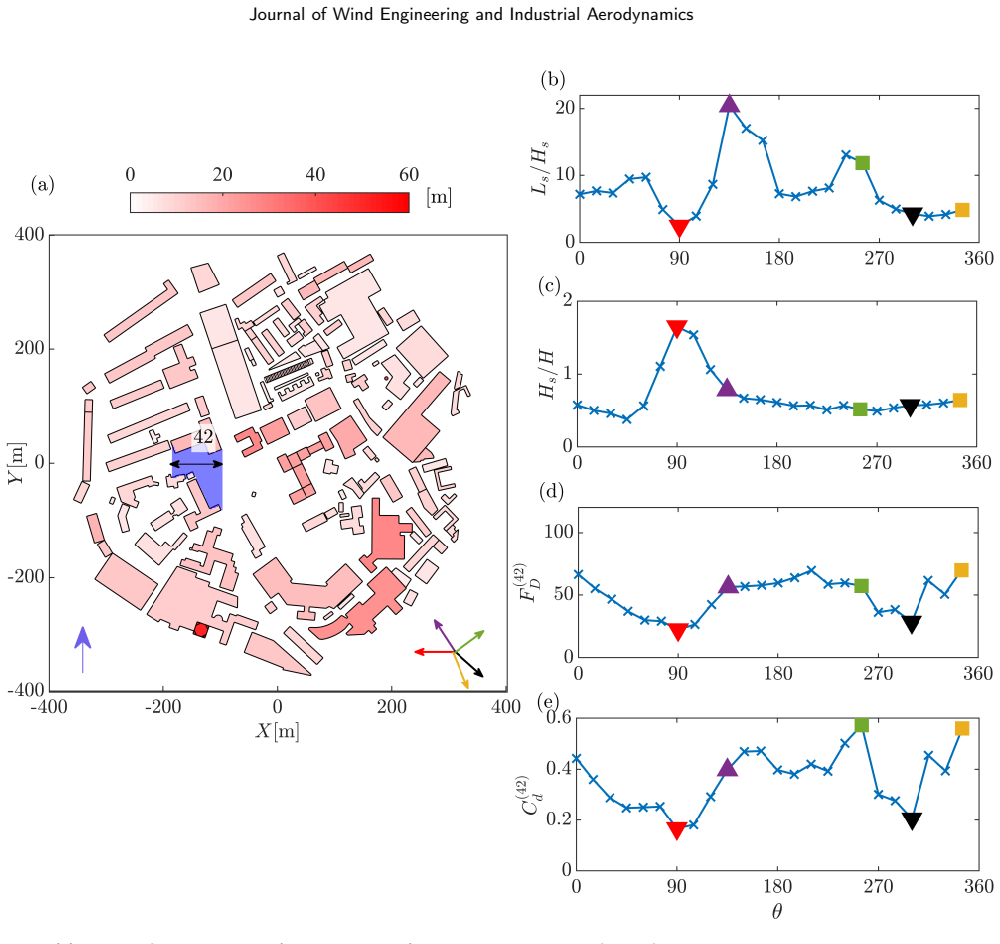
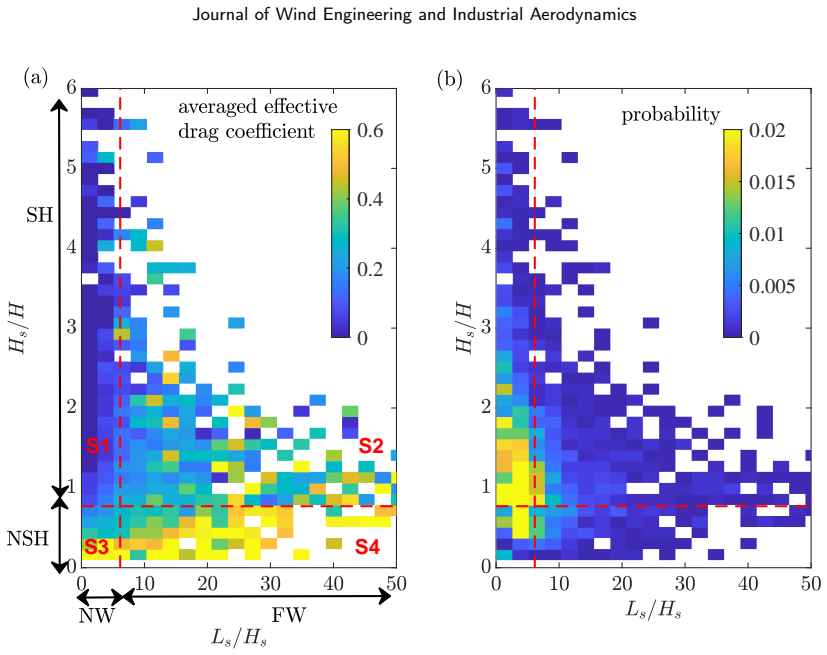
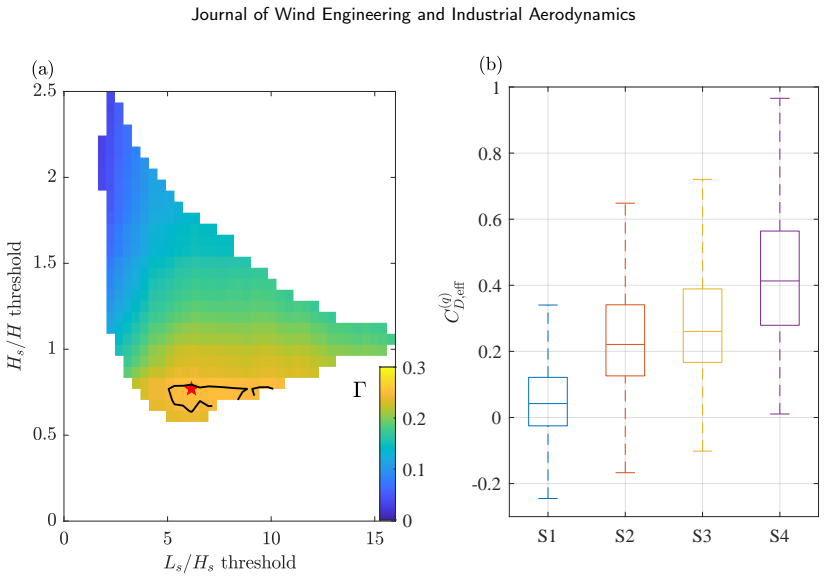
In the Bristol campus morphology, shielding by upstream buildings is the dominant control on the drag force experienced by individual structures. The upstream fetch ratio L_s/H_s and relative height ratio H_s/H provide a straightforward way to classify shielding conditions for any building and wind direction. Application of these ratios shows that a few large, exposed buildings account for most of the campus drag, while many smaller or sheltered buildings contribute little.
What carries the argument
The upstream fetch ratio L_s/H_s and relative height ratio H_s/H, two dimensionless parameters that quantify the distance and height of the nearest upstream obstacle relative to a target building and thereby classify its shielding regime.
If this is right
- Shielding-aware definitions of effective frontal area and drag coefficient are required for accurate urban drag estimates.
- The two ratios allow rapid classification of sheltered versus exposed buildings without full flow simulation.
- A small subset of large buildings dominates total urban drag in this morphology.
- The framework can be applied to other complex city layouts to map drag distribution.
- Individual building drag varies far more with wind direction than does the campus-wide total drag.
Where Pith is reading between the lines
- City-scale wind-load models could incorporate the two ratios to adjust drag coefficients for local sheltering.
- Urban design guidelines might use these ratios to identify buildings likely to experience high drag and plan accordingly.
- The same parameters could help estimate how changes in building height or spacing would alter overall city drag.
Load-bearing premise
The large-eddy simulations of the Bristol campus layout correctly reproduce the actual drag forces and shielding patterns that would occur in the real environment.
What would settle it
Field measurements of wind forces on several Bristol campus buildings under known wind directions, compared directly against the simulated drag values for the same conditions.
Figures


read the original abstract
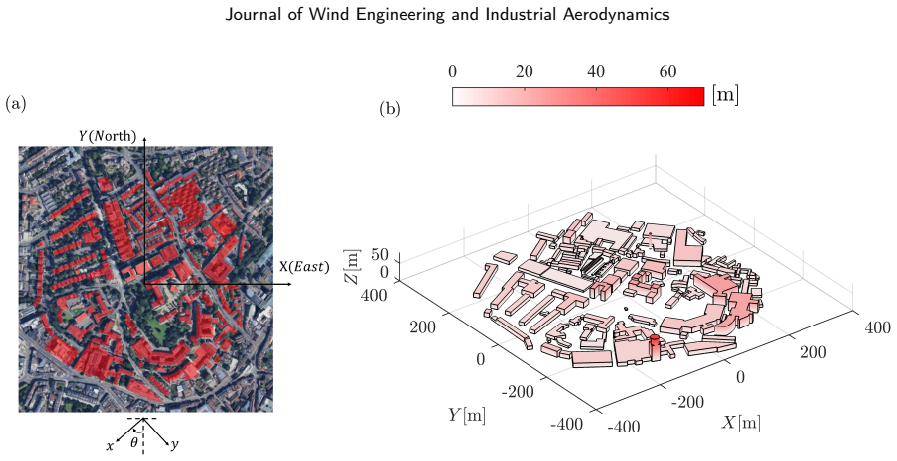
Shielding by upstream buildings is a fundamental control on urban drag, yet its influence remains poorly quantified in realistic urban environments. Here, we investigate shielding effects using building-resolved large-eddy simulations of the University of Bristol campus, comprising 110 buildings of varying height, shape and orientation. Twenty-four wind directions are considered, allowing each building to experience a wide range of upstream shielding conditions. While the total drag of the campus exhibits only moderate directional variability, the drag acting on individual buildings varies substantially. In the present case, approximately $20\%$ of buildings account for $80\%$ of the total drag, which is primarily attributed to a small number of large buildings that contribute disproportionately high drag forces. To quantify shielding, we introduce two dimensionless parameters: the upstream fetch ratio, $L_s/H_s$, and the relative height ratio, $H_s/H$, where $L_s$ is the distance to the nearest upstream obstacle, $H_s$ is the height of the upstream obstacle, and $H$ is the height of the target building. These parameters distinguish between near- and far-wake conditions and between sheltered and exposed buildings, providing a simple method to characterise shielding effects in realistic urban environments. The study provides valuable quantitative insight into drag and shielding in the Bristol campus morphology; more importantly, it establishes a general framework for analysing drag and shielding that can be applied in other complex urban environments. The results identify shielding as a primary control on building drag and motivate shielding-aware measures of effective frontal area and drag coefficient
Editorial analysis
A structured set of objections, weighed in public.
Referee Report
Summary. The paper uses building-resolved large-eddy simulations of the University of Bristol campus (110 buildings) across 24 wind directions to quantify shielding effects on drag. It reports that ~20% of buildings account for 80% of total drag (driven by a few large buildings), introduces the upstream fetch ratio L_s/H_s and relative height ratio H_s/H to distinguish near/far-wake and sheltered/exposed regimes, and concludes that shielding is a primary control on building drag while motivating shielding-aware effective frontal area and drag coefficient measures. The work also claims to establish a general framework applicable to other urban morphologies.
Significance. If the simulated drag forces are accurate, the identification of a strong 20/80 drag distribution and the simple dimensionless parameters for classifying shielding provide a practical, morphology-aware approach that could improve urban canopy drag parameterizations and wind-load estimates beyond current uniform or isolated-building assumptions.
major comments (2)
- [Abstract] Abstract: the central claim that shielding is the primary control on drag (and the proposed utility of L_s/H_s and H_s/H) is extracted directly from the LES-derived per-building force budgets, yet the manuscript reports no validation of these drag values against field measurements, wind-tunnel data, or any sensitivity tests to grid resolution, domain truncation, wall modeling, or SGS closure. Any systematic bias in the force budgets would propagate directly into the 20/80 attribution and the wake-regime distinctions.
- The quantitative results (20/80 distribution, directional variability of individual-building drag) treat the LES outputs as faithful representations of real aerodynamic loading, but no error estimation, grid-convergence checks, or post-processing details for force integration are described, leaving the load-bearing numerical foundation unverified.
minor comments (1)
- [Abstract] The abstract states that the framework 'can be applied in other complex urban environments' but provides no concrete example or test on a second morphology to support this generality claim.
Simulated Author's Rebuttal
We thank the referee for the constructive comments on validation and numerical verification. These points identify a genuine limitation in the current manuscript. We address each comment below and indicate where revisions will be made. The study focuses on relative drag partitioning and a shielding classification framework rather than absolute force values, but we agree that explicit discussion of numerical foundations is warranted.
read point-by-point responses
-
Referee: [Abstract] Abstract: the central claim that shielding is the primary control on drag (and the proposed utility of L_s/H_s and H_s/H) is extracted directly from the LES-derived per-building force budgets, yet the manuscript reports no validation of these drag values against field measurements, wind-tunnel data, or any sensitivity tests to grid resolution, domain truncation, wall modeling, or SGS closure. Any systematic bias in the force budgets would propagate directly into the 20/80 attribution and the wake-regime distinctions.
Authors: We agree that direct validation of the per-building drag forces against measurements is absent. No field or wind-tunnel data exist for the Bristol campus at building-resolved scale across 24 directions. The LES setup follows standard practices used in prior urban canopy studies (e.g., references to validated codes and closures will be added). The 20/80 distribution and regime distinctions are relative within the simulated ensemble; absolute magnitudes are not claimed to be predictive. In revision we will (i) add an explicit limitations paragraph on the lack of site-specific validation, (ii) reference existing LES validation benchmarks for similar urban morphologies, and (iii) include a short discussion of how systematic bias would affect the reported ratios. No new simulations are planned. revision: partial
-
Referee: [—] The quantitative results (20/80 distribution, directional variability of individual-building drag) treat the LES outputs as faithful representations of real aerodynamic loading, but no error estimation, grid-convergence checks, or post-processing details for force integration are described, leaving the load-bearing numerical foundation unverified.
Authors: We accept that error bars, grid-convergence data, and force-integration details are not reported. The manuscript will be revised to include: (a) the exact surface-integration procedure used to obtain per-building forces, (b) any available domain-size and resolution sensitivity tests performed during setup, and (c) a brief statement on the absence of a full grid-convergence study for the 110-building domain (computational cost precludes repeating all 24 directions at multiple resolutions). These additions will be placed in a new Methods subsection. We do not claim the forces are error-free; the framework is presented as morphology-aware rather than quantitatively predictive. revision: partial
- Direct validation of per-building drag forces against field or wind-tunnel measurements for the Bristol campus
Circularity Check
No circularity; results from direct LES force budgets and new geometric definitions
full rationale
The paper computes total and per-building drag directly from building-resolved large-eddy simulations of the Bristol campus morphology across 24 wind directions. The parameters L_s/H_s and H_s/H are introduced explicitly as new dimensionless ratios based on upstream geometry (distance and height of nearest obstacle relative to target building height), then used to bin the simulation outputs into wake regimes. No equations define drag in terms of these ratios or vice versa; the attribution of drag variation to shielding follows from the raw force budgets rather than any fitted parameter or self-referential relation. No load-bearing self-citations or uniqueness theorems are invoked in the provided text. The derivation chain is therefore self-contained against the simulation data.
Axiom & Free-Parameter Ledger
axioms (1)
- domain assumption Large-eddy simulation resolves the dominant turbulent structures and surface drag forces sufficiently for the campus morphology
Reference graph
Works this paper leans on
-
[1]
Abel, S. J. and Shipway, B. J. , title =. Quarterly Journal of the Royal Meteorological Society , volume =. https://rmets.onlinelibrary.wiley.com/doi/pdf/10.1002/qj.55 , year =
-
[2]
Abma, Dick and Heus, Thijs and Mellado, Juan Pedro , title =. J. Atmos. Sci. , volume =. 2013 , month =
2013
-
[3]
Moscow Izdatel Nauka , keywords =
The theory of turbulent jets (2nd revised and enlarged edition). Moscow Izdatel Nauka , keywords =
-
[4]
Mixing at Turbidity Current Heads, and Its Geological Implications , author=. J. Sediment. Res. , year=
-
[5]
Ansong, Joseph K. and Kyba, Patrick J. and Sutherland, Bruce R. , year=. Fountains impinging on a density interface , volume=. doi:10.1017/S0022112007009093 , journal=
-
[6]
Interaction of a Cumulus Cloud Ensemble with the Large-Scale Environment, Part I
Akio Arakawa and Wayne Howard Schubert. Interaction of a Cumulus Cloud Ensemble with the Large-Scale Environment, Part I. J. Atmos. Sci. 1974
1974
-
[7]
and Klippel, K
Auerswald, T. and Klippel, K. and Thomas, T. G. and others , title =. Boundary-Layer Meteorology , volume =. 2024 , doi =
2024
-
[8]
Asai, Tomio and Kasahara, Akira , title = ". J. Atmos. Sci. , volume =. 1967 , month =
1967
-
[9]
Athanatopoulou, A. M. and Doudoumis, I. N. , title =. The Structural Design of Tall and Special Buildings , volume =. doi:https://doi.org/10.1002/tal.385 , url =. https://onlinelibrary.wiley.com/doi/pdf/10.1002/tal.385 , year =
-
[10]
Michael Baldauf and Axel Seifert and Jochen Förstner and Detlev Majewski and Matthias Raschendorfer and Thorsten Reinhardt. Operational Convective-Scale Numerical Weather Prediction with the COSMO Model: Description and Sensitivities. Monthly Weather Review. 2011. doi:10.1175/MWR-D-10-05013.1
-
[11]
Baines, W. D. , year=. Entrainment by a plume or jet at a density interface , volume=. J. Fluid Mech. , publisher=. doi:10.1017/S0022112075000821 , number=
-
[12]
Baines, W. D. and Turner, J. S. and Campbell, I. H. , year=. Turbulent fountains in an open chamber , volume=. doi:10.1017/S0022112090002099 , journal=
-
[13]
Baines, W. D. and Corriveau, A. F. and Reedman, T. J. , year=. Turbulent fountains in a closed chamber , volume=. doi:10.1017/S0022112093002617 , journal=
-
[14]
Baj, Pawel and Buxton, Oliver R. H. , year=. Passive scalar dispersion in the near wake of a multi-scale array of rectangular cylinders , volume=. J. Fluid Mech. , publisher=
-
[15]
Mixing and transport in urban areas , volume =
Belcher, Stephen E , year =. Mixing and transport in urban areas , volume =. Philosophical transactions. Series A, Mathematical, physical, and engineering sciences , doi =
-
[16]
Betts, A. K. , title =. Q. J. R. Meteorol. Soc. , volume =
-
[17]
HCLIM38: a flexible regional climate model applicable for different climate zones from coarse to convection-permitting scales , JOURNAL =
Belu. HCLIM38: a flexible regional climate model applicable for different climate zones from coarse to convection-permitting scales , JOURNAL =. 2020 , NUMBER =
2020
-
[18]
, title = "
Betts, Alan K. , title = ". J. Atmos. Sci. , volume =. 1975 , month =
1975
-
[19]
and Olson, Britton J
Blakeley, Brandon C. and Olson, Britton J. and Riley, James J. , year=. Self-similarity of scalar isosurface area density in a temporal mixing layer , volume=. J. Fluid Mech. , publisher=
-
[20]
and Kerr, Ross C
Bloomfield, Lynn J. and Kerr, Ross C. , year=. A theoretical model of a turbulent fountain , volume=. J. Fluid Mech. , publisher=
-
[21]
Lewis Blunn and Omduth Coceal and Negin Nazarian and Janet Barlow and Bob Plant and Sylvia Bohnenstengel and Humphrey Lean , title =. 2022 , journal =. doi:10.1007/s10546-021-00658-6 , pages =
-
[22]
I. A. Boutle and J. E. J. Eyre and A. P. Lock. Seamless Stratocumulus Simulation across the Turbulent Gray Zone. Monthly Weather Review. 2014. doi:10.1175/MWR-D-13-00229.1
-
[23]
Entrainment at multi-scales in shear-dominated and Rayleigh–Taylor turbulence , journal =
Stefano Brizzolara and Jean-Paul Mollicone and Maarten. Entrainment at multi-scales in shear-dominated and Rayleigh–Taylor turbulence , journal =. 2023 , issn =
2023
-
[24]
and Sobel, Adam and Watanabe, Masahiro and Webb, Mark , year =
Bony, Sandrine and Stevens, Bjorn and Frierson, Dargan and Jakob, Christian and Kageyama, Masa and Pincus, Robert and Shepherd, Ted and Sherwood, Steven and Siebesma, A.P. and Sobel, Adam and Watanabe, Masahiro and Webb, Mark , year =. Clouds, circulation and climate sensitivity , volume =. Nature Geoscience , doi =
-
[25]
Monthly Weather Review , year = 1989, month = jan, volume =
Parameterization of orographic induced turbulence in a mesobeta scale model. Monthly Weather Review , year = 1989, month = jan, volume =. doi:10.1175/1520-0493(1989)117<1872:POOITI>2.0.CO;2 , adsurl =
-
[26]
Large-Eddy Simulation of a Katabatic Jet along a Convexly Curved Slope
Christophe Brun and Sébastien Blein and Jean-Pierre Chollet. Large-Eddy Simulation of a Katabatic Jet along a Convexly Curved Slope. Part I: Statistical Results. Journal of the Atmospheric Sciences. 2017. doi:10.1175/JAS-D-16-0152.1
-
[27]
George H. Bryan and John C. Wyngaard and J. Michael Fritsch. Resolution Requirements for the Simulation of Deep Moist Convection. Monthly Weather Review. 2003. doi:10.1175/1520-0493(2003)131<2394:RRFTSO>2.0.CO;2
-
[28]
and McCaa, James R
Bretherton, Christopher S. and McCaa, James R. and Grenier, Hervé , title = ". Monthly Weather Review , volume =. 2004 , month =
2004
-
[29]
, title =
Bretherton, Christopher S. , title =. Philosophical Transactions of the Royal Society A: Mathematical, Physical and Engineering Sciences , volume =. 2015 , doi =
2015
-
[30]
Burridge, H. C. and Hunt, G. R. , year=. The rise heights of low- and high-. J. Fluid Mech. , publisher=
-
[31]
Burridge, H. C. and Hunt, G. R. , year=. The rhythm of fountains: the length and time scales of rise height fluctuations at low and high. J. Fluid Mech. , publisher=
-
[32]
Burridge, H. C. and Hunt, G. R. , year=. Scaling arguments for the fluxes in turbulent miscible fountains , volume=. J. Fluid Mech. , publisher=
-
[33]
Burridge, H. C. and Mistry, A and Hunt, GR , journal=. The effect of source. 2015 , publisher=
2015
-
[34]
Burridge, H. C. and Hunt, G. R. , year=. Entrainment by turbulent fountains , volume=. J. Fluid Mech. , publisher=
-
[35]
Burridge, H. C. and J.L. Partridge and P.F. Linden , title =. Atmosphere-Ocean , volume =. 2016 , publisher =
2016
-
[36]
Burridge, H. C. and Parker, D. A. and Kruger, E. S. and Partridge, J. L. and Linden, P. F. , year=. Conditional sampling of a high. J. Fluid Mech. , publisher=
-
[37]
and Allen, T
Bush, M. and Allen, T. and Bain, C. and Boutle, I. and Edwards, J. and Finnenkoetter, A. and Franklin, C. and Hanley, K. and Lean, H. and Lock, A. and Manners, J. and Mittermaier, M. and Morcrette, C. and North, R. and Petch, J. and Short, C. and Vosper, S. and Walters, D. and Webster, S. and Weeks, M. and Wilkinson, J. and Wood, N. and Zerroukat, M. , TI...
2020
-
[38]
Cardoso, Silvana S. S. and Woods, Andrew W. , year=. Mixing by a turbulent plume in a confined stratified region , volume=. J. Fluid Mech. , publisher=
-
[39]
Scaling of Flows Over Realistic Urban Geometries: A Large-Eddy Simulation Study , volume =
Cheng, Wai-Chi and Yang, Ying , year =. Scaling of Flows Over Realistic Urban Geometries: A Large-Eddy Simulation Study , volume =
-
[40]
Claus, Jean and Coceal, O. and Thomas, T. Glyn and Branford, S. and Belcher, S. E. and Castro, Ian P. , title =. Boundary-Layer Meteorology , year =. doi:10.1007/s10546-011-9667-4 , url =
-
[41]
and Bulot, Florentin M
Clements, Dominic and Coburn, Matthew and Cox, Simon J. and Bulot, Florentin M. J. and Xie, Zheng-Tong and Vanderwel, Christina , TITLE =. Atmosphere , VOLUME =. 2024 , NUMBER =
2024
-
[42]
and Xie, Z
Coburn, M. and Xie, Z. T. and Herring, S. J. , title =. Boundary-Layer Meteorology , volume =. 2022 , doi =
2022
-
[43]
, year =
Corrsin, S. , year =. Some current problems in turbulent shear flows , volume =
-
[44]
Coceal, O. and Belcher, S. E. , title =. Quarterly Journal of the Royal Meteorological Society , volume =. doi:https://doi.org/10.1256/qj.03.40 , url =
-
[45]
2006 , pages =
Mean flow and turbulence statistics over groups of urban-like cubical obstacles , author =. 2006 , pages =
2006
-
[46]
and Belcher, Stephen E , year =
Coceal, Omduth and Thomas, T. and Belcher, Stephen E , year =. Spatial Variability of Flow Statistics within Regular Building Arrays , volume =. Boundary-Layer Meteorology , doi =
-
[47]
and Breidenthal, R
Cotel, Aline and Gjestvang, Jens and Ramkhelawan, N. and Breidenthal, R. , year =. Laboratory experiments of a jet impinging on a stratified interface , volume =
-
[48]
Energy dispersion in turbulent jets
Craske, John and Van Reeuwijk, Maarten , year=. Energy dispersion in turbulent jets. Part 1. Direct simulation of steady and unsteady jets , volume=. J. Fluid Mech. , publisher=
-
[49]
Generalised unsteady plume theory , volume=
Craske, John and Van Reeuwijk, Maarten , year=. Generalised unsteady plume theory , volume=. J. Fluid Mech. , publisher=
-
[50]
Cuijpers, J. W. M. and Duynkerke, P. G. , title = ". J. Atmos. Sci. , volume =. 1993 , month =
1993
-
[51]
Peak loading and surface pressure fluctuations of a tall model building , journal =. 2013 , issn =. doi:https://doi.org/10.1016/j.jweia.2013.06.014 , author =
-
[52]
Da Silva, C. B. and Métais, O. , year=. On the influence of coherent structures upon interscale interactions in turbulent plane jets , volume=. J. Fluid Mech. , publisher=
-
[53]
and Hunt, Julian C.R
Da Silva, Carlos B. and Hunt, Julian C.R. and Eames, Ian and Westerweel, Jerry , title =. Annu. Rev. Fluid Mech. , volume =
-
[54]
Jordan T. Dawe and Philip H. Austin. The Influence of the Cloud Shell on Tracer Budget Measurements of LES Cloud Entrainment. Journal of the Atmospheric Sciences. 2011. doi:10.1175/2011JAS3658.1
-
[55]
Direct entrainment and detrainment rate distributions of individual shallow cumulus clouds in an LES , author=. ATMOS. CHEM. PHYS. , volume=
-
[56]
Deardorff, J. W. , title =. Journal of Geophysical Research (1896-1977) , volume =. doi:https://doi.org/10.1029/JC077i030p05900 , url =. https://agupubs.onlinelibrary.wiley.com/doi/pdf/10.1029/JC077i030p05900 , year =
-
[57]
Delchambre, L. , title =. Monthly Notices of the Royal Astronomical Society , volume =. 2014 , month =. doi:10.1093/mnras/stu2219 , url =
-
[58]
and Kittner, J
Demuzere, M. and Kittner, J. and Martilli, A. and Mills, G. and Moede, C. and Stewart, I. D. and van Vliet, J. and Bechtel, B. , TITLE =. Earth System Science Data , VOLUME =. 2022 , NUMBER =
2022
-
[59]
and Siebesma, A
De Rooy, Wim C. and Siebesma, A. Pier , title = ". Mon. Weather Rev. , volume =. 2008 , month =
2008
-
[60]
and Siebesma, A
De Rooy, Wim C. and Siebesma, A. PIER , title =. Q. J. R. Meteorol. Soc. , volume =
-
[61]
and Bechtold, Peter and Fröhlich, Kristina and Hohenegger, Cathy and Jonker, Harm and Mironov, Dmitrii and Pier Siebesma, A
De Rooy, Wim C. and Bechtold, Peter and Fröhlich, Kristina and Hohenegger, Cathy and Jonker, Harm and Mironov, Dmitrii and Pier Siebesma, A. and Teixeira, Joao and Yano, Jun-Ichi , title =. Q. J. R. Meteorol. Soc. , volume =
-
[62]
Devenish, B. J. and Rooney, G. G. and Thomson, D. J. , year=. Large-eddy simulation of a buoyant plume in uniform and stably stratified environments , volume=. J. Fluid Mech. , publisher=
-
[63]
Debugne, Antoine L. R. and Hunt, Gary R. , year=. A phenomenological model for fountain-top entrainment , volume=. J. Fluid Mech. , publisher=
-
[64]
Derbyshire, S. H. and Beau, I. and Bechtold, P. and Grandpeix, J.-Y. and Piriou, J.-M. and Redelsperger, J.-L. and Soares, P. M. M. , title =. Q. J. R. Meteorol. Soc. , volume =
-
[65]
Derbyshire, S. H. and Maidens, A. V. and Milton, S. F. and Stratton, R. A. and Willett, M. R. , title =. Q. J. R. Meteorol. Soc. , volume =
-
[66]
, title =
Dimotakis, Paul E. , title =. Annu. Rev. Fluid Mech. , volume =
-
[67]
Ding, S. S. and Placidi, M. and Carpentieri, M. and others , title =. Experiments in Fluids , volume =. 2023 , doi =
2023
-
[68]
On conditioned averages for intermittent turbulent flows , volume=
Dopazo, Céasar , year=. On conditioned averages for intermittent turbulent flows , volume=. Journal of Fluid Mechanics , publisher=
-
[69]
Local geometry of isoscalar surfaces , author =. Phys. Rev. E , volume =. 2007 , month =
2007
-
[70]
Andrew D. Elvidge and Ian A. Renfrew. The Causes of Foehn Warming in the Lee of Mountains. Bulletin of the American Meteorological Society. 2016. doi:10.1175/BAMS-D-14-00194.1
-
[71]
Everson and Katepalli Sreenivasan
R.M. Everson and Katepalli Sreenivasan. Accumulation rates of spiral-like structures in fluid flows. Proceedings of the Royal Society A: Mathematical, Physical and Engineering Sciences. 1992
1992
-
[72]
Fernando, H J S , title =. Annu. Rev. Fluid Mech. , volume =
-
[73]
Submaximal exchange between a convectively forced basin and a large reservoir , volume=. 1999 , pages=. doi:10.1017/S0022112098003437 , journal=
-
[74]
Convectively driven exchange flow in a stratified sill-enclosed basin. J. Fluid Mech. , year = 2000, month = sep, volume =. doi:10.1017/S0022112000001130 , adsurl =
-
[75]
Finnigan, John. Turbulence in Plant Canopies. Annual Review of Fluid Mechanics. 2000. doi:https://doi.org/10.1146/annurev.fluid.32.1.519
-
[76]
Atmospheric Research , volume =
Evolution of small cumulus clouds in. Atmospheric Research , volume =. 1999 , issn =. doi:https://doi.org/10.1016/S0169-8095(99)00024-1 , url =
-
[77]
Gaskin and M
S.J. Gaskin and M. Mckernan and F. Xue , title =. J. Hydraul. Res. , volume =. 2004 , publisher =
2004
-
[78]
Giometto, M. G. and A. Christen and C. Meneveau and Jiannong Fang and M. Krafczyk and Parlange, M. B. Spatial characteristics of roughness sublayer mean flow and turbulence over a realistic urban surface. Boundary-Layer Meteorology. 2016. doi:10.1007/s10546-016-0157-6
-
[79]
Gladstone, Charlotte and Woods, Andrew W. , year=. On buoyancy-driven natural ventilation of a room with a heated floor , volume=. doi:10.1017/S0022112001004876 , journal=
-
[80]
Grabowski, W. W. and Morrison, H. , TITLE =. Atmospheric Chemistry and Physics , VOLUME =. 2021 , NUMBER =
2021
discussion (0)
Sign in with ORCID, Apple, or X to comment. Anyone can read and Pith papers without signing in.