Vision-Language Work Zone Intelligence for Safety-Critical Speed Regulation of Mixed-Autonomy Vehicles in Dynamic Environments
Pith reviewed 2026-06-27 18:25 UTC · model grok-4.3
The pith
A real-time onboard vision pipeline detects work zones and recognizes temporary speed limits for vehicle safety.
A machine-rendered reading of the paper's core claim, the machinery that carries it, and where it could break.
Core claim
The central claim is that a fused detection and verification pipeline with hysteresis-based transitions can reliably identify inside-work-zone states at 96.5% recall and recognize speed limits at 95.45% precision on tested data, outputting usable speed values without relying on maps or infrastructure.
What carries the argument
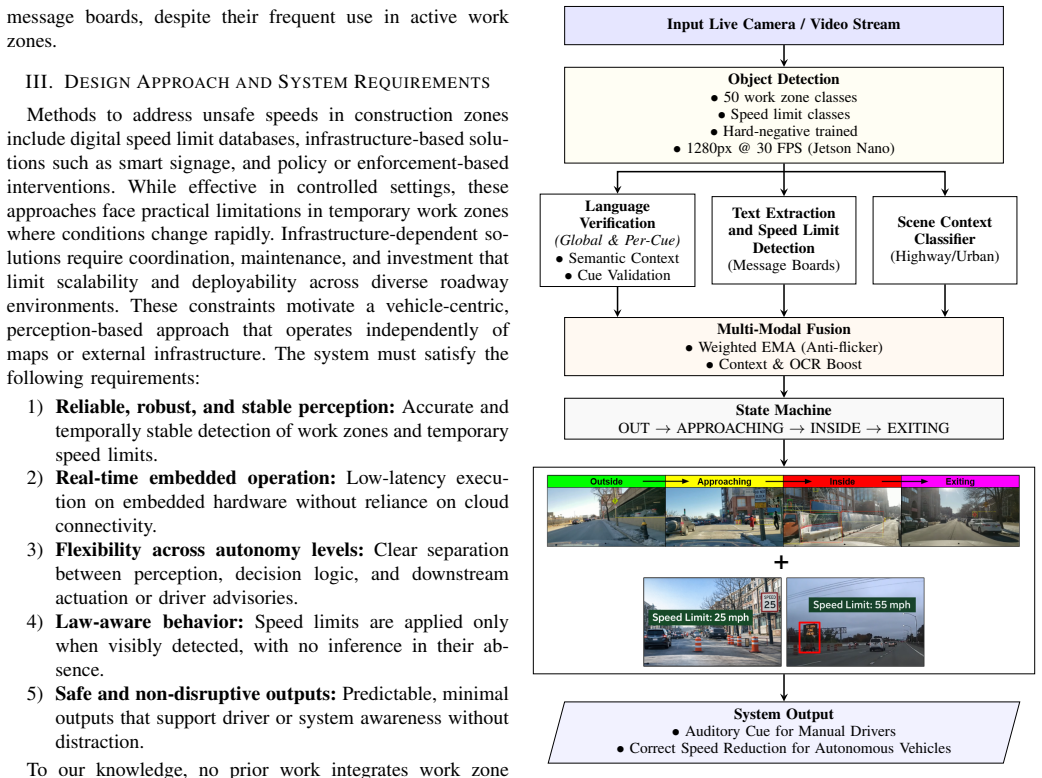
The real-time perception pipeline fusing object detections with semantic verification and hysteresis-based state transitions to produce law-aware work-zone states.
Load-bearing premise
The annotated ROADWork subset and in-house driving data sufficiently represent the variability in real-world work zones, lighting, and signage.
What would settle it
Testing on a dataset with significantly different work zone conditions or signage styles resulting in event-level recall below 80% or any incorrect speed classifications would challenge the reported performance.
Figures


read the original abstract
Temporary work-zone speed limits are communicated through visually inconsistent signage and are often missing from digital maps, creating safety risks for human drivers and automated vehicle systems. We present a real-time, onboard perception pipeline that detects active work zones, recognizes associated temporary speed limits, and outputs a law-aware work-zone state and speed value suitable for driver alerts or downstream automated control. The system fuses object detections with semantic verification and temporally smoothed, hysteresis-based state transitions to reduce false activations and flicker in dynamic scenes, and runs fully on low-cost embedded hardware. Evaluated manually on a annotated subset of the ROADWork dataset (490 sequences), the system achieves inside-work-zone event-level recall of 96.5% and event-level precision of 68.7%. Speed-limit recognition evaluated on 35 minutes of in-house driving data attains 95.45% precision and 53.85% recall, with no incorrect speed classifications and a single false positive. These results demonstrate a practical, scalable approach for grounding work-zone speed awareness directly in onboard perception rather than maps or infrastructure. We release our source code for the proposed system pipeline on our GitHub repository: https://github.com/Mi3-Lab/workzone
Editorial analysis
A structured set of objections, weighed in public.
Referee Report
Summary. The manuscript presents a real-time onboard vision-language perception pipeline for detecting active work zones and recognizing associated temporary speed limits in mixed-autonomy driving scenes. It fuses object detections with semantic verification and applies temporally smoothed, hysteresis-based state transitions to produce stable, law-aware outputs suitable for alerts or control, running on low-cost embedded hardware. Quantitative support consists of event-level metrics on a manually annotated ROADWork subset (490 sequences): 96.5% recall and 68.7% precision for inside-work-zone detection; and on 35 minutes of in-house data: 95.45% precision and 53.85% recall for speed-limit recognition (with no incorrect classifications and one false positive). Source code is released.
Significance. If the reported metrics prove reliable under broader conditions, the work supplies a practical, map-independent onboard method for grounding work-zone speed awareness, addressing a safety gap in dynamic environments. The explicit code release strengthens reproducibility and enables community validation or extension.
major comments (2)
- [Evaluation] Evaluation section: The manuscript provides no description of the annotation protocol, selection criteria, labeling guidelines, inter-annotator agreement, or exact computation of event-level metrics for either the 490 ROADWork sequences or the 35-minute in-house dataset. Without these details it is impossible to determine whether the test distributions adequately sample real-world variability in lighting, occlusion, sign types, or geographic conditions, directly undermining confidence in the headline recall/precision figures that constitute the sole quantitative support for the practical-pipeline claim.
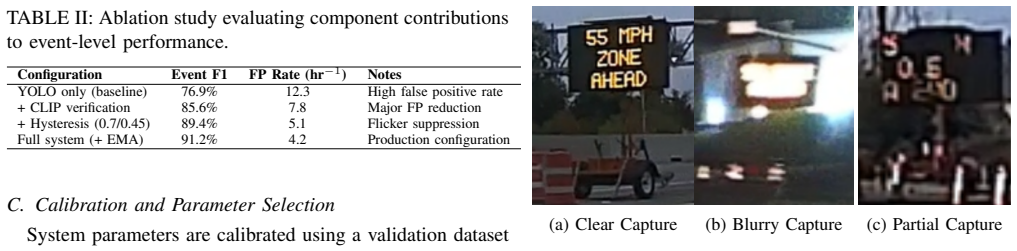
- [Results] Results and discussion: The reported precision of 68.7% for work-zone events and recall of 53.85% for speed-limit recognition are presented without accompanying failure-mode analysis, false-positive triggers, or ablation of the hysteresis/semantic-verification components. These numbers are load-bearing for the assertion of a deployable system yet receive insufficient scrutiny relative to the low-precision and low-recall outcomes.
minor comments (1)
- [Abstract] Abstract: 'a annotated subset' is grammatically incorrect and should read 'an annotated subset'.
Simulated Author's Rebuttal
We thank the referee for the constructive and detailed feedback. We address each major comment point by point below and will revise the manuscript to incorporate additional details and analysis where the comments identify gaps in the current version.
read point-by-point responses
-
Referee: [Evaluation] Evaluation section: The manuscript provides no description of the annotation protocol, selection criteria, labeling guidelines, inter-annotator agreement, or exact computation of event-level metrics for either the 490 ROADWork sequences or the 35-minute in-house dataset. Without these details it is impossible to determine whether the test distributions adequately sample real-world variability in lighting, occlusion, sign types, or geographic conditions, directly undermining confidence in the headline recall/precision figures that constitute the sole quantitative support for the practical-pipeline claim.
Authors: We agree that the current manuscript lacks sufficient detail on the annotation process. In the revised version we will add a new subsection under Evaluation that explicitly describes the annotation protocol for both datasets, including sequence selection criteria, labeling guidelines, how event-level metrics were computed (e.g., definition of an event and temporal alignment), and any inter-annotator agreement statistics that were recorded. This addition will allow readers to better assess the representativeness of the test distributions with respect to lighting, occlusion, and geographic variability. revision: yes
-
Referee: [Results] Results and discussion: The reported precision of 68.7% for work-zone events and recall of 53.85% for speed-limit recognition are presented without accompanying failure-mode analysis, false-positive triggers, or ablation of the hysteresis/semantic-verification components. These numbers are load-bearing for the assertion of a deployable system yet receive insufficient scrutiny relative to the low-precision and low-recall outcomes.
Authors: We acknowledge that the lower precision (68.7%) and recall (53.85%) figures require more supporting analysis to substantiate the practical-pipeline claim. While the work-zone recall of 96.5% and speed-limit precision of 95.45% (with zero incorrect classifications) are the primary operating points, we will expand the Results and Discussion section to include (1) a failure-mode analysis with representative examples of false positives, (2) discussion of the triggers for those errors, and (3) an ablation study isolating the contribution of the hysteresis smoothing and semantic-verification stages. These additions will provide the requested scrutiny. revision: yes
Circularity Check
No circularity: empirical metrics on held-out annotated data with no derivations or self-referential reductions.
full rationale
The paper describes a real-time perception pipeline evaluated via manual annotation on subsets of the ROADWork dataset (490 sequences) and 35 minutes of in-house data. Reported figures (96.5% recall / 68.7% precision; 95.45% precision / 53.85% recall) are direct empirical measurements. No equations, fitted parameters renamed as predictions, self-citations as load-bearing uniqueness theorems, or ansatzes appear in the provided text. The central claims rest on external data evaluation rather than any derivation chain that reduces to its own inputs by construction.
Axiom & Free-Parameter Ledger
Reference graph
Works this paper leans on
-
[1]
L. Torres. (2024, Mar.) Speeding makes work zones dangerous for everyone. National Safety Council. [Online]. Available: https: //www.nsc.org/road/safety-topics/speeding/speeding-makes-work-zones -dangerous-for-everyone
2024
-
[2]
(2023) 2023 fatality analysis reporting system (fars) annual report file (arf)
National Highway Traffic Safety Administration. (2023) 2023 fatality analysis reporting system (fars) annual report file (arf). U.S. Department of Transportation. Accessed via workzonesafety.org. [Online]. Available: https://workzonesafety.org/work-zone-data/
2023
-
[3]
(2025, Aug.) Work zone facts and statistics
Federal Highway Administration. (2025, Aug.) Work zone facts and statistics. U.S. Department of Transportation. [Online]. Available: https://ops.fhwa.dot.gov/wz/resources/facts stats.htm
2025
-
[4]
Drivers’ immediate responses to traffic signs,
H. Summala and J. Hietam ¨aki, “Drivers’ immediate responses to traffic signs,”Ergonomics, vol. 27, no. 2, pp. 205–216, 1984
1984
-
[5]
Speeding behavior while using adaptive cruise control and lane centering in free flow traffic,
S. S. Monfort, I. J. Reagan, J. B. Cicchino, W. Hu, P. Gershon, B. Mehler, and B. Reimer, “Speeding behavior while using adaptive cruise control and lane centering in free flow traffic,”Traffic Injury Prevention, vol. 23, no. 2, pp. 85–90, 2022
2022
-
[6]
User experi- ence of navigating work zones with automated vehicles: Insights from youtube on challenges and strengths,
M. Ansarinejad, K. Ansarinejad, P. Lu, and Y . Huang, “User experi- ence of navigating work zones with automated vehicles: Insights from youtube on challenges and strengths,”Smart Cities, vol. 8, no. 4, p. 120, 2025
2025
-
[7]
Market penetration of advanced driver assistance systems (adas),
Partnership for Analytics Research in Traffic Safety (PARTS), “Market penetration of advanced driver assistance systems (adas),” MITRE, Tech. Rep., Sep. 2024, september 2024 Report. [Online]. Available: https://www.mitre.org/sites/default/files/2024-09/PR-24-2614-PARTS -Market-Penetration-Advanced-Driver-Assistance-Systems-0917.pdf
2024
-
[8]
Work zone detection for autonomous vehicles,
W. Shi and R. R. Rajkumar, “Work zone detection for autonomous vehicles,” inProceedings of the IEEE International Intelligent Trans- portation Systems Conference (ITSC). IEEE, Sep. 2021, pp. 1585– 1591
2021
-
[9]
Detecting work zones in shrp 2 nds videos using deep learning-based computer vision,
F. Abodo, R. Rittmuller, B. Sumner, and A. Berthaume, “Detecting work zones in shrp 2 nds videos using deep learning-based computer vision,” inProceedings of the IEEE International Conference on Machine Learning and Applications (ICMLA). IEEE, Dec. 2018, pp. 679–686
2018
-
[10]
Roadwork: A dataset and benchmark for learning to recognize, observe, analyze, and drive through work zones,
A. Ghosh, S. Zheng, R. Tamburo, K. Vuong, J. Alvarez-Padilla, H. Zhu, and S. G. Narasimhan, “Roadwork: A dataset and benchmark for learning to recognize, observe, analyze, and drive through work zones,” inProceedings of the IEEE/CVF International Conference on Computer Vision (ICCV), 2025, pp. 6132–6142
2025
-
[11]
The mapillary traffic sign dataset for detection and classification on a global scale,
C. Ertler, J. Mislej, T. Ollmann, L. Porzi, G. Neuhold, and Y . Kuang, “The mapillary traffic sign dataset for detection and classification on a global scale,” inProceedings of the European Conference on Computer Vision (ECCV). Springer, Aug. 2020, pp. 68–84
2020
-
[12]
Vision for looking at traffic lights: Issues, survey, and perspectives,
M. B. Jensen, M. P. Philipsen, A. Møgelmose, T. B. Moeslund, and M. M. Trivedi, “Vision for looking at traffic lights: Issues, survey, and perspectives,”IEEE Transactions on Intelligent Transportation Systems, vol. 17, no. 7, pp. 1800–1815, 2016
2016
-
[13]
Traffic light detection: A learning algorithm and evalua- tions on a challenging dataset,
M. P. Philipsen, M. B. Jensen, A. Møgelmose, T. B. Moeslund, and M. M. Trivedi, “Traffic light detection: A learning algorithm and evalua- tions on a challenging dataset,” inProceedings of the IEEE International Intelligent Transportation Systems Conference (ITSC). IEEE, Sep. 2015, pp. 2341–2345
2015
-
[14]
Real-time recognition of U.S. speed signs,
C. G. Keller, C. Sprunk, C. Bahlmann, J. Giebel, and G. Baratoff, “Real-time recognition of U.S. speed signs,” inProceedings of the IEEE Intelligent Vehicles Symposium. IEEE, 2008, pp. 518–523
2008
-
[15]
Deep learning-based speed limit sign detection using YOLOv11 applied to speed regulation in electric vehicles for ADAS,
M. Chaman, A. El Maliki, H. Dahou, R. El Gouri, H. Laamari, and A. Hadjoudja, “Deep learning-based speed limit sign detection using YOLOv11 applied to speed regulation in electric vehicles for ADAS,” Engineering, Technology & Applied Science Research, vol. 15, no. 4, pp. 25 354–25 362, Aug. 2025
2025
-
[16]
Led flicker: Root cause, impact and measurement for automotive imaging applications,
B. Deegan, “Led flicker: Root cause, impact and measurement for automotive imaging applications,” inElectronic Imaging: Autonomous Vehicles and Machines. Society for Imaging Science and Technology, Jan. 2018, pp. 146–1–146–6
2018
-
[17]
Enhancing digital speed limit detection in work zones: A camera-based approach with multi-frame processing,
M. Zhu, A. Sidhu, and K. A. Redmill, “Enhancing digital speed limit detection in work zones: A camera-based approach with multi-frame processing,” inProceedings of the IEEE International Conference on Intelligent Transportation Systems (ITSC). IEEE, 2024, pp. 4013–4019
2024
-
[18]
You only look once: Unified, real-time object detection,
J. Redmon, S. Divvala, R. Girshick, and A. Farhadi, “You only look once: Unified, real-time object detection,” inProceedings of the IEEE Conference on Computer Vision and Pattern Recognition (CVPR). IEEE, 2016, pp. 779–788
2016
-
[19]
Learning transferable visual models from natural language supervision,
A. Radford, J. W. Kim, C. Hallacy, A. Ramesh, G. Goh, S. Agarwal, G. Sastry, A. Askell, P. Mishkin, J. Clarket al., “Learning transferable visual models from natural language supervision,” inProceedings of the International Conference on Machine Learning (ICML). PMLR, 2021, pp. 8748–8763
2021
-
[20]
R. Greer and M. Trivedi, “Towards explainable, safe autonomous driving with language embeddings for novelty identification and active learning: Framework and experimental analysis with real-world data sets,”arXiv preprint arXiv:2402.07320, 2024
-
[21]
Autonomous vehicles that alert humans to take-over controls: Modeling with real-world data,
A. Rangesh, N. Deo, R. Greer, P. Gunaratne, and M. M. Trivedi, “Autonomous vehicles that alert humans to take-over controls: Modeling with real-world data,” in2021 IEEE International Intelligent Transporta- tion Systems Conference (ITSC). IEEE, 2021, pp. 231–236
2021
-
[22]
Pedestrian behavior maps for safety advisories: Champ framework and real-world data analysis,
R. Greer, S. Desai, L. Rakla, A. Gopalkrishnan, A. Alofi, and M. Trivedi, “Pedestrian behavior maps for safety advisories: Champ framework and real-world data analysis,” in2023 IEEE Intelligent Vehicles Symposium (IV). IEEE, 2023, pp. 1–8
2023
-
[23]
F. Denk, P. Brunner, W. Huber, M. Margreiter, K. Bogenberger, and R. Kates, “Assessment of traffic safety interventions using virtual randomized controlled trials: potential of connected and automated driving including v2x for collision reduction at urban intersections,” in 2022 IEEE 25th International Conference on Intelligent Transportation Systems (ITS...
2022
discussion (0)
Sign in with ORCID, Apple, or X to comment. Anyone can read and Pith papers without signing in.