Intention Driven Identification of In-Possession Match Phases in Association Football through Temporal Graph Learning
Pith reviewed 2026-06-27 17:35 UTC · model grok-4.3
The pith
A temporal graph network turns football tracking data into labels for in-possession phases such as build-up and counter-attack.
A machine-rendered reading of the paper's core claim, the machinery that carries it, and where it could break.
Core claim
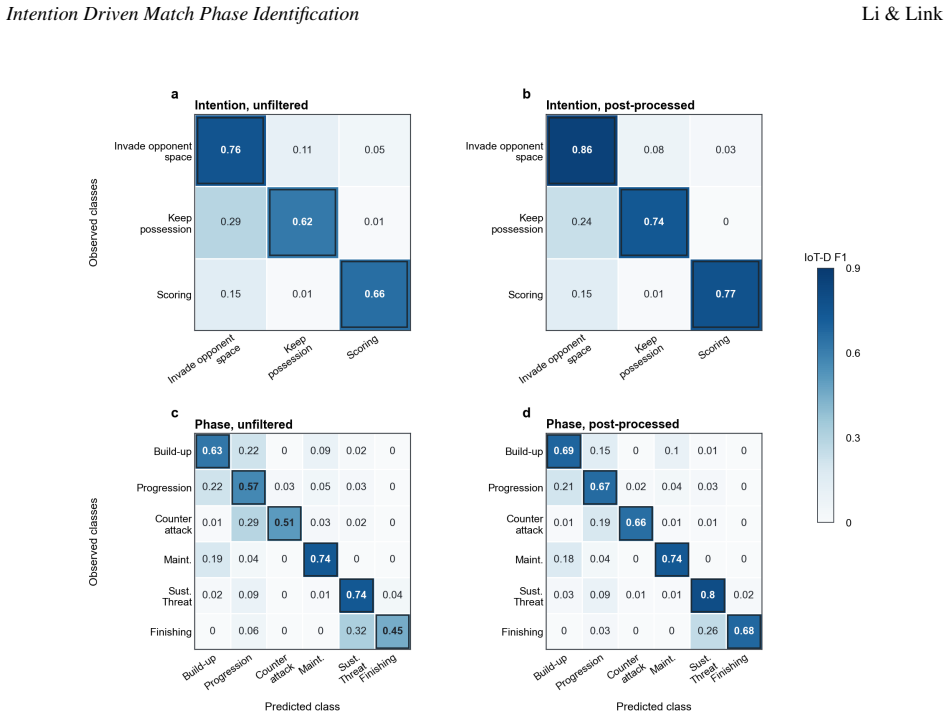
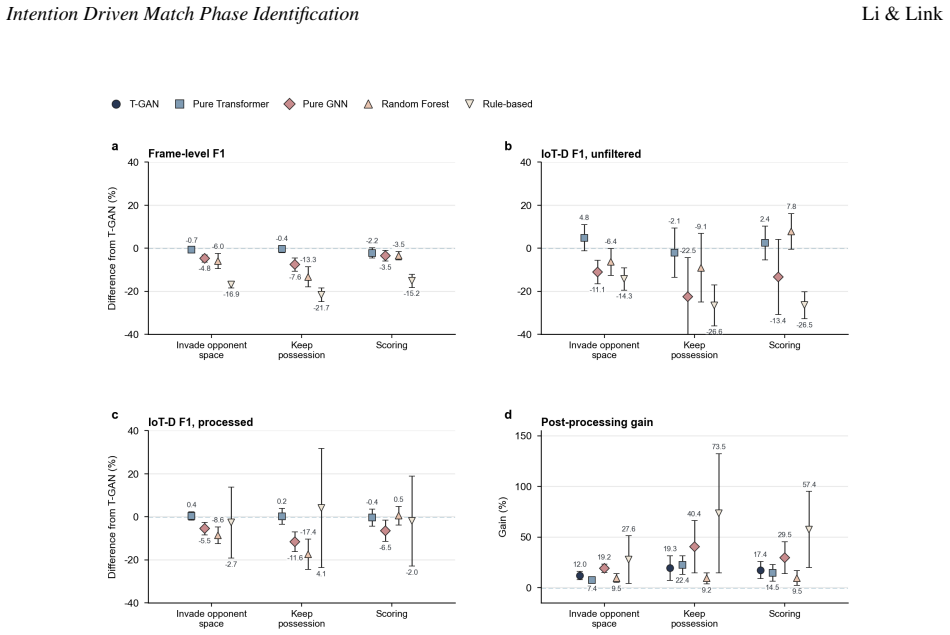
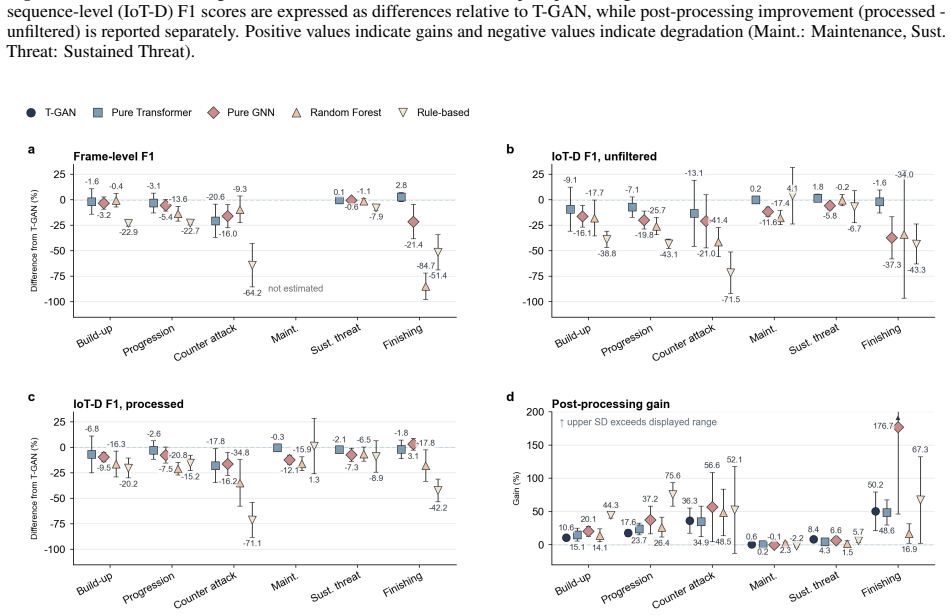
The T-GAN framework translates continuous tracking data into tactically interpretable in-possession phase representations, with macro-average frame-level F1 scores of 0.87 at the intention level, 0.76 for invasion-related phases, and 0.79 for scoring phases. Sequence-level coherence also rises after post-processing, and graph-based relational modelling helps especially with counter-attack recognition.
What carries the argument
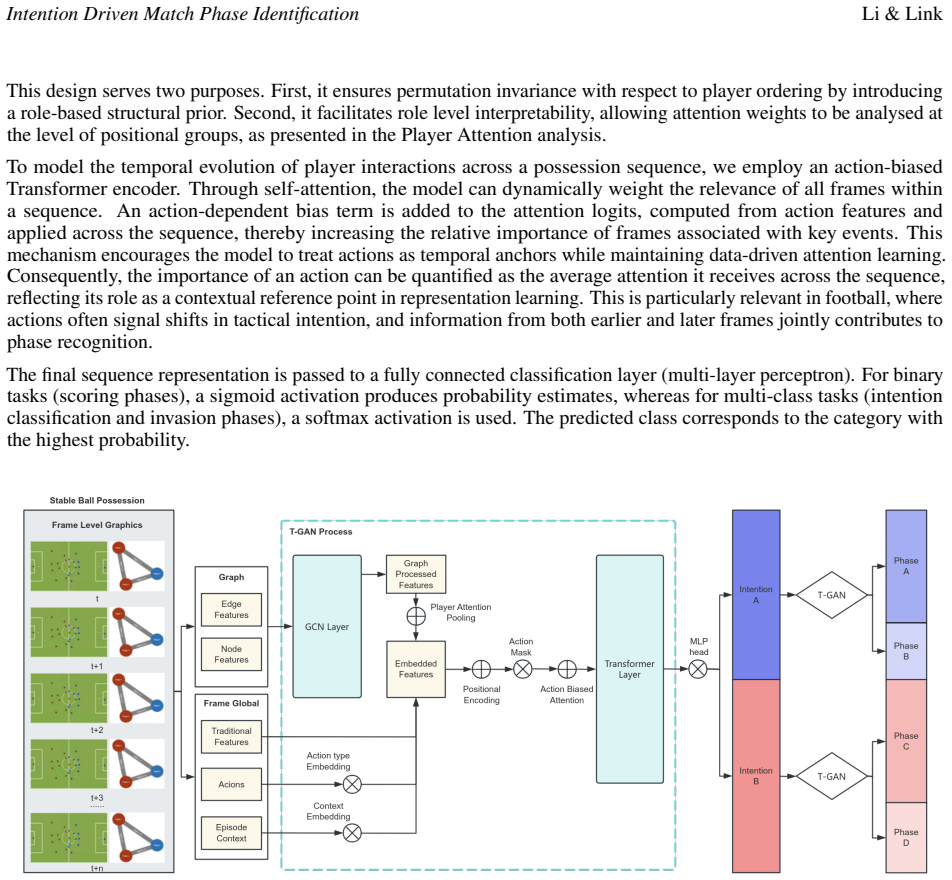
The Temporal Graph Attention Network (T-GAN), which builds frame-level player-interaction graphs, adds contextual features, and applies Transformer-based temporal modelling to predict phases.
If this is right
- Automated match annotation from raw tracking data becomes feasible at scale.
- Tactical analysis can rely on consistent phase labels across many matches without manual coding.
- Playing-style profiling can incorporate measured distributions and sequences of phases.
- Sequence modelling improves temporal coherence of the detected phases.
Where Pith is reading between the lines
- The same graph-plus-temporal structure could be tested on tracking data from other invasion sports.
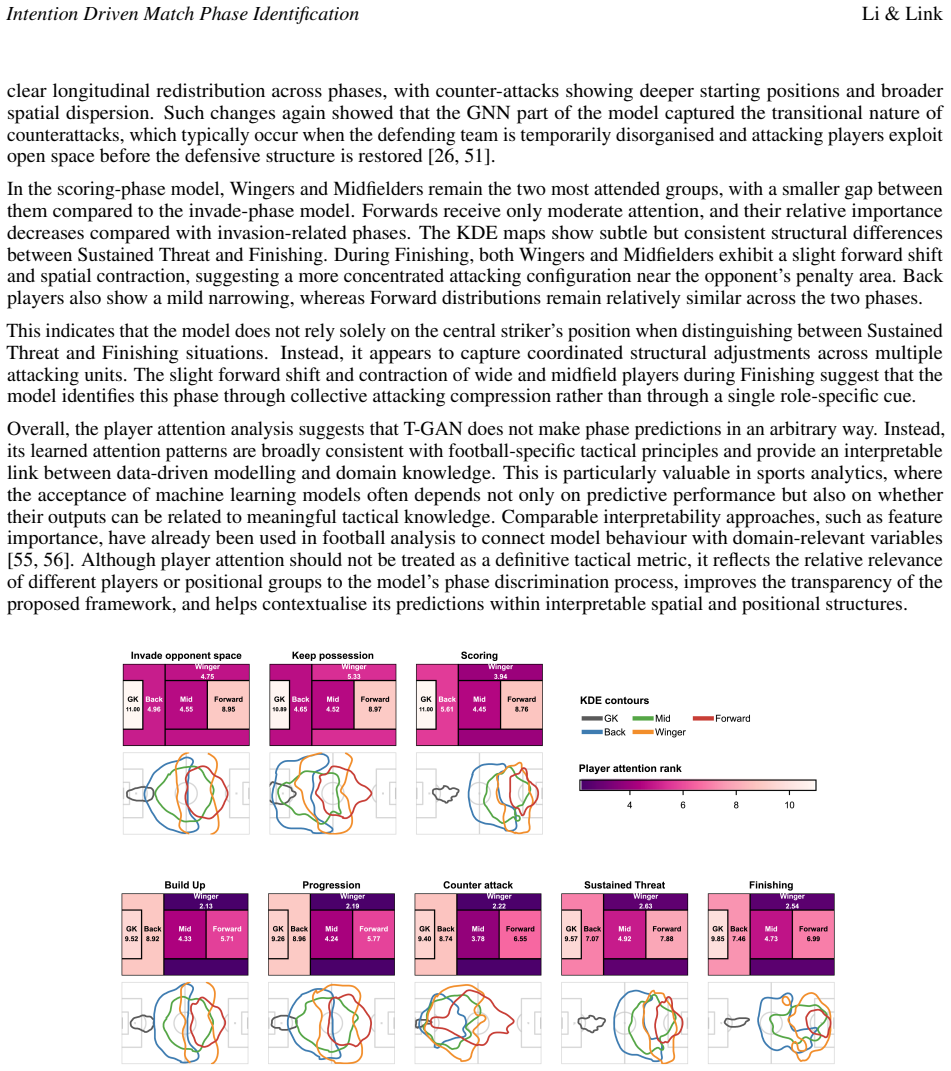
- Attention weights on player groups might be used to quantify which positions drive each phase transition.
- If the model runs in real time it could support in-game tactical adjustments.
Load-bearing premise
That the three predefined tactical intentions and six phases correctly describe the main ways teams organize play while they hold the ball.
What would settle it
Independent expert labeling of the same Bundesliga match frames that shows large disagreement with the model's assigned phases on a substantial fraction of frames.
Figures


read the original abstract
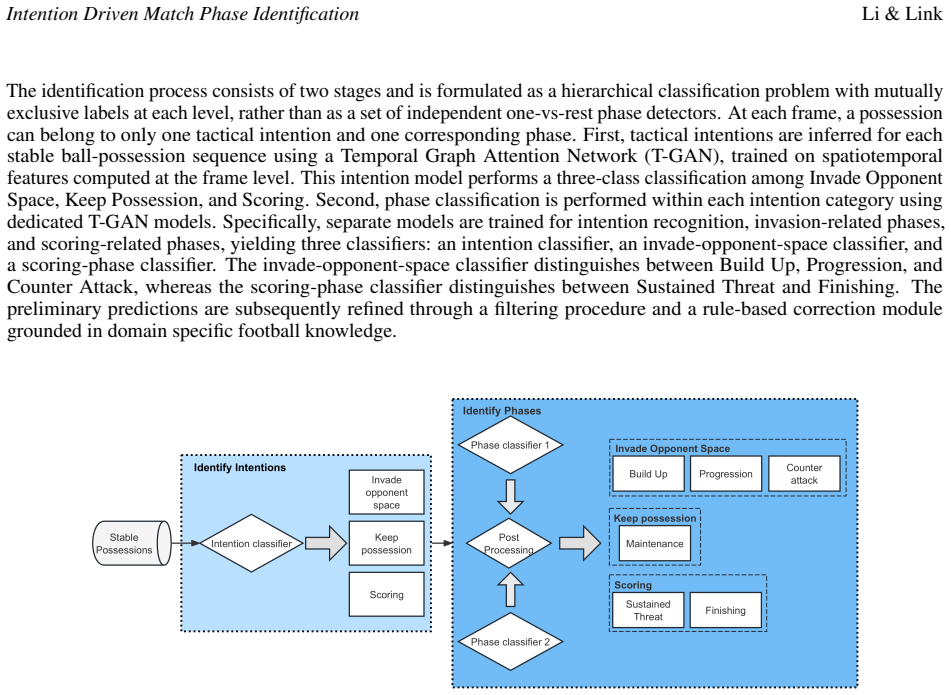
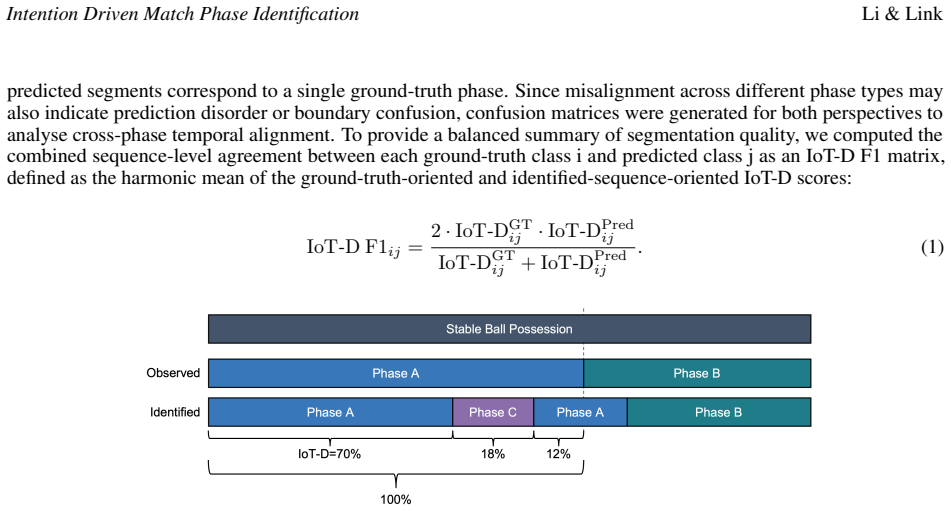
Understanding tactical organisation of association football, hereafter referred to as football, requires identifying distinct match phases. Yet in-possession phases are rarely directly observable and are shaped by evolving tactical intentions, rather than spatial patterns alone. This study proposes a data-driven framework for identifying in-possession match phases from spatiotemporal tracking data. Seven German Bundesliga matches recorded at 25 Hz with TRACAB were analysed. A hierarchical phase model was defined with three tactical intentions (Invade Opponent Space, Keep Possession, Scoring) and six phases (Build Up, Progression, Counter Attack, Maintenance, Sustained Threat, Finishing). A Temporal Graph Attention Network (T-GAN) was developed to combine frame-level player-interaction graphs, contextual features, and Transformer-based temporal modelling. Performance was evaluated using frame-level F1 and a sequence-aware Intersection over Truth-Dominance (IoT-D) metric. T-GAN achieved macro-average frame-level F1 scores of 0.87 at the intention level, 0.76 for invasion-related phases, and 0.79 for scoring phases. At the sequence level, mean diagonal IoT-D F1 increased from 0.68 to 0.79 for intentions and from 0.61 to 0.71 for phases after post-processing, indicating improved temporal coherence. Model comparisons showed that sequence modelling was the main driver of segmentation quality, while graph-based relational modelling was particularly beneficial for Counter Attack recognition. Exploratory player attention analysis further suggested that wide and midfield positional groups contributed strongly to phase discrimination. Overall, the framework translates continuous tracking data into tactically interpretable in-possession phase representations, with potential applications in automated match annotation, tactical analysis, and playing-style profiling.
Editorial analysis
A structured set of objections, weighed in public.
Referee Report
Summary. The manuscript proposes a Temporal Graph Attention Network (T-GAN) to identify in-possession match phases from 25 Hz TRACAB tracking data of seven German Bundesliga matches. It defines a predefined hierarchical model with three tactical intentions (Invade Opponent Space, Keep Possession, Scoring) and six phases (Build Up, Progression, Counter Attack, Maintenance, Sustained Threat, Finishing), trains on frame-level labels from this hierarchy, and reports macro-average F1 scores of 0.87 (intentions), 0.76 (invasion phases), and 0.79 (scoring phases), with post-processing improving sequence-level IoT-D F1 from 0.68 to 0.79 (intentions) and 0.61 to 0.71 (phases).
Significance. If the phase taxonomy proves reliable, the combination of graph-based relational modeling with Transformer temporal modeling could support automated tactical annotation and playing-style profiling. The work explicitly credits sequence modeling as the primary driver of segmentation quality and graph relations for Counter Attack recognition, providing a concrete basis for further development.
major comments (2)
- [Abstract] Abstract and hierarchical phase model definition: The three intentions and six phases are introduced as a predefined a-priori hierarchy with no reported inter-rater reliability, expert validation study, or comparison to alternative taxonomies. Since all reported F1 and IoT-D metrics are computed against labels generated from this fixed scheme, the scores demonstrate only reproduction of the chosen annotation rather than independent tactical fidelity. This directly undermines the central claim that the framework yields 'tactically interpretable' representations.
- [Abstract] Experimental evaluation (Abstract): No information is supplied on train/test splits, baseline models, hyperparameter selection, or class-imbalance handling. Without these details the macro F1 values (0.87/0.76/0.79) and the post-processing IoT-D gains cannot be assessed for robustness, making the performance claims unverifiable.
minor comments (1)
- [Abstract] The IoT-D metric is referenced but its precise formulation is not given; a short definition or citation in the abstract would improve immediate readability.
Simulated Author's Rebuttal
We thank the referee for the constructive comments, which highlight important aspects of model evaluation and taxonomy justification. We address each major comment below.
read point-by-point responses
-
Referee: [Abstract] Abstract and hierarchical phase model definition: The three intentions and six phases are introduced as a predefined a-priori hierarchy with no reported inter-rater reliability, expert validation study, or comparison to alternative taxonomies. Since all reported F1 and IoT-D metrics are computed against labels generated from this fixed scheme, the scores demonstrate only reproduction of the chosen annotation rather than independent tactical fidelity. This directly undermines the central claim that the framework yields 'tactically interpretable' representations.
Authors: The phase taxonomy is grounded in established football coaching literature and common tactical terminology (e.g., build-up vs. counter-attack distinctions). We agree that no inter-rater reliability study or comparison to alternative taxonomies is reported, which limits claims of broad validity. The reported metrics evaluate the model's ability to recover the expert-defined labels from tracking data via graph and temporal mechanisms; the 'tactically interpretable' claim is supported by the attention analysis showing alignment with positional roles and the explicit benefit of graph relations for counter-attack detection. We will add an explicit limitations paragraph discussing the a-priori nature of the taxonomy and the need for future expert validation studies. revision: partial
-
Referee: [Abstract] Experimental evaluation (Abstract): No information is supplied on train/test splits, baseline models, hyperparameter selection, or class-imbalance handling. Without these details the macro F1 values (0.87/0.76/0.79) and the post-processing IoT-D gains cannot be assessed for robustness, making the performance claims unverifiable.
Authors: The full manuscript's Methods and Experimental Setup sections detail the leave-one-match-out cross-validation across the seven matches, baseline ablations (non-graph and non-temporal variants), grid-search hyperparameter selection, and weighted cross-entropy loss for class imbalance. We will revise the abstract to include a concise statement of the evaluation protocol (e.g., 'evaluated via leave-one-match-out cross-validation with macro F1 and sequence-aware IoT-D metrics') to improve standalone readability. revision: yes
- No inter-rater reliability study or external expert validation of the phase taxonomy was conducted in the original work; such data cannot be retroactively supplied without new annotation effort.
Circularity Check
No significant circularity; derivation is self-contained supervised learning
full rationale
The paper defines a hierarchical phase taxonomy a priori, annotates data accordingly, and trains/evaluates a T-GAN classifier using standard frame-level F1 and sequence IoT-D metrics on held-out matches. No equations, fitted parameters, or self-citations reduce the reported performance numbers to the inputs by construction; the central results are external to the model itself. The validity of the chosen taxonomy is an assumption about tactical organization rather than a circular step in the derivation chain.
Axiom & Free-Parameter Ledger
free parameters (1)
- T-GAN hyperparameters and training settings
axioms (1)
- domain assumption The three tactical intentions and six phases form a valid and exhaustive categorization of in-possession play.
Reference graph
Works this paper leans on
-
[1]
Rudenko, A., Palmieri, L., Herman, M., Kitani, K. M., Gavrila, D. M., and Arras, K. O. (2020). Human motion trajectory prediction: a survey.The International Journal of Robotics Research, 39(8):895–935. doi: 10.1177/0278364920917446
-
[2]
Sharma, N., Dhiman, C., and Indu, S. (2022). Pedestrian intention prediction for autonomous vehicles: A comprehensive survey.Neurocomputing, 508:120–152. doi: https://doi.org/10.1016/j.neucom.2022.07.085
-
[3]
Wiliem, A., Madasu, V ., Boles, W., and Yarlagadda, P. (2012). A suspicious behaviour detection using a context space model for smart surveillance systems.Computer Vision and Image Understanding, 116(2):194–209. doi: https://doi.org/10.1016/j.cviu.2011.10.001
-
[4]
Samaila, Y . A., Sebastian, P., Singh, N. S. S., Shuaibu, A. N., Ali, S. S. A., Amosa, T. I., Mustafa Abro, G. E., and Shuaibu, I. (2024). Video anomaly detection: A systematic review of issues and prospects.Neurocomputing, 591: 127726. doi: https://doi.org/10.1016/j.neucom.2024.127726
-
[5]
Li, T., Chang, H., Wang, M., Ni, B., Hong, R., and Yan, S. (2015). Crowded scene analysis: A survey.IEEE Transactions on Circuits and Systems for Video Technology, 25(3):367–386. doi: 10.1109/TCSVT.2014.2358029
-
[6]
Huang, T., Han, Q., Min, W., Li, X., Yu, Y ., and Zhang, Y . (2019). Loitering detection based on pedestrian activity area classification.Applied Sciences, 9(9):1866. doi: 10.3390/app9091866
-
[7]
Helbing, D. and Molnár, P. (1995). Social force model for pedestrian dynamics.Physical Review E, 51(5): 4282–4286. doi: 10.1103/PhysRevE.51.4282
-
[8]
Alahi, A., Goel, K., Ramanathan, V ., Robicquet, A., Fei-Fei, L., and Savarese, S. (2016). Social lstm: Human trajectory prediction in crowded spaces. In2016 IEEE Conference on Computer Vision and Pattern Recognition (CVPR), pages 961–971. ISBN 1063-6919. doi: 10.1109/CVPR.2016.110
-
[9]
Zhang, P., Ouyang, W., Zhang, P., Xue, J., and Zheng, N. (2019). Sr-lstm: State refinement for lstm towards pedestrian trajectory prediction. In2019 IEEE/CVF Conference on Computer Vision and Pattern Recognition (CVPR), pages 12077–12086. ISBN 2575-7075. doi: 10.1109/CVPR.2019.01236
-
[10]
Zheng, Y . (2015). Trajectory data mining: An overview.ACM Trans. Intell. Syst. Technol., 6(3):Article 29. doi: 10.1145/2743025
-
[11]
Gudmundsson, J. and Horton, M. (2017). Spatio-temporal analysis of team sports.Acm Computing Surveys, 50 (2):1–34. doi: 10.1145/3054132
-
[12]
Keogh, E., Lin, J., and Truppel, W. (2003). Clustering of time series subsequences is meaningless: implications for previous and future research. InThird IEEE International Conference on Data Mining, pages 115–122. doi: 10.1109/ICDM.2003.1250910
-
[13]
Linke, D., Link, D., and Lames, M. (2020). Football-specific validity of tracab’s optical video tracking systems. PLOS ONE, 15(3):e0230179. doi: 10.1371/journal.pone.0230179
-
[14]
Pappalardo, L., Cintia, P., Rossi, A., Massucco, E., Ferragina, P., Pedreschi, D., and Giannotti, F. (2019). A public data set of spatio-temporal match events in soccer competitions.Sci Data, 6(1):236. doi: 10.1038/ s41597-019-0247-7
2019
-
[15]
Link, D. (2018).Data Analytics in Professional Soccer: Performance Analysis Based on Spatiotemporal Tracking Data. Springer. ISBN 3658211776. doi: 10.1007/978-3-658-21177-6
-
[16]
Link, D. and Hoernig, M. (2017). Individual ball possession in soccer.PLOS ONE, 12(7):e0179953. doi: 10.1371/journal.pone.0179953
-
[17]
and Lang, S
Link, D. and Lang, S. (2019).How to Find Elementary Football Structures in Positional Data, pages 50–65. FC Barcelona
2019
-
[18]
(1967).The F .A
Wade, A. (1967).The F .A. Guide to Training and Coaching. Heinemann, London. ISBN 9780434835508
1967
-
[19]
Stats-Perform. (2019). Phases of play – an introduction. URL https://www.statsperform.com/resource/ phases-of-play-an-introduction/. 2023, Apr 24
2019
-
[20]
Sci-Sports. (2021). New game phases and insights bring performance analysis to life. URL https:// www.scisports.com/added-game-phases-and-insights-bring-performance-analysis-to-life/ . 2023, Apr 24
2021
-
[21]
FIFA. (2022). Phases of play. URL https://www.fifatrainingcentre.com/en/fwc2022/efi-metrics/ efi-metric--phases-of-play.php. 2023, Apr 24
2022
-
[22]
Hewitt, A., Greenham, G., and Norton, K. (2016). Game style in soccer: what is it and can we quantify it? International Journal of Performance Analysis in Sport, 16(1):355–372. doi: 10.1080/24748668.2016.11868892. 21arXiv Preprint Intention Driven Match Phase IdentificationLi & Link
-
[23]
Gregory, S., Robertson, S., Aughey, R., and Duthie, G. (2022). The influence of tactical and match context on player movement in football.Journal of Sports Sciences, 40(9):1063–1077. doi: 10.1080/02640414.2022.2046938
-
[24]
(2005).Handbook of Soccer Match Analysis: A Systematic Approach to Improving Performance
Carling, C., Williams, A., and Reilly, T. (2005).Handbook of Soccer Match Analysis: A Systematic Approach to Improving Performance. Routledge, London, 1st edition. doi: https://doi.org/10.4324/9780203448625
-
[25]
Zhang, G., Kempe, M., McRobert, A., Folgado, H., and Olthof, S. B. H. (2025). Navigating team tactical analysis in football: An analytical pipeline leveraging player tracking technology.Proceedings of the Institution of Mechanical Engineers, Part P: Journal of Sports Engineering and Technology, 0(0):17543371251392456. doi: 10.1177/17543371251392456
-
[26]
Tenga, A., Kanstad, D., Ronglan, L. T., and Bahr, R. (2009). Developing a new method for team match performance analysis in professional soccer and testing its reliability.International Journal of Performance Analysis in Sport, 9(1):8–25. doi: 10.1080/24748668.2009.11868461
-
[27]
Bauer, P., Anzer, G., and Shaw, L. (2023). Putting team formations in association football into context.Journal of Sports Analytics, 9:39–59. doi: 10.3233/JSA-220620
-
[28]
and Sotudeh, H
Ghezzi, E. and Sotudeh, H. (2024). Match phases in practice. InStatsBomb 2024 Conference, Manchester, UK
2024
-
[29]
Biermann, H., Memmert, D., Petersen, N., and Raabe, D. (2025). Contextualization of soccer analysis with tactical periodization and machine learning.Data Mining and Knowledge Discovery, 39(3):23. doi: 10.1007/ s10618-025-01092-9
2025
-
[30]
Fernandez-Navarro, J., Fradua, L., Zubillaga, A., and McRobert, A. P. (2018). Influence of contextual variables on styles of play in soccer.International Journal of Performance Analysis in Sport, 18(3):423–436. doi: 10.1080/24748668.2018.1479925
-
[31]
J., Teoldo da Costa, I., Manuel, J., Silva, G., Greco, P., and Mesquita, I
Costa, I., Greco, P. J., Teoldo da Costa, I., Manuel, J., Silva, G., Greco, P., and Mesquita, I. (2009). Tactical principles of soccer: concepts and application tactical principles of soccer.Motriz. Revista de Educação Física, 15:657–668. doi: 10.5016/2488
-
[32]
Campos, J. C. (2021). Determining the phases of play using graph neural network embeddings. InStatsbomb Conforence 2021, London, UK
2021
-
[33]
Yang, J., Ge, H., and Cui, Y . (2025). An ai framework for counterattack detection and decision-making evaluation in football.Journal of Big Data, 12(1):91. doi: 10.1186/s40537-025-01128-3
-
[34]
Rothe, F., Van Roy, M., Pinheiro, G., Davis, J., and Lames, M. (2026). Automatic detection of tactical states in football based on player and ball position.Journal of Sports Analytics, 12:22150218261432789. doi: 10.1177/22150218261432789
-
[35]
Bassek, M., Raabe, D., Banning, A., and Memmert, D. (2023). Automatic segmentation and contextualization of elite handball matches with machine learning. In Baca, A. and Exel, J., editors,13th World Congress of Performance Analysis of Sport and 13th International Symposium on Computer Science in Sport, pages 103–107. Springer Nature Switzerland. ISBN 978-...
-
[36]
Raabe, D., Nabben, R., and Memmert, D. (2022). Graph representations for the analysis of multi-agent spatiotemporal sports data.Applied Intelligence. doi: 10.1007/s10489-022-03631-z
-
[37]
Dick, U., Link, D., and Brefeld, U. (2022). Who can receive the pass? a computational model for quantifying avail- ability in soccer.Data Mining and Knowledge Discovery, 36(3):987–1014. doi: 10.1007/s10618-022-00827-2
-
[38]
Wang, Z., Veliˇckovi´c, P., Hennes, D., Tomašev, N., Prince, L., Kaisers, M., Bachrach, Y ., Elie, R., Wenliang, L. K., Piccinini, F., Spearman, W., Graham, I., Connor, J., Yang, Y ., Recasens, A., Khan, M., Beauguerlange, N., Sprechmann, P., Moreno, P., Heess, N., Bowling, M., Hassabis, D., and Tuyls, K. (2024). Tacticai: an ai assistant for football tac...
-
[39]
Lee, J., Park, E., and del Pobil, A. P. (2025). We know who wins: graph-oriented approaches of passing networks for predictive football match outcomes.Journal of Big Data, 12(1):147. doi: 10.1186/s40537-025-01203-9
-
[40]
N., Kaiser, Ł., and Polosukhin, I
Vaswani, A., Shazeer, N., Parmar, N., Uszkoreit, J., Jones, L., Gomez, A. N., Kaiser, Ł., and Polosukhin, I. (2017). Attention is all you need. In Guyon, I., Luxburg, U. V ., Bengio, S., Wallach, H., Fergus, R., Vishwanathan, S., and Garnett, R., editors,Proceedings of the 31st International Conference on Neural Information Processing Systems, volume 30, ...
2017
-
[41]
Wang, L., Xu, S., Horton, M., Gudmundsson, J., and Wang, Z. (2025). Player-team heterogeneous interaction graph transformer for soccer outcome prediction. InProceedings of the 31st ACM SIGKDD Conference on Knowledge Discovery and Data Mining V .2, Toronto ON, Canada. 22arXiv Preprint Intention Driven Match Phase IdentificationLi & Link
2025
-
[42]
J., Locke, D., and Norman, T
Simpson, I., Beal, R. J., Locke, D., and Norman, T. J. (2022). Seq2event: Learning the language of soccer using transformer-based match event prediction. InProceedings of the 28th ACM SIGKDD Conference on Knowledge Discovery and Data Mining, Washington DC, USA
2022
-
[43]
Wang, X., Tang, Z., Shao, J., Robertson, S., Gómez, M.-Á., and Zhang, S. (2024). Hooptransformer: Advancing nba offensive play recognition with self-supervised learning from player trajectories.Sports Medicine, 54(10): 2663–2673. doi: 10.1007/s40279-024-02030-3
-
[44]
Rovshitz, A. and Puzis, R. (2025). Transformer-based framework for versatile analysis of events data in soccer. In Brefeld, U., Davis, J., Van Haaren, J., and Zimmermann, A., editors,Machine Learning and Data Mining for Sports Analytics, pages 80–92. Springer Nature Switzerland. ISBN 978-3-031-86692-0. doi: https: //doi.org/10.1007/978-3-031-86692-0_7
-
[45]
Silla, C. N. and Freitas, A. A. (2011). A survey of hierarchical classification across different application domains. Data Mining and Knowledge Discovery, 22(1):31–72. doi: 10.1007/s10618-010-0175-9
-
[46]
Lang, S., Wild, R., Isenko, A., and Link, D. (2022). Predicting the in-game status in soccer with machine learning using spatiotemporal player tracking data.Scientific Reports, 12(1):16291. doi: 10.1038/s41598-022-19948-1
-
[47]
Hammes, F. and Link, D. (2024). Badminton as a dynamic system – a new method for analyzing badminton matches based on perturbations.Journal of Sports Sciences, 42(2):160–168. doi: 10.1080/02640414.2024. 2323327
-
[48]
Bialkowski, A., Lucey, P., Carr, P., Yue, Y ., Sridharan, S., and Matthews, I. (2014). Large-scale analysis of soccer matches using spatiotemporal tracking data. In2014 IEEE International Conference on Data Mining, pages 725–730. IEEE. ISBN 1479943029. doi: 10.1109/ICDM.2014.133
-
[49]
E., Maio, E., Afonso, P., Encarnação, S., Machado, G
Teixeira, J. E., Maio, E., Afonso, P., Encarnação, S., Machado, G. F., Morgans, R., Barbosa, T. M., Monteiro, A. M., Forte, P., Ferraz, R., and Branquinho, L. (2025). Mapping football tactical behavior and collective dynamics with artificial intelligence: a systematic review.Front Sports Act Living, 7:1569155. doi: 10.3389/fspor.2025.1569155
-
[50]
Yeung, C., Ide, K., Someya, T., and Fujii, K. (2025). Openstarlab: open approach for spatio-temporal agent data analysis in soccer.Complex & Intelligent Systems, 11(8):342. doi: 10.1007/s40747-025-01965-y
-
[51]
d., Visscher, C., and Lemmink, K
Frencken, W., Poel, H. d., Visscher, C., and Lemmink, K. (2012). Variability of inter-team distances associated with match events in elite-standard soccer.Journal of Sports Sciences, 30(12):1207–1213. doi: 10.1080/02640414. 2012.703783
-
[52]
Anzer, G., Bauer, P., Brefeld, U., and Faßmeyer, D. (2022). Detection of tactical patterns using semi-supervised graph neural networks. InMIT Sloan Sports Analytics Conference, 2022, Boston, USA
2022
-
[53]
Folgado, H., Lemmink, K. A. P. M., Frencken, W., and Sampaio, J. (2014). Length, width and centroid distance as measures of teams tactical performance in youth football.European Journal of Sport Science, 14(sup1): S487–S492. doi: 10.1080/17461391.2012.730060
-
[54]
Rein, R. and Memmert, D. (2016). Big data and tactical analysis in elite soccer: future challenges and opportunities for sports science.Springerplus, 5(1):1410. doi: 10.1186/s40064-016-3108-2
-
[55]
Pappalardo, L., Cintia, P., Ferragina, P., Massucco, E., Pedreschi, D., and Giannotti, F. (2019). Playerank: Data- driven performance evaluation and player ranking in soccer via a machine learning approach.Acm Transactions on Intelligent Systems and Technology, 10(5):1–27. doi: 10.1145/3343172
-
[56]
Li, Y ., Ma, R., Gonçalves, B., Gong, B., Cui, Y ., and Shen, Y . (2020). Data-driven team ranking and match performance analysis in chinese football super league.Chaos, Solitons & Fractals, 141:110330. doi: 10.1016/j. chaos.2020.110330
work page doi:10.1016/j 2020
-
[57]
Whoscored. (2020). Match report germany bundesliga 2019-2020 bayern munich- paderborn. URL https://www.whoscored.com/matches/1388293/matchreport/ germany-bundesliga-2019-2020-bayern-munich-paderborn. 2026, Mar 10. 23arXiv Preprint Intention Driven Match Phase IdentificationLi & Link Appendix Full Feature Set Table A1:Input features used in the T-GAN model...
arXiv 2020
discussion (0)
Sign in with ORCID, Apple, or X to comment. Anyone can read and Pith papers without signing in.