Imprints of the Neutral Interstellar Medium on Polarized Synchrotron Emission and Faraday Rotation
Pith reviewed 2026-06-27 12:13 UTC · model grok-4.3
The pith
Neutral gas regions in the ISM directly contribute to diffuse synchrotron emission and Faraday rotation.
A machine-rendered reading of the paper's core claim, the machinery that carries it, and where it could break.
Core claim
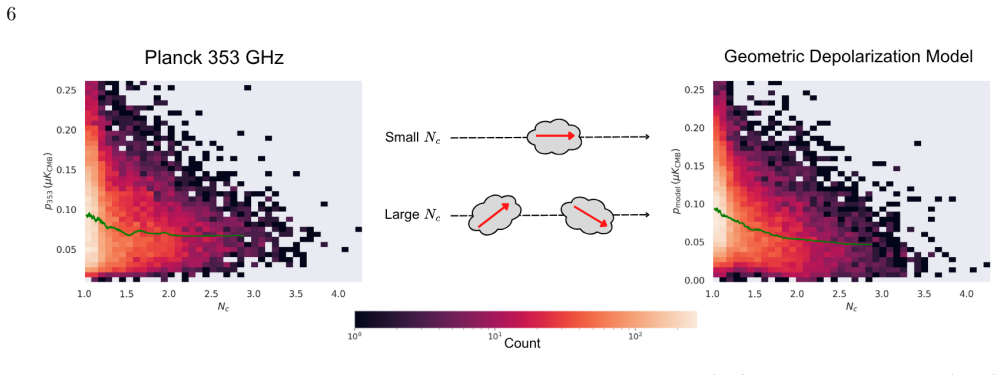
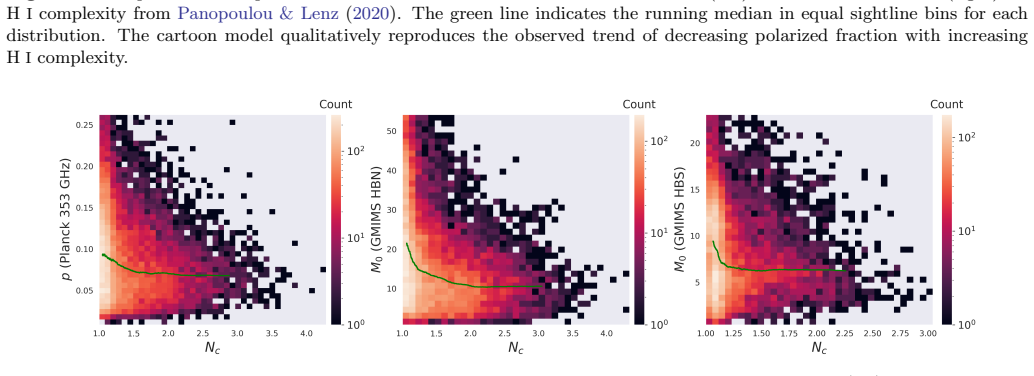
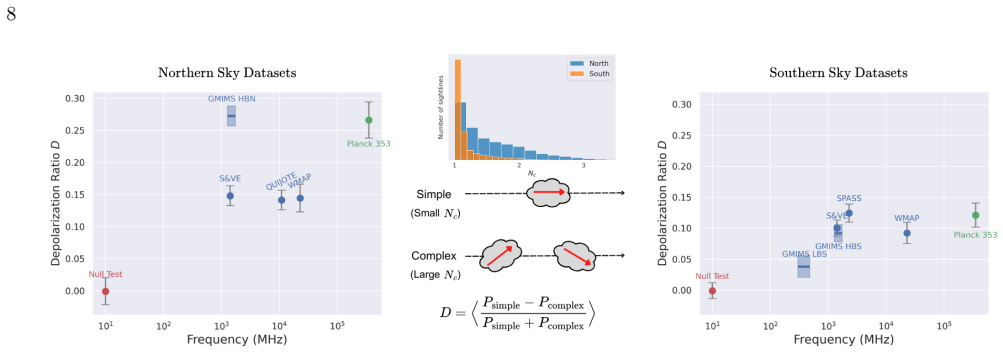
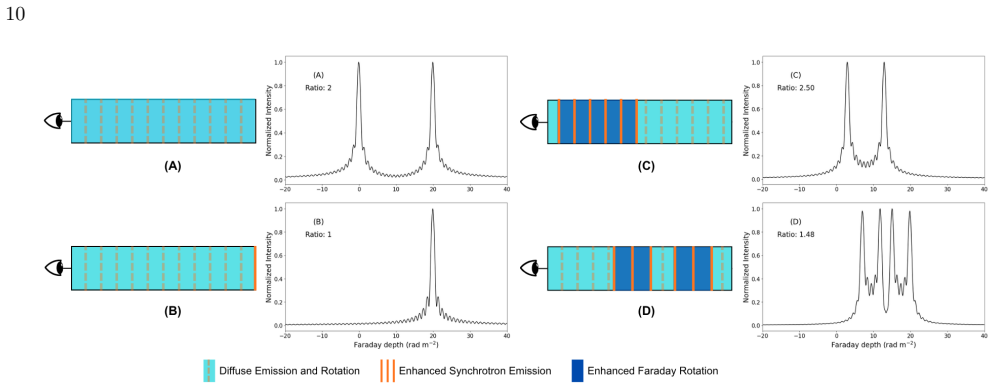
Through analysis of polarized synchrotron emission from roughly 300 MHz to 23 GHz and comparison with HI complexity measures, the authors find enhanced depolarization in lines of sight with multiple HI velocity components and direct links between Faraday depth moments and neutral gas structure, indicating that regions dominated by neutral gas can directly contribute a significant portion of the diffuse synchrotron emission and Faraday rotation.
What carries the argument
HI structure complexity measures along the line of sight together with the first and second moments of Faraday depth spectra, used to establish correlations with depolarization and neutral gas features.
If this is right
- Galactic magnetic field models must now incorporate contributions from neutral gas phases when synthesizing multiphase tracers.
- Faraday tomography interpretations require accounting for neutral ISM effects to recover accurate 3D structures.
- The diffuse synchrotron sky includes substantial emission originating from neutral-dominated regions.
- New observational constraints apply to how magnetic fields interact with different gas phases across radio frequencies.
Where Pith is reading between the lines
- If neutral gas contributes directly, prior attributions of Faraday rotation solely to ionized gas may need partial revision.
- Extending the same HI-Faraday comparison to lower latitudes could test whether the neutral-gas imprint persists in denser environments.
- Simulations of multiphase ISM with explicit neutral-gas synchrotron and rotation contributions could be compared against these observations to isolate the mechanism.
Load-bearing premise
The correlations between HI complexity, depolarization, and Faraday depth moments reflect a direct physical contribution from neutral gas rather than indirect effects from magnetic field geometry or ionized gas properties.
What would settle it
A dataset or simulation in which neutral gas is isolated from ionized gas yet shows no corresponding change in depolarization or Faraday depth moments would falsify the direct-contribution claim.
Figures


read the original abstract
The interstellar medium (ISM) is a complex, multiphase medium, where disentangling the distribution of gas and magnetic field structure across different phases remains a considerable challenge. Recently, Faraday tomography enabled by broadband polarized radio observations has emerged as a promising probe of 3D ISM gas and magnetic field structures. However, the interpretation of these observations is obscured by our limited understanding of the different ISM components probed by the distinct Faraday depth features. In this work, we present a comprehensive multi-frequency ($\sim$300 MHz - 23 GHz) analysis comparing features in the Faraday-rotated, polarized synchrotron emission and HI structures over the full high-latitude (|b|>30 degrees) diffuse sky. Using measures of HI structure complexity along the line of sight (LOS), we observe enhanced depolarization across synchrotron radio frequencies in regions with high HI complexity characterized by multiple HI velocity components. We also find that the first and second moments of the Faraday depth spectra are linked to the underlying neutral gas structure. These results indicate that regions of the ISM that are dominated by neutral gas could directly contribute a significant portion of the diffuse synchrotron emission and Faraday rotation. These findings establish new observational constraints for Galactic magnetic field models that synthesize multiphase tracers into a single coherent picture.
Editorial analysis
A structured set of objections, weighed in public.
Referee Report
Summary. The paper performs a multi-frequency (~300 MHz–23 GHz) analysis of polarized synchrotron emission over the high-latitude (|b|>30°) diffuse sky and compares it to HI structure complexity measures. It reports enhanced depolarization at synchrotron frequencies in sightlines with high HI complexity (multiple velocity components) and correlations between the first and second moments of Faraday depth spectra and neutral-gas structure, concluding that neutral-dominated ISM regions could directly contribute a significant fraction of the diffuse synchrotron emissivity and Faraday rotation.
Significance. If the reported correlations reflect a direct physical contribution from neutral gas rather than indirect covariance, the results would supply useful observational constraints for Galactic magnetic-field models that incorporate multiphase ISM tracers. The work demonstrates the utility of broadband Faraday tomography for linking 3D gas and magnetic-field structures across phases.
major comments (1)
- [Abstract and Discussion] The central claim that neutral-gas-dominated regions directly contribute to synchrotron emission and Faraday rotation rests on the observed correlations between HI complexity and depolarization/Faraday moments. However, the manuscript provides no quantitative discriminator (e.g., partial-correlation analysis controlling for Hα or dust tracers, or explicit modeling of magnetic-field geometry as a common driver) to rule out indirect covariance. This leaves the inference from correlation to direct contribution under-constrained (see Abstract and Discussion).
minor comments (1)
- [Abstract and Methods] The abstract and methods sections should include explicit statements on statistical controls, error propagation, and exclusion criteria used for the reported correlations to allow independent verification.
Simulated Author's Rebuttal
We thank the referee for their constructive review. We respond to the single major comment below, acknowledging where the manuscript can be strengthened while defending the correlative evidence presented.
read point-by-point responses
-
Referee: [Abstract and Discussion] The central claim that neutral-gas-dominated regions directly contribute to synchrotron emission and Faraday rotation rests on the observed correlations between HI complexity and depolarization/Faraday moments. However, the manuscript provides no quantitative discriminator (e.g., partial-correlation analysis controlling for Hα or dust tracers, or explicit modeling of magnetic-field geometry as a common driver) to rule out indirect covariance. This leaves the inference from correlation to direct contribution under-constrained (see Abstract and Discussion).
Authors: The referee is correct that the manuscript does not perform partial-correlation analyses or explicit modeling to isolate direct contributions from possible indirect covariance with other tracers. The reported correlations are specifically with HI velocity-component complexity rather than generic column-density or dust measures, which we argue provides targeted support for a neutral-phase link, but this does not fully exclude common drivers such as magnetic-field geometry. The abstract and discussion employ cautious language (“could directly contribute” and “indicate”) precisely to reflect the correlative basis. In revision we will expand the Discussion to explicitly note the possibility of indirect covariance and to state that partial-correlation tests with Hα or dust tracers represent a valuable future extension. This constitutes a partial revision focused on added caveats rather than new quantitative analysis. revision: partial
Circularity Check
No circularity: observational correlations presented as direct empirical results
full rationale
The paper reports direct multi-frequency comparisons of HI complexity measures with depolarization and Faraday depth moments over the high-latitude sky. These are presented as observed correlations without any derivation chain, fitted parameters relabeled as predictions, self-definitional quantities, or load-bearing self-citations. The interpretation that neutral gas may contribute to synchrotron and Faraday rotation is an inference from the correlations, not a result forced by the paper's own inputs or equations. The analysis is self-contained against external benchmarks and contains no steps that reduce by construction to their inputs.
Axiom & Free-Parameter Ledger
Reference graph
Works this paper leans on
-
[1]
Aghanim, N., Akrami, Y., Alves, M. I. R., et al. 2020, A&A, 641, A12, doi: 10.1051/0004-6361/201833885
-
[2]
Alger, M. J., Livingston, J. D., McClure-Griffiths, N. M., et al. 2021, PASA, 38, e022, doi: 10.1017/pasa.2021.10
-
[3]
V olume 5: Galactic Structure and Stellar Populations, ed
Beck, R., & Wielebinski, R. 2013, in Planets, Stars and Stellar Systems. Volume 5: Galactic Structure and Stellar Populations, ed. T. D. Oswalt & G. Gilmore, Vol. 5, 641, doi: 10.1007/978-94-007-5612-0 13 Ben Bekhti, N., Fl¨ oer, L., Keller, R., et al. 2016, A&A, 594, A116, doi: 10.1051/0004-6361/201629178
-
[4]
Bennett, C. L., Larson, D., Weiland, J. L., et al. 2013, ApJS, 208, 20, doi: 10.1088/0067-0049/208/2/20
-
[5]
2026, A&A, 708, A245, doi: 10.1051/0004-6361/202557351
Berat, J., Miville-Deschˆ enes, M.-A., Bracco, A., Hennebelle, P., & Scholtys, J. 2026, A&A, 708, A245, doi: 10.1051/0004-6361/202557351
-
[6]
A., Ordog, A., Brown, J.-A., et al
Booth, R. A., Ordog, A., Brown, J.-A., et al. 2026, ApJ, 997, 304, doi: 10.3847/1538-4357/ae28d1
-
[7]
Boulanger, F., Gry, C., Jenkins, E. B., et al. 2024, A&A, 687, A102, doi: 10.1051/0004-6361/202348953
-
[8]
1988, ApJ, 330, 964, doi: 10.1086/166526
Boulanger, F., & Perault, M. 1988, ApJ, 330, 964, doi: 10.1086/166526
-
[9]
2020, A&A, 644, L3, doi: 10.1051/0004-6361/202039283
Bracco, A., Jeli´ c, V., Marchal, A., et al. 2020, A&A, 644, L3, doi: 10.1051/0004-6361/202039283
-
[10]
Brentjens, M. A., & de Bruyn, A. G. 2005, A&A, 441, 1217, doi: 10.1051/0004-6361:20052990
-
[11]
Burn, B. J. 1966, Monthly Notices of the Royal Astronomical Society, 133, 67, doi: 10.1093/mnras/133.1.67
-
[12]
Campbell, J. L., Clark, S. E., Gaensler, B. M., et al. 2022, ApJ, 927, 49, doi: 10.3847/1538-4357/ac400d
-
[13]
2019, MNRAS, 489, 2330, doi: 10.1093/mnras/stz806
Carretti, E., Haverkorn, M., Staveley-Smith, L., et al. 2019, MNRAS, 489, 2330, doi: 10.1093/mnras/stz806
-
[14]
Clark, S. E. 2018, ApJL, 857, L10, doi: 10.3847/2041-8213/aabb54
-
[15]
Clark, S. E., & Hensley, B. S. 2019, ApJ, 887, 136, doi: 10.3847/1538-4357/ab5803
-
[16]
Cooray, S., Takeuchi, T. T., Akahori, T., et al. 2021, MNRAS, 500, 5129, doi: 10.1093/mnras/staa3580
-
[17]
1989, ApJ, 342, 785, doi: 10.1086/167636
Danly, L. 1989, ApJ, 342, 785, doi: 10.1086/167636
-
[18]
Dickey, J. M., Landecker, T. L., Thomson, A. J. M., et al. 2019, ApJ, 871, 106, doi: 10.3847/1538-4357/aaf85f
-
[19]
Dickey, J. M., West, J., Thomson, A. J. M., et al. 2022, ApJ, 940, 75, doi: 10.3847/1538-4357/ac94ce
-
[20]
2024, A&A, 685, A82, doi: 10.1051/0004-6361/202347628
Edenhofer, G., Zucker, C., Frank, P., et al. 2024, A&A, 685, A82, doi: 10.1051/0004-6361/202347628
-
[21]
2024, A&A, 687, A23, doi: 10.1051/0004-6361/202348586 —
Erceg, A., Jeli´ c, V., Haverkorn, M., et al. 2024, A&A, 687, A23, doi: 10.1051/0004-6361/202348586 —. 2022, A&A, 663, A7, doi: 10.1051/0004-6361/202142244 G´ orski, K. M., Hivon, E., Banday, A. J., et al. 2005, ApJ, 622, 759, doi: 10.1086/427976
-
[22]
Halal, G., Clark, S. E., & Tahani, M. 2024, ApJ, 973, 54, doi: 10.3847/1538-4357/ad61e0
-
[23]
2015, in Astrophysics and Space Science
Haverkorn, M. 2015, in Astrophysics and Space Science
2015
-
[24]
407, Magnetic Fields in Diffuse Media, ed
Library, Vol. 407, Magnetic Fields in Diffuse Media, ed. A. Lazarian, E. M. de Gouveia Dal Pino, & C. Melioli, 483, doi: 10.1007/978-3-662-44625-6 17
-
[25]
2019, Galaxies, 7, 26, doi: 10.3390/galaxies7010026
Haverkorn, M., Machida, M., & Akahori, T. 2019, Galaxies, 7, 26, doi: 10.3390/galaxies7010026
-
[26]
2009, in IAU Symposium, Vol
Heald, G. 2009, in IAU Symposium, Vol. 259, Cosmic Magnetic Fields: From Planets, to Stars and Galaxies, ed. K. G. Strassmeier, A. G. Kosovichev, & J. E. Beckman (Cambridge University Press), 591–598
2009
-
[27]
Hensley, B. S., Murray, C. E., & Dodici, M. 2022, ApJ, 929, 23, doi: 10.3847/1538-4357/ac5cbd
-
[28]
Hill, A. S. 2018, Galaxies, 6, 129, doi: 10.3390/galaxies6040129
-
[29]
Hutschenreuter, S., Anderson, C. S., Betti, S., et al. 2022, A&A, 657, A43, doi: 10.1051/0004-6361/202140486 Jeli´ c, V., Prelogovi´ c, D., Haverkorn, M., Remeijn, J., & Klindˇ zi´ c, D. 2018, A&A, 615, L3, doi: 10.1051/0004-6361/201833291
-
[30]
Kalberla, P. M. W., & Kerp, J. 2016, A&A, 595, A37, doi: 10.1051/0004-6361/201629113
-
[31]
Kalberla, P. M. W., Kerp, J., Haud, U., & Haverkorn, M. 2017, A&A, 607, A15, doi: 10.1051/0004-6361/201629627
-
[32]
Lei, M., & Clark, S. E. 2024, ApJ, 972, 66, doi: 10.3847/1538-4357/ad5ade
-
[33]
Lenz, D., Hensley, B. S., & Dor´ e, O. 2017, ApJ, 846, 38, doi: 10.3847/1538-4357/aa84af
-
[34]
2024, ApJ, 966, 43, doi: 10.3847/1538-4357/ad2e9e
Martin-Alvarez, S., Lopez-Rodriguez, E., Dacunha, T., et al. 2024, ApJ, 966, 43, doi: 10.3847/1538-4357/ad2e9e
-
[35]
M., Stanimirovi´ c, S., & Rybarczyk, D
McClure-Griffiths, N. M., Stanimirovi´ c, S., & Rybarczyk, D. R. 2023, ARA&A, 61, 19, doi: 10.1146/annurev-astro-052920-104851
-
[36]
2019, MNRAS, 482, 2739, doi: 10.1093/mnras/sty2862 16
Takahashi, K. 2019, MNRAS, 482, 2739, doi: 10.1093/mnras/sty2862 16
-
[37]
Ordog, A., Booth, R. A., Van Eck, C. L., Brown, J.-A. C., & Landecker, T. L. 2019, Galaxies, 7, 43, doi: 10.3390/galaxies7020043
-
[38]
Panopoulou, G. V., & Lenz, D. 2020, ApJ, 902, 120, doi: 10.3847/1538-4357/abb6f5
-
[39]
2023, in Astronomical Society of the Pacific Conference
Pattle, K., Fissel, L., Tahani, M., Liu, T., & Ntormousi, E. 2023, in Astronomical Society of the Pacific Conference
2023
-
[40]
Protostars and Planets VII , year = 2023, editor =
Series, Vol. 534, Protostars and Planets VII, ed. S. Inutsuka, Y. Aikawa, T. Muto, K. Tomida, & M. Tamura, 193, doi: 10.48550/arXiv.2203.11179
-
[41]
Peek, J. E. G., & Clark, S. E. 2019, ApJL, 886, L13, doi: 10.3847/2041-8213/ab53de
-
[42]
Pelgrims, V., Mandarakas, N., Skalidis, R., et al. 2024, A&A, 684, A162, doi: 10.1051/0004-6361/202349015 Planck Collaboration, Aghanim, N., Akrami, Y., et al. 2020, A&A, 641, A12, doi: 10.1051/0004-6361/201833885
-
[43]
2014, MNRAS, 439, 4048, doi: 10.1093/mnras/stu270
Plaszczynski, S., Montier, L., Levrier, F., & Tristram, M. 2014, MNRAS, 439, 4048, doi: 10.1093/mnras/stu270
-
[44]
Ponnada, S. B., Panopoulou, G. V., Butsky, I. S., et al. 2024, MNRAS, 527, 11707, doi: 10.1093/mnras/stad3978
-
[45]
Gaensler, B. M. 2020, RM-Tools: Rotation measure (RM) synthesis and Stokes QU-fitting, Astrophysics Source Code Library, record ascl:2005.003
2020
-
[46]
2025, A&A, 695, A101, doi: 10.1051/0004-6361/202449556
Raycheva, N., Haverkorn, M., Ideguchi, S., et al. 2025, A&A, 695, A101, doi: 10.1051/0004-6361/202449556
-
[47]
Robitaille, T. P., Tollerud, E. J., Greenfield, P., et al. 2013, A&A, 558, A33, doi: 10.1051/0004-6361/201322068 Rubi˜ no-Mart´ ın, J. A., Guidi, F., G´ enova-Santos, R. T., et al. 2023, MNRAS, 519, 3383, doi: 10.1093/mnras/stac3439
-
[48]
Stuart, E. A. 2010, Statistical Science, 25, 1, doi: 10.1214/09-sts313
-
[49]
2025, Astronomy and Astrophysics, 694, A169, doi: 10.1051/0004-6361/202453326
Sun, X., Haverkorn, M., Carretti, E., et al. 2025, A&A, 694, A169, doi: 10.1051/0004-6361/202453326
-
[50]
H., Rudnick, L., Akahori, T., et al
Sun, X. H., Rudnick, L., Akahori, T., et al. 2015, AJ, 149, 60, doi: 10.1088/0004-6256/149/2/60
-
[51]
2026, in American Astronomical Society Meeting
Tahani, M., Hollberg, L., Lokhorst, D., Kim, J., & Team, D. 2026, in American Astronomical Society Meeting
2026
-
[52]
Tahani, M., Plume, R., Brown, J. C., & Kainulainen, J. 2018, A&A, 614, A100, doi: 10.1051/0004-6361/201732219
-
[53]
PASIPHAE: A high-Galactic-latitude, high-accuracy optopolarimetric survey
Tassis, K., Ramaprakash, A. N., Readhead, A. C. S., et al. 2018, arXiv e-prints, arXiv:1810.05652, doi: 10.48550/arXiv.1810.05652
work page internal anchor Pith review Pith/arXiv arXiv doi:10.48550/arxiv.1810.05652 2018
-
[54]
Testori, J. C., Reich, P., & Reich, W. 2008, A&A, 484, 733, doi: 10.1051/0004-6361:20078842
-
[55]
Uyaniker, B., Landecker, T. L., Gray, A. D., & Kothes, R. 2003, ApJ, 585, 785, doi: 10.1086/346234 van der Walt, S., Colbert, S. C., & Varoquaux, G. 2011, Computing in Science and Engineering, 13, 22, doi: 10.1109/MCSE.2011.37 Van Eck, C. L. 2018, Galaxies, 6, 112, doi: 10.3390/galaxies6040112 Van Eck, C. L., Haverkorn, M., Alves, M. I. R., et al. 2017, A...
-
[56]
Virtanen, P., Gommers, R., Oliphant, T. E., et al. 2020, Nature Methods, 17, 261, doi: 10.1038/s41592-019-0686-2
-
[57]
Y., Sallmen, S., & Lallement, R
Welsh, B. Y., Sallmen, S., & Lallement, R. 2004, A&A, 414, 261, doi: 10.1051/0004-6361:20034367
-
[58]
2024, The Journal of Open Source Software, 9, 7201, doi: 10.21105/joss.07201
Wenger, T. 2024, The Journal of Open Source Software, 9, 7201, doi: 10.21105/joss.07201
-
[59]
L., Reich, W., & Wielebinski, R
Wolleben, M., Landecker, T. L., Reich, W., & Wielebinski, R. 2006, A&A, 448, 411, doi: 10.1051/0004-6361:20053851
-
[60]
Wolleben, M., Landecker, T. L., Carretti, E., et al. 2009, in IAU Symposium, Vol. 259, 89–90, doi: 10.1017/S1743921309030117
-
[61]
Wolleben, M., Landecker, T. L., Carretti, E., et al. 2019, AJ, 158, 44, doi: 10.3847/1538-3881/ab22b0
-
[62]
Wolleben, M., Landecker, T. L., Douglas, K. A., et al. 2021, AJ, 162, 35, doi: 10.3847/1538-3881/abf7c1
-
[63]
Zaroubi, S., Jelic, V., de Bruyn, A. G., et al. 2015, MNRAS, 454, L46, doi: 10.1093/mnrasl/slv123
-
[64]
Zhang, X., Green, G. M., & Rix, H.-W. 2023, MNRAS, 524, 1855, doi: 10.1093/mnras/stad1941
discussion (0)
Sign in with ORCID, Apple, or X to comment. Anyone can read and Pith papers without signing in.