Restricted Multivariate Spatial Modeling
Pith reviewed 2026-06-27 08:30 UTC · model grok-4.3
The pith
The MCAR model can be reparameterized to control its informativeness so it contributes comparably across demographic subgroups in spatial disease modeling.
A machine-rendered reading of the paper's core claim, the machinery that carries it, and where it could break.
Core claim
The central claim is that reparameterizing the MCAR model within a computationally efficient framework measures and controls its informativeness, ensuring the model contributes comparably to each subgroup while preserving the ability to capture spatial dependence and cross-subgroup correlations, as shown by comparison to the BYM CAR model and application to county-level heart disease death data stratified by race and sex.
What carries the argument
A reparameterization of the multivariate conditional autoregressive (MCAR) model that adjusts its informativeness level.
If this is right
- The restricted MCAR model produces less oversmoothed estimates than the unrestricted version when modeling multiple subgroups.
- Informativeness of the MCAR model can be directly compared to that of the univariate BYM CAR model using the new measurement framework.
- The approach maintains the capacity to model both spatial dependence within subgroups and correlations across subgroups.
- The method supports joint modeling of demographic subgroups for a single disease without one group dominating the shared information.
Where Pith is reading between the lines
- The informativeness measure could be applied to tune models when subgroup sizes are highly unequal.
- Similar reparameterization techniques might limit excess borrowing in other hierarchical spatial models outside disease mapping.
- The framework offers a way to test whether current multivariate spatial models unintentionally favor larger subgroups in real applications.
Load-bearing premise
The reparameterization successfully controls the MCAR model's informativeness to ensure comparable contributions to each subgroup while still preserving spatial dependence and cross-subgroup correlations.
What would settle it
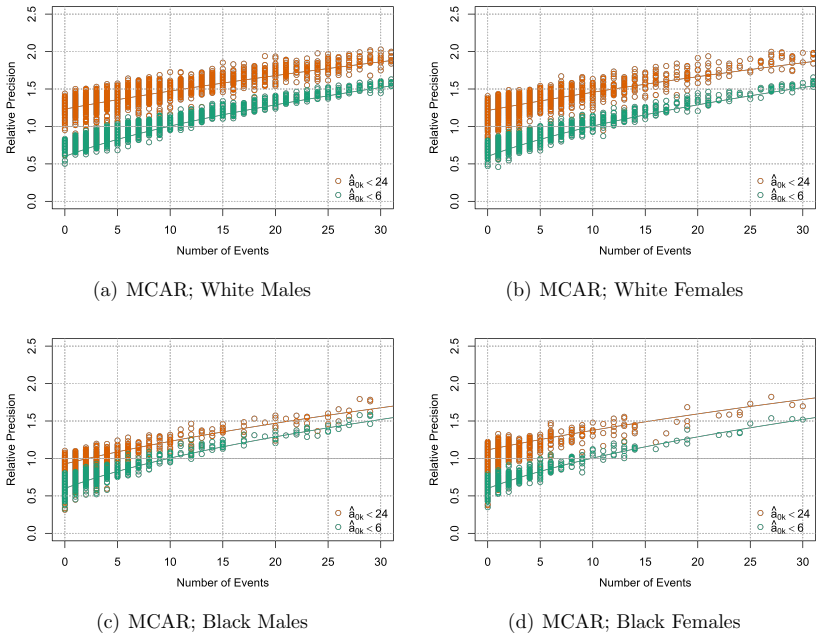
If the restricted MCAR model applied to the stratified heart disease data yields precision levels or borrowing patterns that differ markedly across race-sex subgroups from those of the unrestricted MCAR, or fails to recover known spatial correlations in the data, that would challenge the claim.
Figures


read the original abstract
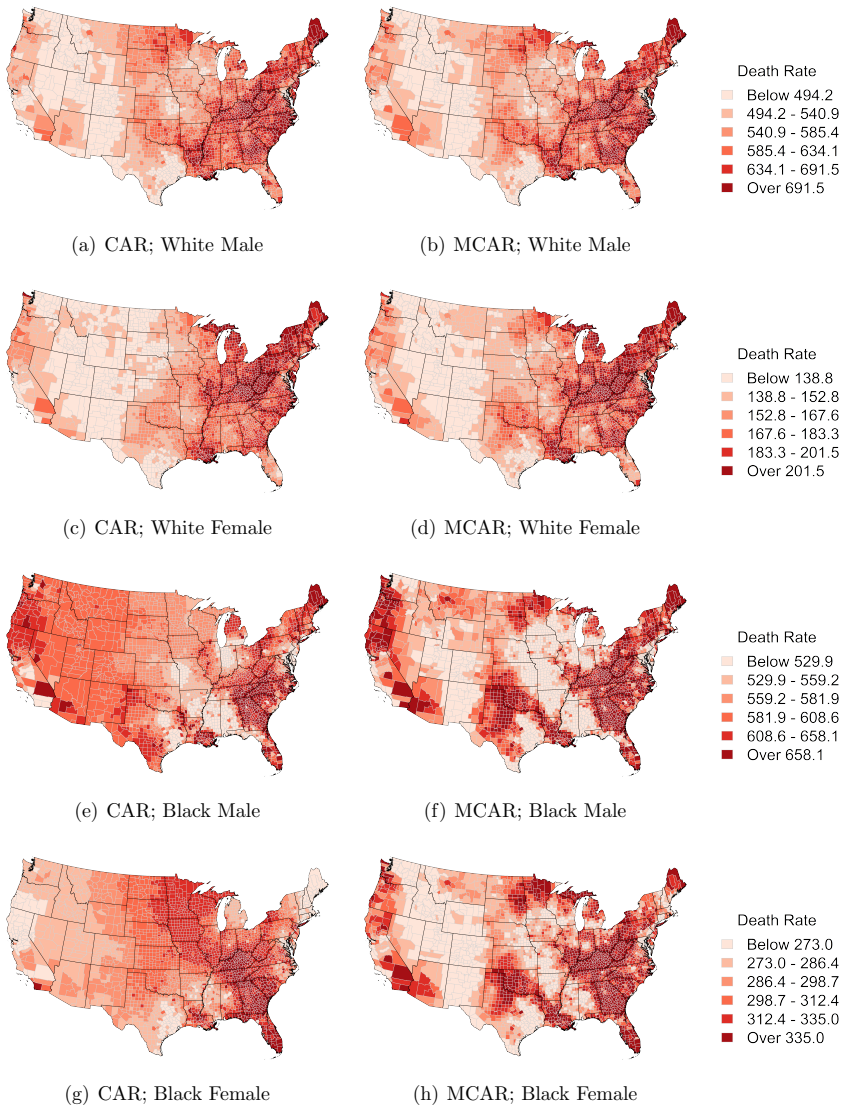
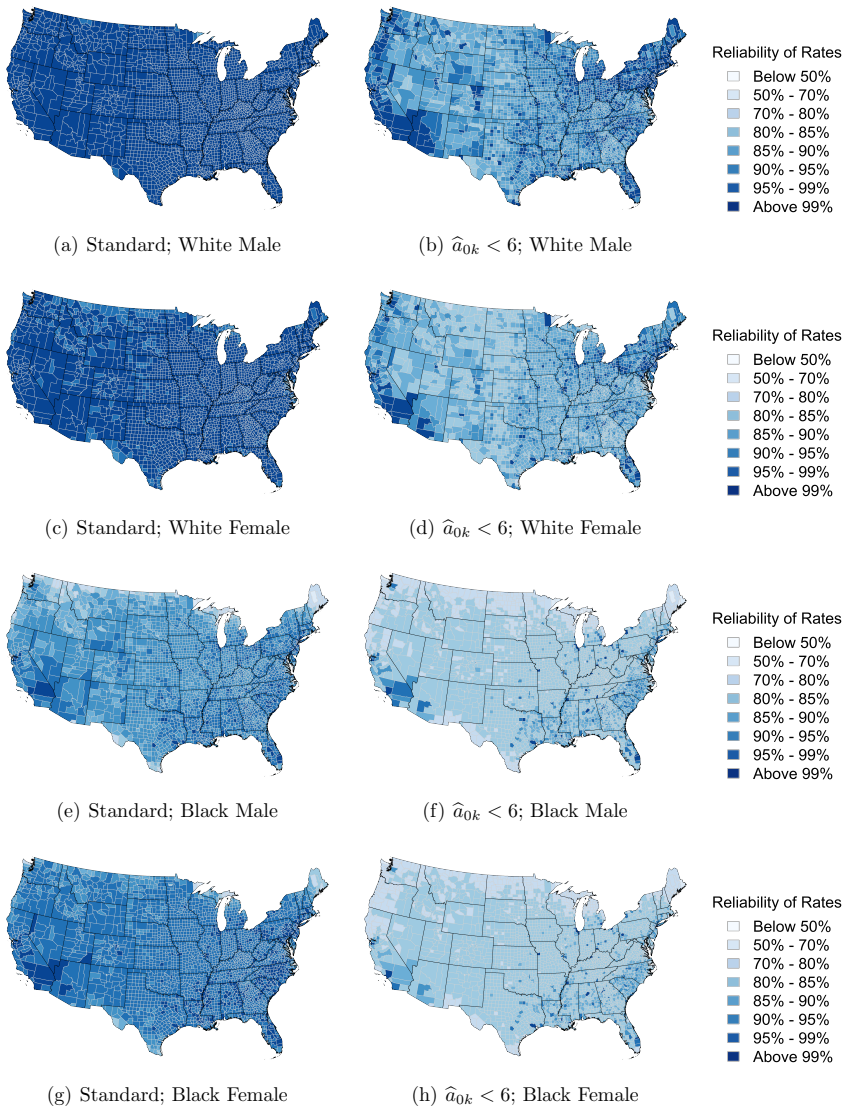
When modeling health events in small areas, the conditional autoregressive (CAR) framework of Besag, York, and Molli\'{e} (BYM) is widely used. For multiple outcomes, the multivariate CAR (MCAR) extension accommodates dependence among diseases that share risk factors, in addition to spatial dependence, and can also jointly model demographic subgroups for a single disease, allowing information to be borrowed across related populations. However, recent studies have shown that the BYM CAR model can be overly informative, leading to excessively precise estimates. While the MCAR model is expected to be more informative due to additional information shared across subgroups, its level of informativeness has not been previously quantified. We propose a framework to measure MCAR model informativeness as an extension of prior work and introduce a method to control it, ensuring the model contributes comparably to each subgroup. We achieve this through a reparameterization of the MCAR model within a computationally efficient framework. We demonstrate how the MCAR model compares with the BYM CAR model in terms of informativeness and oversmoothing and highlight the advantages of the restricted MCAR model using county-level heart disease death data stratified by race and sex.
Editorial analysis
A structured set of objections, weighed in public.
Referee Report
Summary. The paper extends the BYM conditional autoregressive (CAR) model to a multivariate CAR (MCAR) setting for joint modeling of health events across demographic subgroups. It proposes a framework to quantify MCAR informativeness (extending prior BYM work) and a reparameterization method to control this informativeness, ensuring the model contributes comparably across subgroups while preserving spatial dependence and cross-subgroup correlations. The approach is presented in a computationally efficient framework and illustrated via application to county-level heart disease mortality data stratified by race and sex, with comparisons to standard BYM CAR models on informativeness and oversmoothing.
Significance. If the reparameterization achieves the claimed control on informativeness with equalized subgroup contributions, the work would offer a practical advance for multivariate spatial modeling in epidemiology, addressing known over-informativeness issues in BYM models while enabling balanced borrowing of strength across groups. The emphasis on computational efficiency and the empirical demonstration on real stratified data are strengths. However, the provided description supplies no derivation details, validation metrics, error analysis, or quantitative results, making it impossible to assess whether the central claims hold or whether the method generalizes beyond the specific demonstration.
major comments (2)
- [Abstract] Abstract: The central claim that the reparameterization of the MCAR model controls informativeness to ensure comparable contribution to each subgroup lacks any supporting derivation, proof, or explicit construction. It is unclear whether the reparameterization operates via a global scaling factor (which would leave marginal variances and effective degrees of freedom unnormalized across subgroups) or includes per-subgroup adjustments; this directly bears on whether the method succeeds when subgroup sizes or spatial supports differ, as is the case for race/sex-stratified heart disease data.
- [Abstract] Abstract (demonstration section): No validation metrics, error analysis, or quantitative comparison of effective information per subgroup (e.g., via marginal variances, shrinkage factors, or effective degrees of freedom) are supplied, so it is impossible to verify that the restricted MCAR achieves the stated equalization while preserving cross-subgroup correlations.
Simulated Author's Rebuttal
We thank the referee for their detailed comments on the abstract. The full manuscript contains the requested derivations, explicit constructions, and quantitative results in Sections 3 and 4; we will revise the abstract to better summarize these elements without exceeding length constraints.
read point-by-point responses
-
Referee: [Abstract] Abstract: The central claim that the reparameterization of the MCAR model controls informativeness to ensure comparable contribution to each subgroup lacks any supporting derivation, proof, or explicit construction. It is unclear whether the reparameterization operates via a global scaling factor (which would leave marginal variances and effective degrees of freedom unnormalized across subgroups) or includes per-subgroup adjustments; this directly bears on whether the method succeeds when subgroup sizes or spatial supports differ, as is the case for race/sex-stratified heart disease data.
Authors: The full manuscript (Section 3.2) derives the reparameterization explicitly via a transformation of the MCAR precision matrix that applies per-subgroup scaling factors computed from the marginal variances of each outcome. This is not a global scaling; the adjustments are subgroup-specific to equalize effective degrees of freedom while preserving the cross-subgroup correlation structure. The application to race/sex-stratified data (with unequal subgroup sizes) is used precisely to illustrate that the method succeeds in this setting. We will revise the abstract to note the per-subgroup adjustment. revision: yes
-
Referee: [Abstract] Abstract (demonstration section): No validation metrics, error analysis, or quantitative comparison of effective information per subgroup (e.g., via marginal variances, shrinkage factors, or effective degrees of freedom) are supplied, so it is impossible to verify that the restricted MCAR achieves the stated equalization while preserving cross-subgroup correlations.
Authors: Section 4 of the manuscript reports quantitative comparisons, including subgroup-specific effective degrees of freedom, marginal variances, and shrinkage factors (Tables 2–3 and Figures 3–4), demonstrating equalization of contributions relative to standard BYM models while cross-subgroup correlations remain intact. No formal error analysis is presented beyond these metrics. We agree the abstract omits these details due to space and will revise it to reference the key quantitative findings on equalization. revision: yes
Circularity Check
No significant circularity; reparameterization extends independent prior BYM work
full rationale
The paper frames its contribution as an extension of prior work on BYM model informativeness to the MCAR setting, proposing a measurement framework and a reparameterization method to control it for comparable subgroup contribution. No load-bearing step reduces by construction to a fitted input, self-citation chain, or definitional equivalence; the central derivation remains self-contained with independent content in the restricted MCAR construction. This is the most common honest finding for extension papers that do not rename or refit their own outputs as predictions.
Axiom & Free-Parameter Ledger
Reference graph
Works this paper leans on
-
[1]
Wikipedia , url =
Category:. Wikipedia , url =
-
[2]
Osprey Packs , url =
Daylite. Osprey Packs , url =
-
[3]
General Modelling Framework for Multivariate Disease Mapping
-
[4]
Interpreting. doi:10.1289/ehp.6740 , url =
-
[5]
Joint Mean-Covariance Models with Applications to Longitudinal Data: Unconstrained Parameterisation
-
[6]
Modelling Risks in Disease Mapping , doi =
-
[7]
More on Scaled-Inverse
-
[8]
and Holt, J
Zhang, X. and Holt, J. B. and Lu, H. and Wheaton, A. G. and Ford, E.S. and Greenlund, K. J. and Croft, J. B. , year = 2014, journal =. Multilevel Regression and Poststratification for Small-Area Estimation of Population Health Outcomes:
2014
-
[9]
Vaughan, A. S. and Quick, H. and Schieb, L. and Kramer, M. R. and Taylor, H. and Casper, M. , year = 2019, journal =. Changing Rate Orders of Race-Gender Heart Disease Death Rates:
2019
-
[10]
and Schieb, L
Vaughan, A. and Schieb, L. and Quick, H. and Kramer, M. R. and Casper, M. , year = 2018, journal =. Before the Here and Now:
2018
-
[11]
Vaughan, A. S. and Quick, H. and. Disparities in Temporal and Geographic Patterns of Declining Heart Disease Mortality by Race and Sex in the. Journal of the American Heart Association , volume =
-
[12]
Vaughan, A. S. and Kramer, M. R. and Casper, M. , year = 2014, journal =. Geographic Disparities in Declining Rates of Heart Disease Mortality in the Southern
2014
-
[13]
Annals of Epidemiology , volume =
Widespread Recent Increases in County-Level Heart Disease Mortality across Age Groups , author =. Annals of Epidemiology , volume =
-
[14]
Vaughan, A. S. and Kramer, M. R. and Waller, L. A. and Schieb, L. J. and Greer, S. and Casper, M. , year = 2015, journal =. Comparing Methods of Measuring Geographic Patterns in Temporal Trends:
2015
- [15]
-
[16]
arXiv , keywords =:1408.4050 , primaryclass =
Bayesian Inference for a Covariance Matrix , author =. arXiv , keywords =:1408.4050 , primaryclass =
-
[17]
Andrade, Chittaranjan , year = 2019, journal =. The. doi:10.4103/IJPSYM.IJPSYM_193_19 , url =
-
[18]
and Killings, Xzavier and Oddo, Elizabeth R
Andrews, Annie L. and Killings, Xzavier and Oddo, Elizabeth R. and Gastineau, Kelsey A.B. and Hink, Ashley B. , year = 2022, month = feb, journal =. Pediatric. doi:10.1542/peds.2021-052739 , url =
-
[19]
Statistics and Computing , volume =
Bayesian Longitudinal Item Response Modeling with Restricted Covariance Pattern Structures , author =. Statistics and Computing , volume =. doi:10.1007/s11222-014-9518-5 , url =
-
[20]
Statistics in Medicine , volume =
A Unifying Modeling Framework for Highly Multivariate Disease Mapping , author =. Statistics in Medicine , volume =
-
[21]
Structural Racism and Health Inequities in the
Bailey, Zinzi D and Krieger, Nancy and Ag. Structural Racism and Health Inequities in the. The Lancet , volume =. doi:10.1016/S0140-6736(17)30569-X , url =
-
[22]
Biometrics
Bayesian Hierarchical Spatially Correlated Functional Data Analysis with Application to Colon Carcinoginesis , author =. Biometrics. Journal of the International Biometric Society , volume =
-
[23]
Uncovering Patterns for Adverse Pregnancy Outcomes with a
Balocchi, Cecilia and Bai, Ray and Liu, Jessica and Canelon, Silvia P and George, Edward I and Chen, Yong and Boland, Mary R , abstract =. Uncovering Patterns for Adverse Pregnancy Outcomes with a
-
[24]
Journal of the Royal Statistical Society: Series B (Statistical Methodology) , volume =
Gaussian Predictive Process Models for Large Spatial Data Sets , author =. Journal of the Royal Statistical Society: Series B (Statistical Methodology) , volume =. doi:10.1111/j.1467-9868.2008.00663.x , url =
-
[25]
Modeling
Barnard, John and McCulloch, Robert and Meng, Xiao-Li , year = 2000, journal =. Modeling. 24306780 , eprinttype =
2000
-
[26]
Barrett, Jefferson T. and Lee, Lois K. and Monuteaux, Michael C. and Farrell, Caitlin A. and Hoffmann, Jennifer A. and Fleegler, Eric W. , year = 2022, month = feb, journal =. Association of. doi:10.1001/jamapediatrics.2021.4822 , url =
-
[27]
, year = 1763, journal =
Bayes, T. , year = 1763, journal =. An Essay towards Solving a Problem in the
-
[28]
Hierarchical Modeling and Analysis of Spatial Data , author =
-
[29]
and Clayton, D
Bernardinelli, L. and Clayton, D. and Montomoli, C. , year = 1995, journal =. Bayesian Estimates of Disease Maps:
1995
-
[30]
Bernardinelli, L and Clayton, D. and Montomoli, C. , year = 1995, journal =. Bayesian Estimates of Disease Maps:. doi:10.1002/sim.4780142111 , url =
-
[31]
Spatial Interaction and the Statistical Analysis of Lattice Systems (with
-
[32]
Annals of the Institute of Statistical Mathematics , volume =
Bayesian Image Restoration, with Two Applications in Spatial Statistics , author =. Annals of the Institute of Statistical Mathematics , volume =. doi:10.1007/BF00116466 , url =
-
[33]
Journal of the Royal Statistical Society: Series B , volume =
Bayesian Analysis of Agricultural Field Experiments (with Discussion) , author =. Journal of the Royal Statistical Society: Series B , volume =
-
[34]
Statistical Science , volume =
Bayesian Computation and Stochastic Systems (with Discussion) , author =. Statistical Science , volume =
-
[35]
Besag, Julian , year = 1974, journal =. Spatial. doi:10.1111/j.2517-6161.1974.tb00999.x , url =
-
[36]
, year = 1974, journal =
Besag, J. , year = 1974, journal =. Spatial Interaction and the Statistical Analysis of Lattice Systems (with
1974
-
[37]
Biometrika , volume =
On Conditional and Intrinsic Autoregressions , author =. Biometrika , volume =
-
[38]
Best, N. G. and Arnold, R. A. and Thomas, A. and Waller, L. A. and Conlon, E. M. , editor =. Bayesian Models for Spatially Correlated Disease and Exposure Data (with Discussion) , booktitle =
-
[39]
Journal of the American Statistical Association , volume =
Directional Rates of Change under Spatial Process Models , author =. Journal of the American Statistical Association , volume =
-
[40]
Sharma, A. and. Heart Failure in. Cleveland Clinic Journal of Medicine , volume =
-
[41]
Statistica Sinica , volume =
Modeling Covariance Matrices in Terms of Standard Deviations and Correlations, with Application to Shrinkage , author =. Statistica Sinica , volume =
-
[42]
Bodnar, Taras and Mazur, Stepan and Podg. Singular Inverse. Journal of Multivariate Analysis , volume =. doi:10.1016/j.jmva.2015.09.021 , url =
-
[43]
Journal of Geographical Systems , volume =
Global and Local Spatial Autocorrelation in Bounded Regular Tessellations , author =. Journal of Geographical Systems , volume =. doi:10.1007/PL00011461 , url =
-
[44]
Statistics in Medicine , volume =
A Unifying Modeling Framework for Highly Multivariate Disease Mapping , author =. Statistics in Medicine , volume =. doi:10.1002/sim.6423 , url =
-
[45]
Journal of the Royal Statistical Society, Series B , volume =
Regionalization of Multiscale Spatial Processes Using a Criterion for Spatial Aggregation Error , author =. Journal of the Royal Statistical Society, Series B , volume =
-
[46]
Bradley, J. R. and Wikle, C. K. and Holan, S. H. , year = 2015, journal =. Spatio-
2015
-
[47]
Bradley, J. R. and Wikle, C. K. and Holan, S. H. , year = 2015, journal =. Bayesian Spatial Change of Support for Count-Valued Survey Data with Application to
2015
-
[48]
Bradley, Jonathan R. and Holan, Scott H. and Wikle, Christopher K. , year = 2015, month = dec, journal =. Multivariate Spatio-Temporal Models for High-Dimensional Areal Data with Application to. doi:10.1214/15-AOAS862 , url =
-
[49]
and Nolan, A
Brewer, M. and Nolan, A. , year = 2007, journal =. Variable Smoothing in
2007
-
[50]
Brilleman, Samuel L. and Elci, Eren M. and Novik, Jacqueline Buros and Wolfe, Rory , year = 2020, month = feb, number =. Bayesian. arXiv , keywords =:2002.09633 , primaryclass =
arXiv 2020
-
[51]
Biometrics
The Natural Variability of Vital Rates and Associated Statistics , author =. Biometrics. Journal of the International Biometric Society , volume =
-
[52]
Brillinger, David R. , year = 1986, journal =. A. doi:10.2307/2530689 , url =. 2530689 , eprinttype =
-
[53]
Aspects of Uncertainty: A Tribute to DV Lindley , pages =
Inference for a Covariance Matrix , author =. Aspects of Uncertainty: A Tribute to DV Lindley , pages =
-
[54]
, year = 2022, month = dec, journal =
Bruzelius, Emilie and Martins, Silvia S. , year = 2022, month = dec, journal =. doi:10.1001/jama.2022.17045 , url =
-
[55]
Annals of the Institute of Statistical Mathematics , volume =
Bayesian Image Restoration, with Two Applications in Spatial Statistics , author =. Annals of the Institute of Statistical Mathematics , volume =
-
[56]
and Song, G
Quick, H. and Song, G. and Tabb, L. , year = 2021, journal =. Evaluating the Informativeness of the
2021
-
[57]
Cadwell, B. L. and Thompson, T. J. and Boyle, J. P. and Barker, L. E. , year = 2010, journal =. Bayesian Small Area Estimates of Diabetes Prevalence by
2010
-
[58]
Campbell, Jacquelyn and. Pregnancy-. Journal of Women's Health , volume =. doi:10.1089/jwh.2020.8875 , url =
-
[59]
Bayesian Statistics 7 , author =
Hierarchical Multivariate. Bayesian Statistics 7 , author =
-
[60]
Carroll, R. and Lawson, A. B. and Faes, C. and Kirby, R. S. and Aregay, M. and Watjou, K. , year = 2015, month = jul, journal =. Comparing. doi:10.1016/j.sste.2015.08.001 , url =
-
[61]
and Muntner, P
Ergin, A. and Muntner, P. and Sherwin, R. and He, J. , year = 2004, journal =. Secular Trends in Cardiovascular Disease Mortality, Incidence, and Case Fatality Rates in Adults in the
2004
-
[62]
and Kramer, M
Casper, M. and Kramer, M. and Quick, H. and Schieb, L. and Vaughan, A. and Greer, S. , year = 2016, journal =. Changes in the Geographic Patterns of Heart Disease Mortality in the
2016
-
[63]
Bridged-Race Population Estimates:
-
[64]
doi:10.1198/jcgs.2009.08095 , url =
Chan, Joshua Chi-Chun and Jeliazkov, Ivan , year = 2009, month = jan, journal =. doi:10.1198/jcgs.2009.08095 , url =
-
[65]
Chen, Jarvis T. and Coull, Brent A. and Waterman, Pamela D. and Schwartz, Joel and Krieger, Nancy , year = 2008, journal =. Methodologic Implications of Social Inequalities for Analyzing Health Disparities in Large Spatiotemporal Data Sets:. doi:10.1002/sim.3263 , url =
-
[66]
Cho, Kyunghyun , year = 2024, month = may, number =. A. arXiv , langid =:2405.08793 , primaryclass =
arXiv 2024
-
[67]
Bayesian Methods for Data Analysis , author =
-
[68]
and Kaldor, J
Clayton, D. and Kaldor, J. , year = 1987, journal =. Empirical
1987
-
[69]
CLAYTON, D G and BERNARDINELLI, L and MONTOMOLI, C , year = 1993, month = dec, journal =. Spatial. doi:10.1093/ije/22.6.1193 , url =
-
[70]
Cox, L. H. , editor =. A Data Quality and Data Confidentiality Assessment of Complementary Cell Suppression , booktitle =
-
[71]
Geographical Analysis , volume =
A Multivariate Model for Spatio-Temporal Health Outcomes with an Application to Suicide Mortality , author =. Geographical Analysis , volume =
-
[72]
A Multilevel Model for Cardiovascular Disease Prevalence in the
Congdon, Peter , year = 2009, month = jan, journal =. A Multilevel Model for Cardiovascular Disease Prevalence in the. doi:10.1186/1476-072X-8-6 , url =
-
[73]
Statistics in Medicine , volume =
Some Findings on Zero-Inflated and Hurdle Poisson Models for Disease Mapping , author =. Statistics in Medicine , volume =. doi:10.1002/sim.7819 , url =
-
[74]
and Agresti, Alan , year = 2000, journal =
Coull, Brent A. and Agresti, Alan , year = 2000, journal =. Random. doi:10.1111/j.0006-341X.2000.00073.x , url =
-
[75]
Zhang, C. H. and Schwartz, G. G. , year = 2020, journal =. Spatial Disparities in Coronavirus Incidence and Mortality in the
2020
-
[76]
Journal of the American Statistical Association , volume =
Classes of Nonseparable, Spatio-Temporal Stationary Covariance Functions , author =. Journal of the American Statistical Association , volume =
-
[77]
Statistics for Spatio-Temporal Data , author =
-
[78]
Tattersall, M. C. and Barnet, J. H. and Korcarz, C. E. and Hagen, E. W. and Peppard, P. E. and Stein, J. H. , year = 2016, journal =. Late-Onset Asthma Predicts Cardiovascular Disease Events:
2016
-
[79]
Ford, D. E. and Mead, L. A. and Chang, P. P. and. Depression Is a Risk Factor for Coronary Artery Disease in Men:. Archives of Internal Medicine , volume =
-
[80]
Journal of Computational and Graphical Statistics , volume =
Conditionally Specified Spacetime Models for Multivariate Processes , author =. Journal of Computational and Graphical Statistics , volume =
discussion (0)
Sign in with ORCID, Apple, or X to comment. Anyone can read and Pith papers without signing in.