Polarity Reversal of the Polar Magnetic Fields in Solar Cycle 25
Pith reviewed 2026-06-27 04:18 UTC · model grok-4.3
The pith
Polar magnetic fields reversed polarity in November 2024 north and October 2024 south during solar cycle 25.
A machine-rendered reading of the paper's core claim, the machinery that carries it, and where it could break.
Core claim
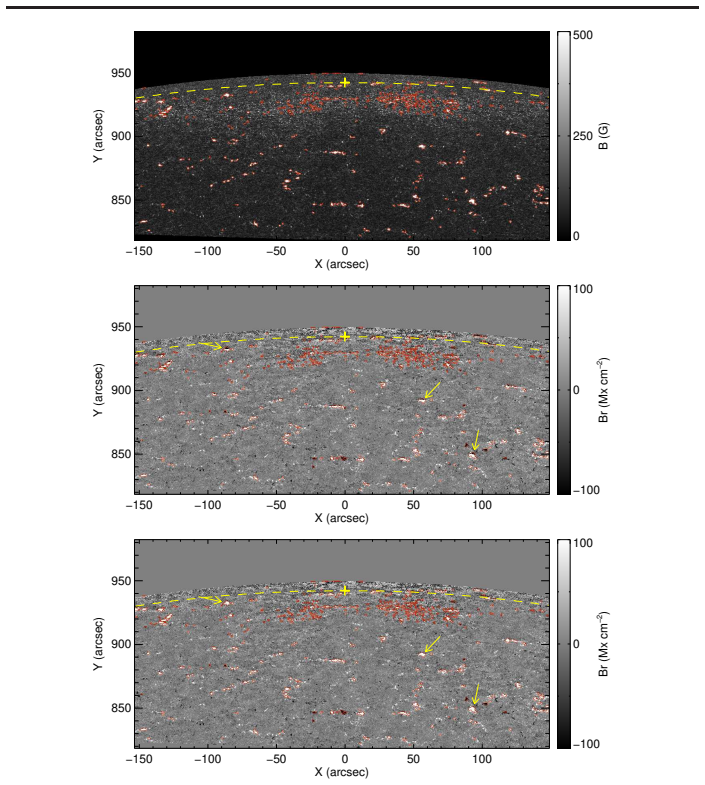
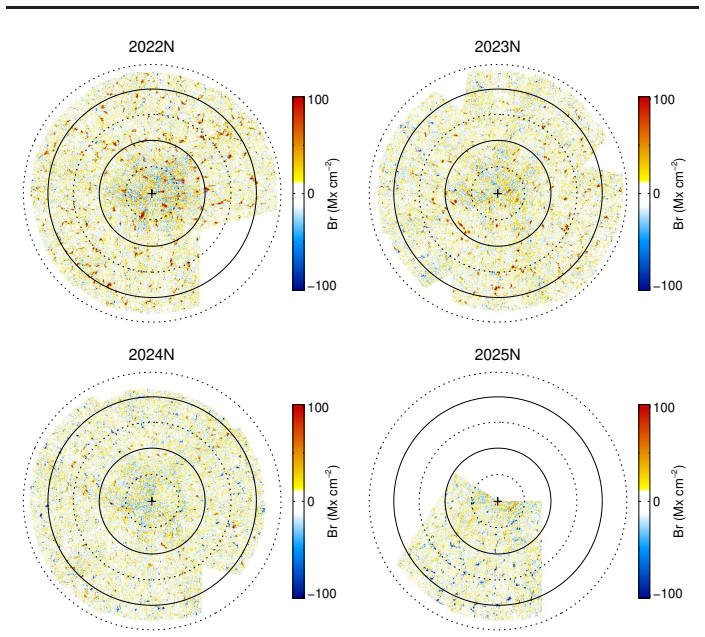
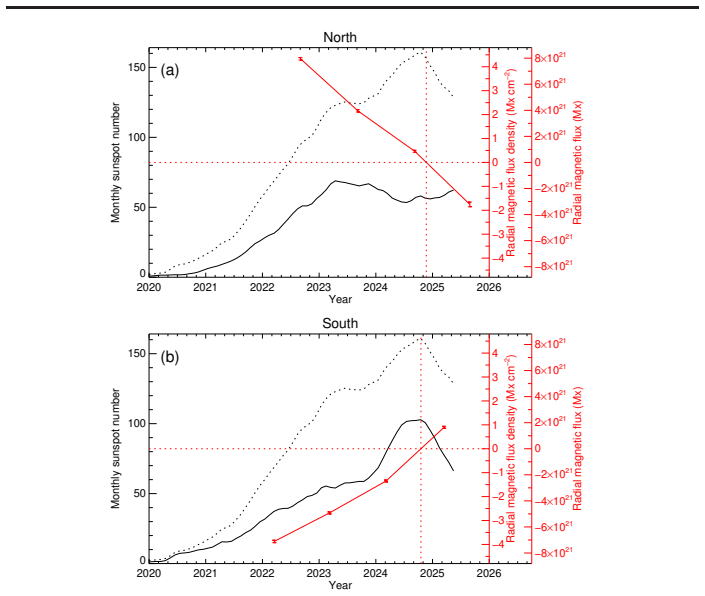
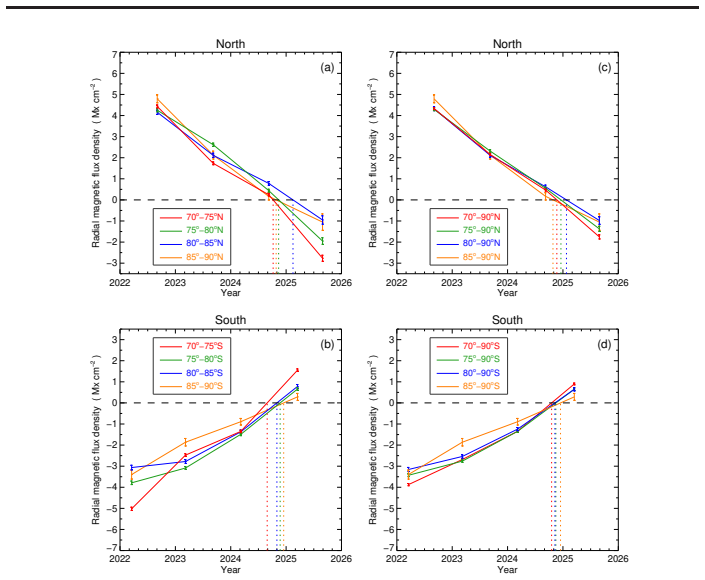
Using polar top-down composite maps from Hinode spectropolarimeter data, the polarity reversals of the northern and southern polar caps above 70 deg latitude likely occurred in November 2024 and October 2024, respectively. The northern reversal lagged the northern hemispheric sunspot number maximum by approximately 19 months, while the southern reversal possibly coincided with the southern maximum. Polarity reversal times at 5 deg intervals above 70 deg show earlier reversal at lower latitudes, consistent with solar cycle 24.
What carries the argument
Polar top-down composite maps from Hinode-view magnetograms that track year-to-year changes in polar field polarity.
If this is right
- The northern reversal occurs about 19 months after the northern sunspot maximum.
- The southern reversal aligns closely with the southern sunspot maximum.
- Reversals occur progressively earlier at lower polar latitudes.
- These observations serve as references for modeling polar polarity reversal in solar cycles.
Where Pith is reading between the lines
- Combining these dates with other solar observations could refine predictions of the next solar minimum.
- The hemispheric differences in reversal timing may relate to asymmetric magnetic field transport in the Sun.
- Future data from other observatories could confirm or adjust these reversal dates.
Load-bearing premise
The constructed polar top-down composite maps accurately represent the true large-scale polar field polarity without significant projection effects or lower-latitude contamination.
What would settle it
Subsequent magnetogram observations showing that the polar field polarity above 70 degrees did not match the reported reversal times in late 2024.
Figures


read the original abstract
The polar magnetic field polarity reversal is a key signature of solar cycle evolution, and precise determination of its timing is crucial for dynamo theory validation and solar cycle prediction. We investigate the polar polarity reversal of solar cycle 25 using the vector magnetic field data from the spectropolarimeter on board the Hinode satellite. We constructed polar top-down composite maps from Hinode-view magnetograms. These maps show the year-to-year polar polarity variations, with the northern polar region gradually changing from positive to negative and the southern polar region exhibiting the reverse behavior. The polarity reversals of the northern and southern polar caps (above 70 deg latitude) likely occurred in November 2024 and October 2024, respectively. The northern polarity reversal lagged the northern hemispheric sunspot number maximum by approximately 19 months, while the southern reversal possibly coincided with the southern maximum. Moreover, polarity reversal times calculated at 5 deg latitude intervals above 70 deg reveal a trend of earlier reversal in lower latitudes consistent with that of solar cycle 24. These results offer observational references for modeling polar polarity reversal in solar cycles.
Editorial analysis
A structured set of objections, weighed in public.
Referee Report
Summary. The manuscript analyzes vector magnetic field data from the Hinode spectropolarimeter to construct polar top-down composite maps, reporting that the polarity reversals of the northern and southern polar caps above 70 degrees latitude likely occurred in November 2024 and October 2024, respectively. It also notes a 19-month lag for the northern reversal relative to sunspot maximum and a trend of earlier reversals at lower latitudes within the polar region, consistent with cycle 24.
Significance. If the map construction is robust, this provides timely observational constraints on the timing of polar field reversals in cycle 25, which are valuable for validating solar dynamo models and improving cycle predictions. The use of established Hinode data and the latitude-interval analysis add to the observational record.
major comments (3)
- [§2 (Data and Analysis)] §2 (Data and Analysis): The polar top-down composite maps are formed from Hinode-view vector magnetograms with a 70° latitude threshold and averaging procedure; however, no quantitative evaluation or sensitivity tests are provided for line-of-sight projection effects at high heliocentric angles or residual lower-latitude flux leakage, which could systematically shift the apparent reversal timing.
- [Abstract and §3 (Results)] Abstract and §3 (Results): The reversal dates (November 2024 north, October 2024 south) and the 19-month lag are stated without error bars, data selection criteria, or sensitivity analysis to the exact latitude boundary or averaging kernel, undermining assessment of whether the reported months are robust.
- [§3 (Results)] §3 (Results): The reported trend of earlier reversal at lower latitudes (5° intervals above 70°) is presented as consistent with cycle 24, but without explicit checks that this trend is independent of projection or contamination biases in the map construction, the latitude dependence cannot be taken as confirmed.
minor comments (1)
- [Abstract] Abstract: Include the time span of the Hinode observations and the number of magnetograms used to provide context for the year-to-year maps.
Simulated Author's Rebuttal
We thank the referee for the constructive comments on our manuscript. We address each major comment point by point below, indicating planned revisions where appropriate.
read point-by-point responses
-
Referee: §2 (Data and Analysis): The polar top-down composite maps are formed from Hinode-view vector magnetograms with a 70° latitude threshold and averaging procedure; however, no quantitative evaluation or sensitivity tests are provided for line-of-sight projection effects at high heliocentric angles or residual lower-latitude flux leakage, which could systematically shift the apparent reversal timing.
Authors: We agree that explicit quantitative sensitivity tests are absent from the current version. In the revised manuscript we will add a dedicated paragraph in §2 describing tests that vary the latitude cutoff between 65°–75° and alter the spatial averaging kernel; the resulting shifts in apparent reversal timing will be quantified and tabulated. We will also note that the use of full vector magnetograms (rather than line-of-sight only) and the top-down polar projection already reduce the dominant projection bias, but the new tests will make this explicit. revision: yes
-
Referee: Abstract and §3 (Results): The reversal dates (November 2024 north, October 2024 south) and the 19-month lag are stated without error bars, data selection criteria, or sensitivity analysis to the exact latitude boundary or averaging kernel, undermining assessment of whether the reported months are robust.
Authors: We will revise the abstract and §3 to report reversal times with uncertainty ranges obtained from the ensemble of map constructions (different thresholds and kernels). Data-selection criteria (e.g., minimum number of magnetograms per month, noise thresholds) will be stated explicitly in §2. A new table in §3 will show reversal dates for the nominal 70° boundary as well as for 65° and 75° boundaries, allowing readers to judge robustness directly. revision: yes
-
Referee: §3 (Results): The reported trend of earlier reversal at lower latitudes (5° intervals above 70°) is presented as consistent with cycle 24, but without explicit checks that this trend is independent of projection or contamination biases in the map construction, the latitude dependence cannot be taken as confirmed.
Authors: We will add an explicit test in the revised §3: the latitude-interval analysis will be repeated after (i) applying an additional cosine-projection weighting and (ii) masking pixels within 5° of the 70° boundary. The persistence (or change) of the earlier-reversal trend at lower latitudes will be reported, together with a direct comparison to the cycle-24 result under the same test conditions. revision: yes
Circularity Check
Purely observational measurement of reversal timing from constructed maps; no derivations, fits, or self-citation chains
full rationale
The paper constructs polar top-down composite maps directly from Hinode SP vector magnetograms and reports reversal dates by inspecting year-to-year polarity changes above 70° latitude. No equations, parameters, or models appear; the timing is read from the maps without any prediction step that reduces to a fit. No self-citations are invoked to justify uniqueness, ansatzes, or load-bearing premises. The result is an empirical observation self-contained against the input magnetogram data.
Axiom & Free-Parameter Ledger
axioms (1)
- domain assumption Hinode spectropolarimeter vector magnetograms provide reliable measurements of polar magnetic fields suitable for composite mapping
Reference graph
Works this paper leans on
-
[1]
doi:10.24414/QNZA-AC80 , url =
Clette, Frédéric and Lefèvre, Laure , title =. doi:10.24414/QNZA-AC80 , url =
-
[2]
A Possible Source of Multiple Polarity Reversals of the Polar Magnetic Field during the Maximum Phase of Solar Cycle. APJ , keywords =. doi:10.3847/1538-4357/ade681 , adsurl =
-
[3]
The Astrophysical Journal , author =
The. The Astrophysical Journal , author =. 1959 , pages =. doi:10.1086/146726 , language =
-
[4]
ApJ , author =. 2012 , pages =. doi:10.1088/0004-637X/753/2/157 , abstract =
-
[5]
2007, title The Hinode (Solar-B) Mission: An Overview , , 243, 3, 10.1007/s11207-007-9014-6
The. Sol Phys , author =. 2007 , pages =. doi:10.1007/s11207-007-9014-6 , language =
-
[6]
Reversals of the. Sol Phys , author =. 2014 , pages =. doi:10.1007/s11207-013-0456-8 , abstract =
-
[7]
The strength of the. Sol Phys , author =. 1978 , pages =. doi:10.1007/BF00157268 , abstract =
-
[8]
Living Reviews in Solar Physics , keywords =
Dynamo models of the solar cycle , volume =. Living Rev Sol Phys , author =. 2020 , pages =. doi:10.1007/s41116-020-00025-6 , language =
-
[9]
Predicting the. ApJL , author =. 2024 , pages =. doi:10.3847/2041-8213/ad20d2 , abstract =
-
[10]
A. ApJ , author =. 2009 , pages =. doi:10.1088/0004-637X/699/1/871 , language =
-
[11]
High-. Solar Physics , author =. 2017 , pages =. doi:10.1007/s11207-016-1034-7 , abstract =
-
[12]
Solar Polar Magnetic Fields: Comparing Full-disk and High-resolution Spectromagnetograph Data , volume =. ApJ , author =. 2022 , pages =. doi:10.3847/1538-4357/aca1a8 , abstract =
-
[13]
2010, Living Reviews in Solar Physics, 7, 3, doi: 10.12942/lrsp-2010-3
Charbonneau, Paul , Title =. LIVING REVIEWS IN SOLAR PHYSICS , Year =. doi:10.12942/lrsp-2010-3 , Article-Number =
-
[14]
Lites, Bruce W. and Elmore, David F. and Streander, Kim V. and Akin, David L. and Berger, Tom and Duncan, Dexter W. and Edwards, Chris G. and Francis, Barbara and Hoffmann, Chris and Katz, Noah and Levay, Michael and Mathur, Dnyanesh and Rosenberg, William J. and Sleight, Ericka and Tarbell, Theodore D. and Title, Alan M. and Torgerson, Darrel , editor =....
-
[15]
Long-term. Res. Astron. Astrophys. , author =. 2024 , pages =. doi:10.1088/1674-4527/ad539a , abstract =
-
[16]
Astronomy & Astrophysics , author =
Solar cycle 24:. Astronomy & Astrophysics , author =. 2018 , pages =. doi:10.1051/0004-6361/201832981 , abstract =
-
[17]
Meridional Flow in the Solar Polar Caps Revealed by Magnetic Field Observation and Simulation , volume =. ApJ , author =. 2024 , pages =. doi:10.3847/1538-4357/ad61e2 , language =
-
[18]
The. Sol Phys , author =. 2008 , pages =. doi:10.1007/s11207-008-9174-z , language =
-
[19]
Astrophysical Journal , author =
The. Astrophysical Journal , author =. 2008 , pages =. doi:10.1086/592226 , abstract =
-
[20]
The solar origin of long‐term variations of the interplanetary magnetic field strength , volume =. J. Geophys. Res. , author =. 1988 , pages =. doi:10.1029/JA093iA10p11227 , abstract =
-
[21]
ApJ , author =. 2010 , pages =. doi:10.1088/0004-637X/719/1/131 , abstract =
-
[22]
The Astrophysical Journal , author =
Quiet-. The Astrophysical Journal , author =. 2007 , pages =. doi:10.1086/524139 , abstract =
-
[23]
Comparison of. Sol Phys , author =. 2025 , pages =. doi:10.1007/s11207-025-02487-z , abstract =
-
[24]
T., Liu, Y., Hayashi, K., et al
The. Sol Phys , author =. 2014 , pages =. doi:10.1007/s11207-014-0516-8 , abstract =
-
[25]
Surface. Space Sci Rev , author =. 2023 , pages =. doi:10.1007/s11214-023-00978-8 , abstract =
-
[26]
Living Rev Sol Phys , author =
Solar cycle prediction , volume =. Living Rev Sol Phys , author =. 2020 , pages =. doi:10.1007/s41116-020-0022-z , abstract =
-
[27]
Solar. Living Rev. Sol. Phys. , author =. 2015 , pages =. doi:10.1007/lrsp-2015-5 , abstract =
-
[28]
Variations of the. ApJ , author =. 2025 , pages =. doi:10.3847/1538-4357/ae0b61 , abstract =
-
[29]
ApJL , author =. 2016 , pages =. doi:10.3847/2041-8205/823/1/L15 , abstract =
-
[30]
The. Sol Phys , author =. 2012 , pages =. doi:10.1007/s11207-011-9841-3 , abstract =
-
[31]
MmSAI , author =
A suite of community tools for spectro-polarimetric analysis , volume =. MmSAI , author =. 2007 , pages =
2007
-
[32]
A new method for resolving the 180° ambiguity in solar vector magnetograms , volume =. SOLAR PHYSICS , author =. 2003 , note =. doi:10.1023/A:1027365413021 , abstract =
-
[33]
Revision of the. Space Weather , author =. 2015 , pages =. doi:10.1002/2015SW001264 , language =
-
[34]
Science in China Series A: Mathematics , author =
Vector magnetic field in solar polar region , volume =. Science in China Series A: Mathematics , author =. 1999 , pages =. doi:10.1007/BF02889512 , abstract =
-
[35]
Solar surface velocity fields determined from small magnetic features , volume =. Solar Physics , author =. 1990 , pages =. doi:10.1007/BF00156795 , abstract =
-
[36]
Can. Space Sci Rev , author =. 2013 , pages =. doi:10.1007/s11214-011-9783-y , abstract =
-
[37]
2024b, ApJL, 976, L12, doi: 10.3847/2041-8213/ad8914
Magnetic. ApJL , author =. 2024 , pages =. doi:10.3847/2041-8213/ad8914 , abstract =
-
[38]
Flux. Space Sci Rev , author =. 2014 , pages =. doi:10.1007/s11214-014-0099-6 , language =
-
[39]
Magnetic. Space Sci Rev , author =. 2014 , pages =. doi:10.1007/s11214-014-0083-1 , language =
-
[40]
Transport of. ApJ , author =. 1964 , pages =. doi:10.1086/148058 , language =
-
[41]
Solar. Solar Physics , author =. 2026 , pages =. doi:10.1007/s11207-026-02627-z , abstract =
-
[42]
High-resolution observations of the polar magnetic fields of the sun , volume =. Sol Phys , author =. 1994 , pages =. doi:10.1007/BF00680594 , abstract =
-
[43]
On. Sol Phys , author =. 2019 , pages =. doi:10.1007/s11207-019-1520-9 , abstract =
-
[44]
ApJ , author =. 2015 , pages =. doi:10.1088/0004-637X/798/2/114 , abstract =
-
[45]
Polar. Sol Phys , author =. 2023 , pages =. doi:10.1007/s11207-023-02134-5 , language =
-
[46]
Recalibration of the. Sol Phys , author =. 2023 , pages =. doi:10.1007/s11207-023-02136-3 , language =
-
[47]
Motions, fields, and flares in the 1989. ApJ , author =. 1991 , pages =. doi:10.1086/170584 , abstract =
-
[48]
ApJL , author =. 2016 , pages =. doi:10.3847/2041-8205/823/2/L22 , abstract =
-
[49]
The. ApJ , author =. 2021 , pages =. doi:10.3847/1538-4357/abdbb4 , abstract =
-
[50]
The. Solar Physics , author =. 2013 , pages =. doi:10.1007/s11207-012-0206-3 , abstract =
-
[51]
The. Sol Phys , author =. 2013 , pages =. doi:10.1007/s11207-012-0205-4 , abstract =
-
[52]
The. Solar Physics , author =. 2012 , pages =. doi:10.1007/s11207-011-9834-2 , abstract =
-
[53]
Design and. Solar Physics , author =. 2012 , pages =. doi:10.1007/s11207-011-9842-2 , language =
-
[54]
The Astrophysical Journal , author =
Magnetic. The Astrophysical Journal , author =. 1998 , pages =. doi:10.1086/305823 , abstract =
-
[55]
Vector. Solar Physics , author =. 2017 , pages =. doi:10.1007/s11207-017-1056-9 , abstract =
-
[56]
Space Science Reviews , author =
Surface. Space Science Reviews , author =. 2017 , pages =. doi:10.1007/s11214-016-0257-0 , abstract =
-
[57]
The Astrophysical Journal Letters , author =
The. The Astrophysical Journal Letters , author =. 2025 , pages =. doi:10.3847/2041-8213/ae2850 , abstract =
-
[58]
Comparison of. Solar Physics , author =. 2012 , pages =. doi:10.1007/s11207-012-9976-x , abstract =
-
[59]
Duration of. Solar Physics , author =. 2003 , pages =. doi:10.1023/A:1024003708284 , language =
-
[60]
Bulletin of the Astronomical Society of India , keywords =
On the epochs of polarity reversals of the polar magnetic field of the sun during 1870-1982. Bulletin of the Astronomical Society of India , keywords =
1982
discussion (0)
Sign in with ORCID, Apple, or X to comment. Anyone can read and Pith papers without signing in.