Towards Fair Comparisons of AI- and Physics-Based Weather Models for Extreme Events via the Weighted Potential CRPS
Pith reviewed 2026-06-26 12:58 UTC · model grok-4.3
The pith
AI weather prediction models issue more informative forecasts for extreme events than numerical weather prediction models after IDR post-processing and weighted potential CRPS scoring.
A machine-rendered reading of the paper's core claim, the machinery that carries it, and where it could break.
Core claim
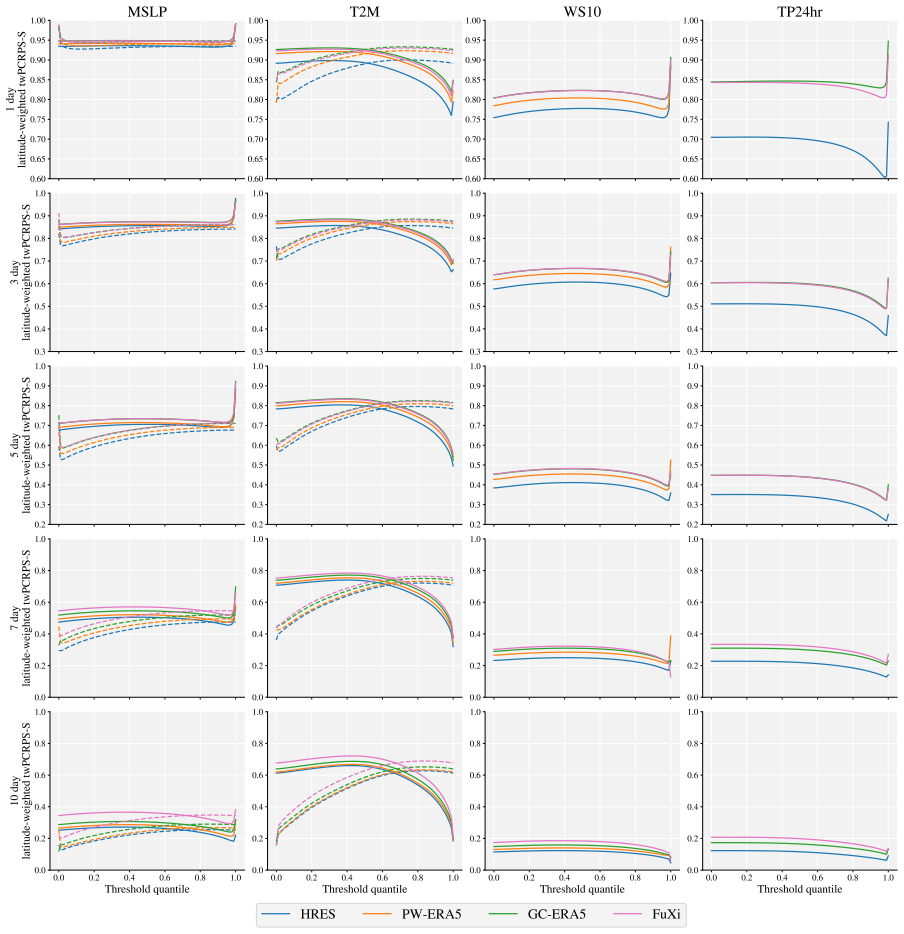
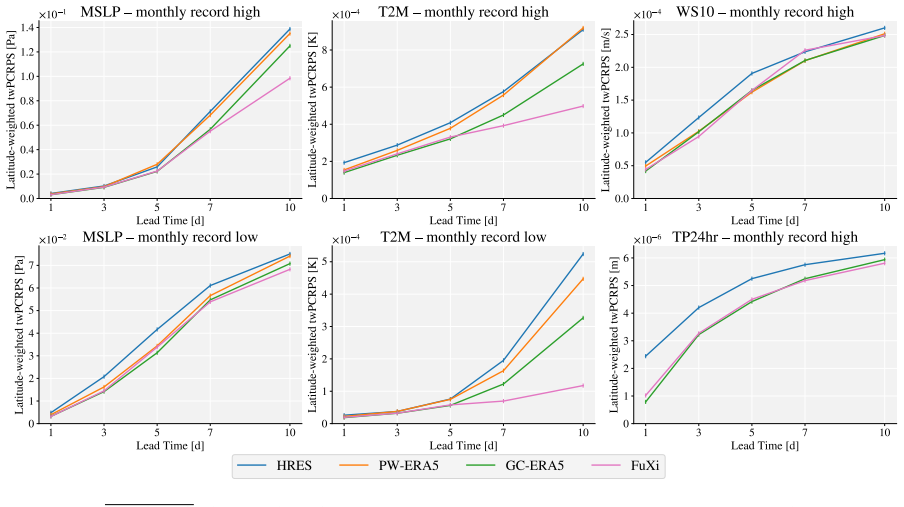
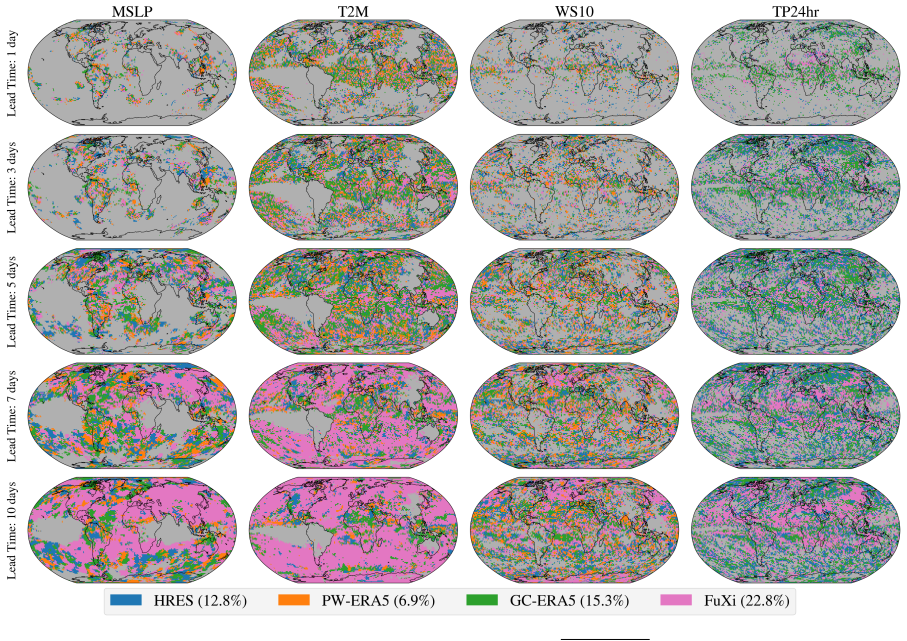
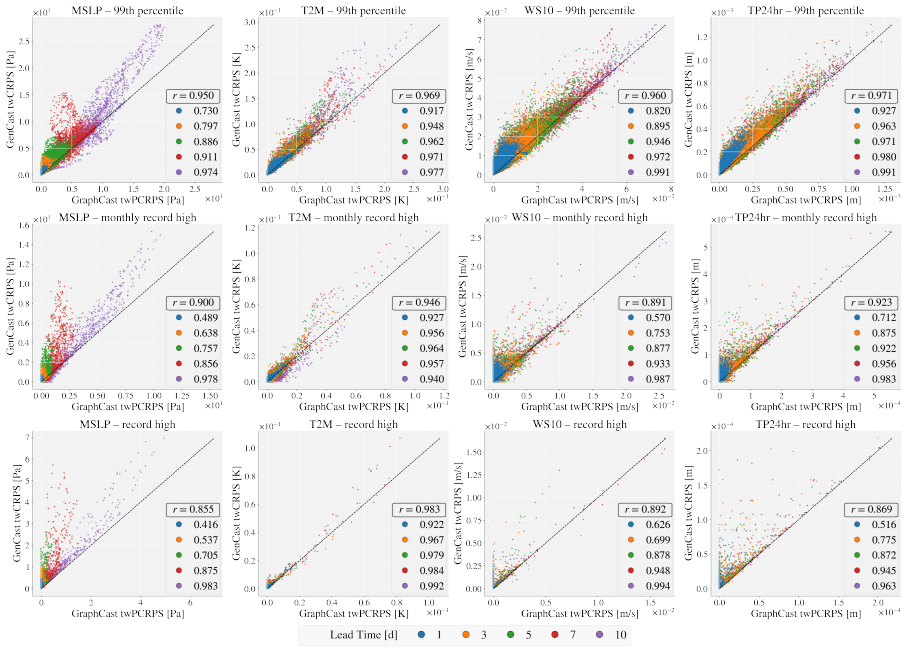
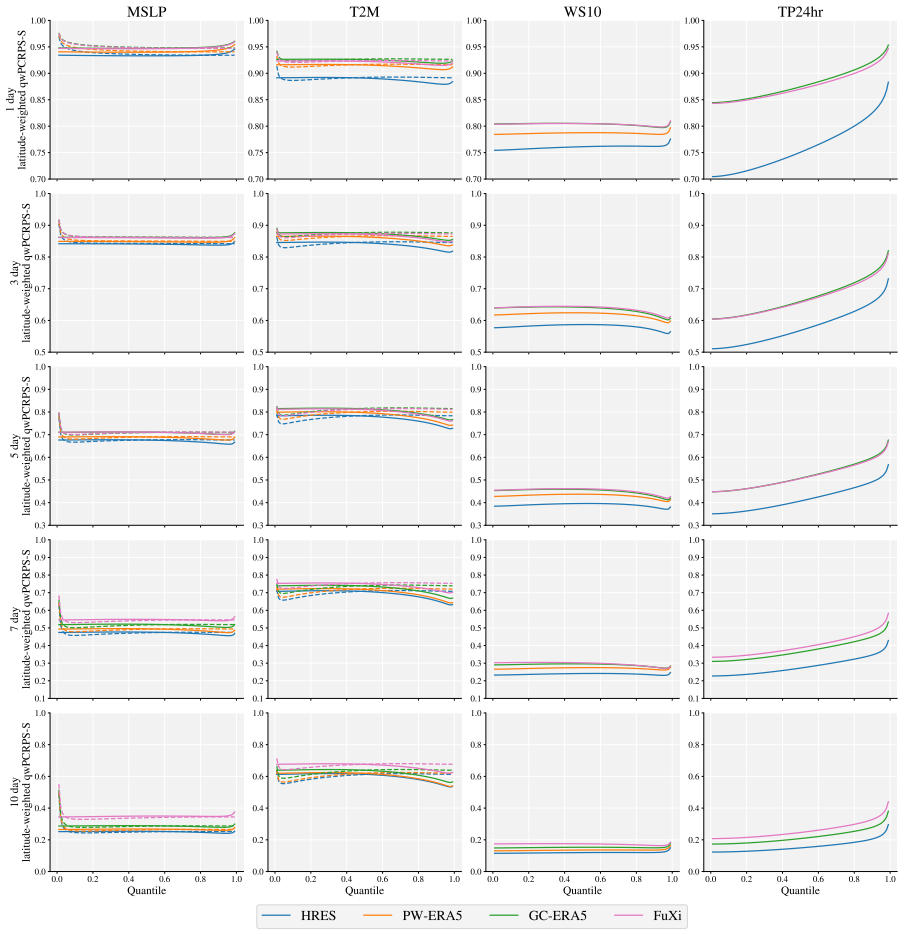
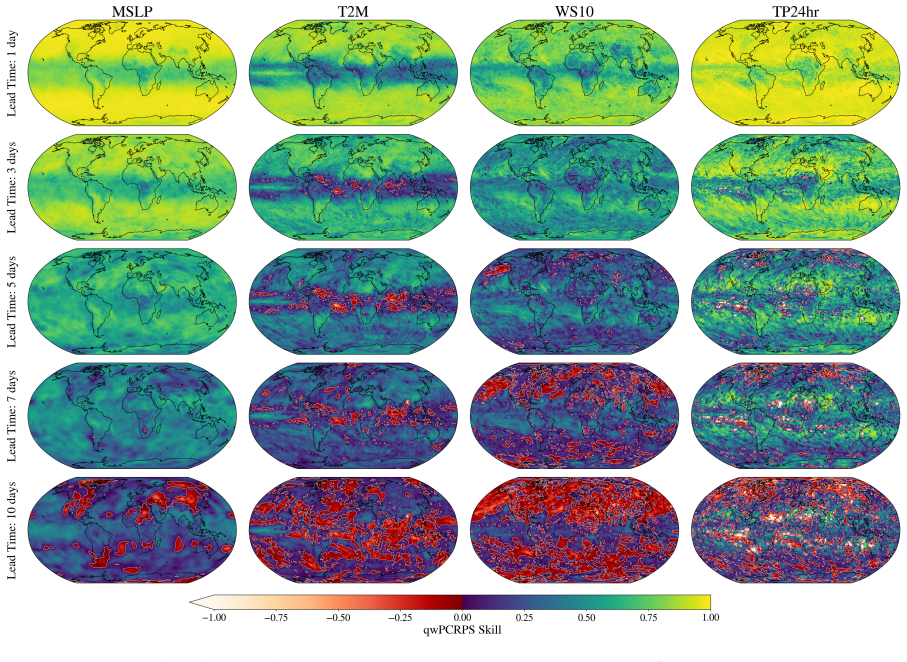
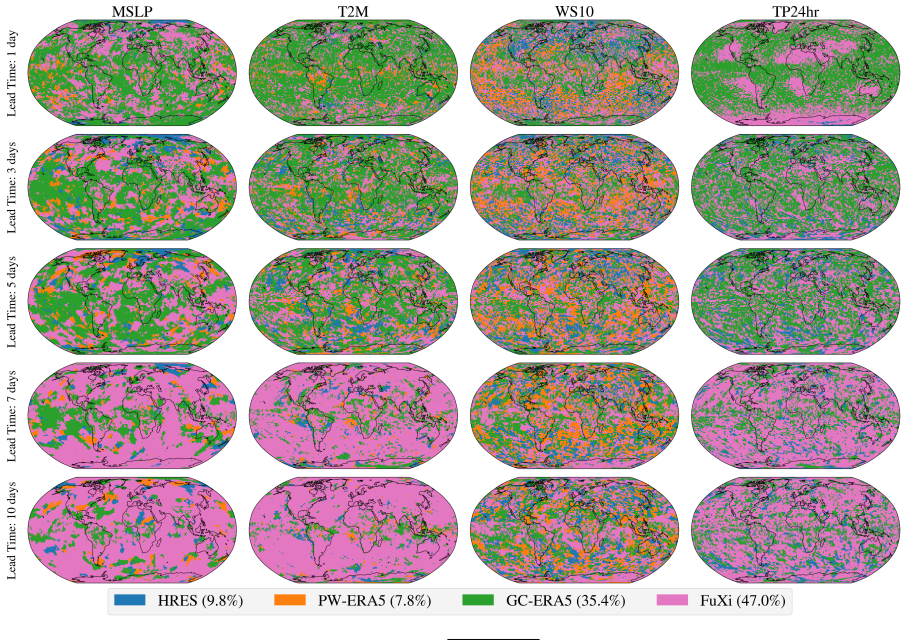
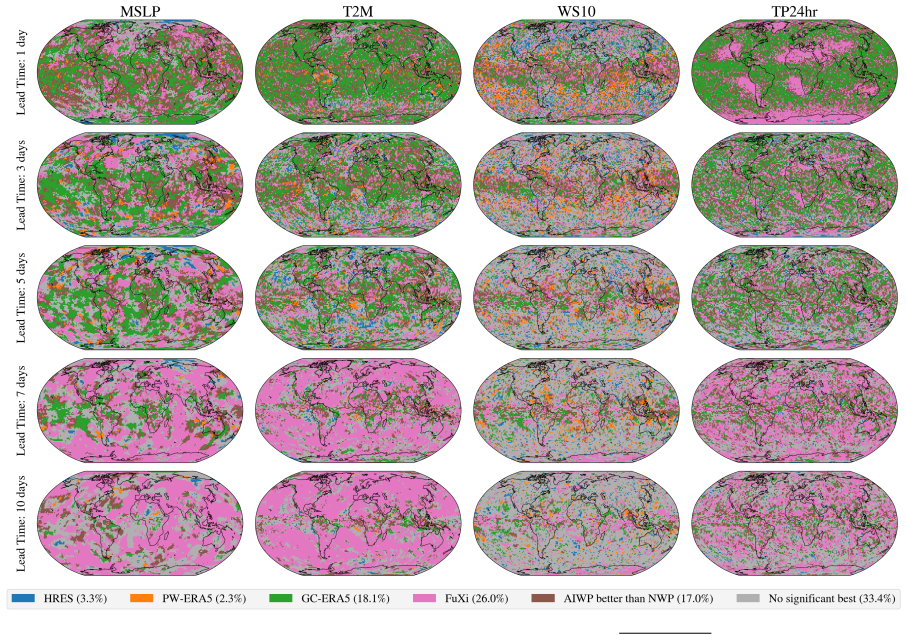
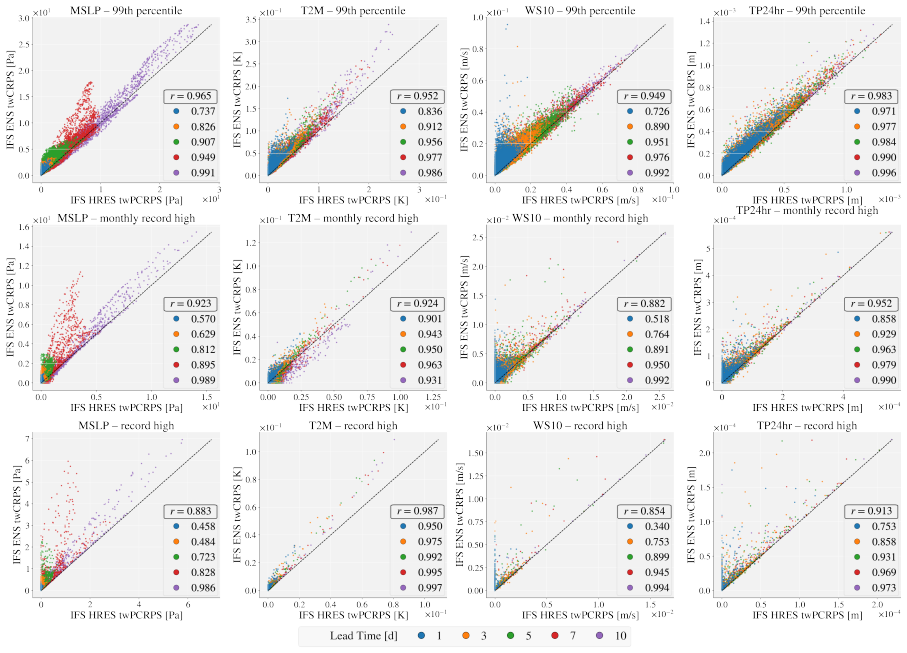
When deterministic forecasts are post-processed via isotonic distributional regression and assessed using weighted potential CRPS focused on thresholds from historical data, the AIWP models GraphCast, Pangu-Weather, and particularly FuXi produce more informative probabilistic forecasts for extreme events than the ECMWF high-resolution NWP model across most variables and settings.
What carries the argument
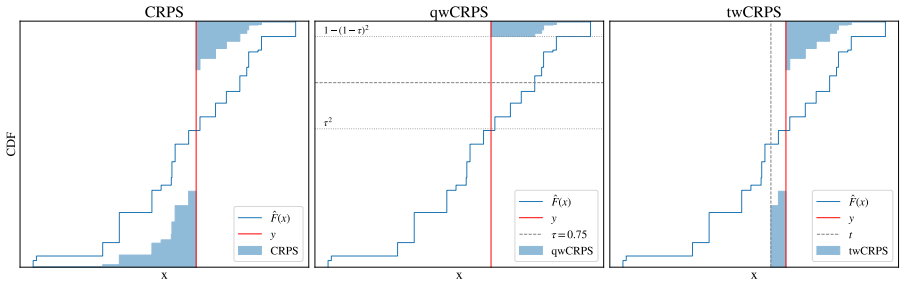
The weighted Potential CRPS obtained after isotonic distributional regression post-processing of deterministic outputs, which evaluates forecast quality with emphasis on extreme exceedances or non-exceedances.
If this is right
- AIWP models have the potential to outperform NWP models when forecasting extremes.
- The relative ordering of the models is largely insensitive to the choice of extreme thresholds.
- The evaluation framework supports fair comparisons between data-driven and physics-based models for extreme weather events.
- Forecast performance is compared across mean sea level pressure, temperature, wind speed, and precipitation extremes defined from historical observations.
Where Pith is reading between the lines
- The method could be extended to test performance on additional variables or geographic regions not covered in WeatherBench 2.
- If the advantage persists at longer lead times, it would support greater reliance on AIWP outputs for early warning systems focused on extremes.
- Hybrid models combining AI and physics components might be evaluated under the same weighted scoring to identify complementary strengths.
Load-bearing premise
That isotonic distributional regression post-processing combined with weighted potential CRPS scoring produces sufficiently unbiased comparisons between AI and physics-based models to eliminate residual effects from differences in architecture or training data.
What would settle it
A reversal in performance ranking where NWP models score higher than AIWP models on the same weighted potential CRPS when using an alternative post-processing method or direct probabilistic outputs.
Figures


read the original abstract
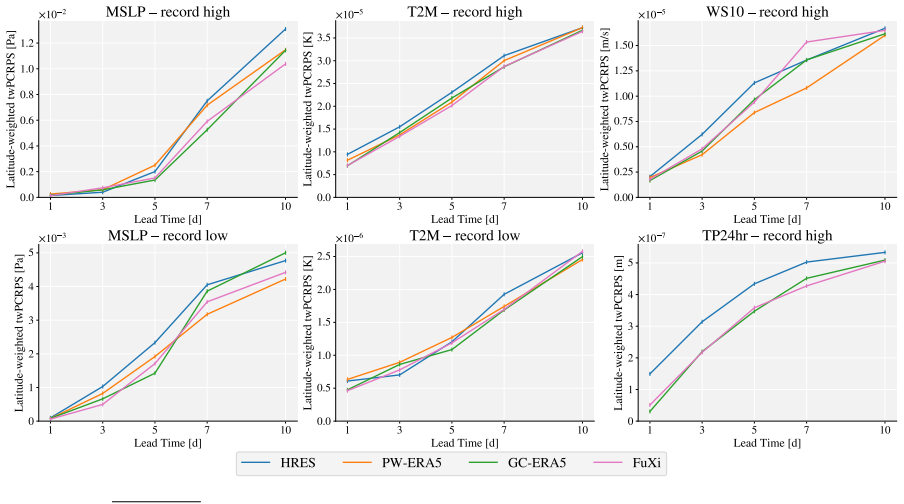
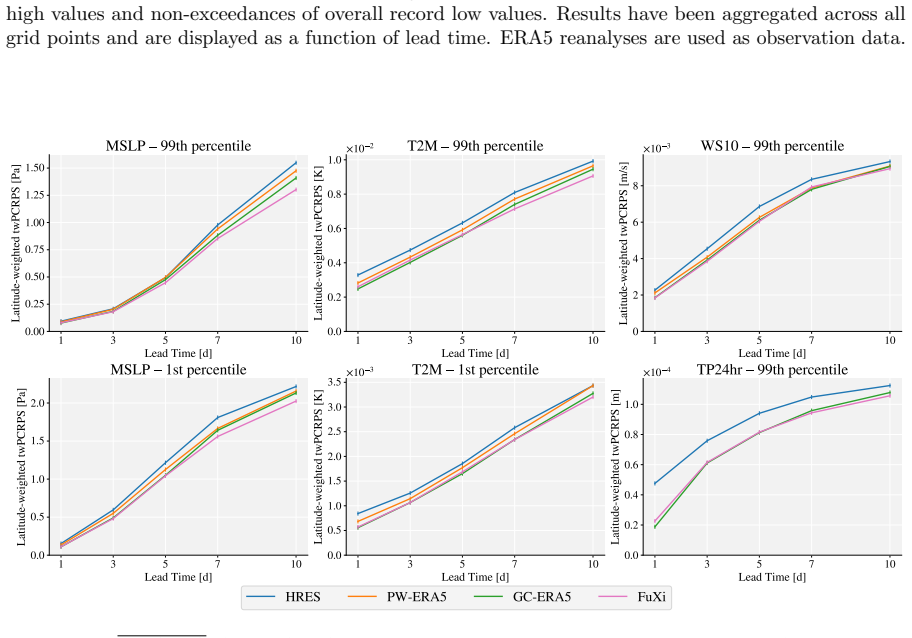
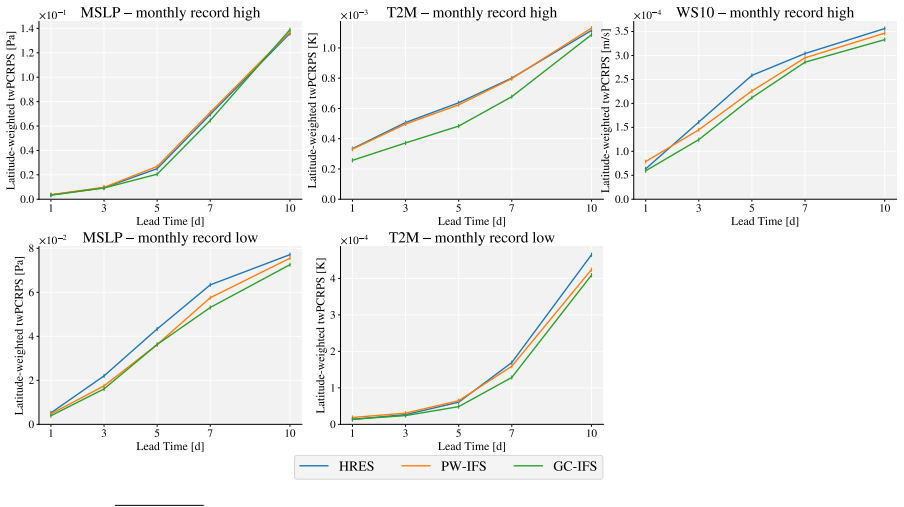
We study whether deterministic AI weather prediction (AIWP) models issue more informative forecasts for extreme weather events than deterministic numerical weather prediction (NWP) models. The deterministic model output is subjected to statistical post-processing via isotonic distributional regression (IDR), or EasyUQ, before the resulting probabilistic forecasts are assessed using weighted versions of the continuous ranked probability score (CRPS). This extends the Potential CRPS (PCRPS) measure proposed by Gneiting et al. (2026) to focus on extreme outcomes. Since IDR exhibits optimality properties with respect to weighted versions of the CRPS, the proposed approach inherits desirable properties of the PCRPS, and, in particular, facilitates fair comparisons between data-driven and physics-based models when forecasting extreme weather events. We apply this evaluation framework to forecasts in the WeatherBench 2 dataset issued by the AIWP models GraphCast, Pangu-Weather, and FuXi, with the ECMWF's high-resolution NWP model serving as a physics-based reference. The forecast models are compared when predicting mean sea level pressure, temperature, wind speed, and precipitation extremes, defined as exceedances or non-exceedances of thresholds obtained from historical observation data. We additionally study forecast performance when predicting record-breaking events, though the ordering of the different methods is largely insensitive to the thresholds on which emphasis is placed. We find that AIWP models, particularly FuXi, result in the most informative forecasts for extreme weather events across most settings, suggesting that AIWP models have the potential to outperform NWP models when forecasting extremes.
Editorial analysis
A structured set of objections, weighed in public.
Referee Report
Summary. The manuscript proposes using isotonic distributional regression (IDR/EasyUQ) to convert deterministic outputs from AIWP models (GraphCast, Pangu-Weather, FuXi) and an NWP reference (ECMWF) into probabilistic forecasts, then scoring them with weighted potential CRPS (PCRPS) focused on extremes defined via historical thresholds. It concludes that AIWP models, particularly FuXi, yield more informative forecasts than NWP for extremes in mean sea level pressure, temperature, wind speed, and precipitation, with the ordering largely insensitive to threshold choice.
Significance. If the fairness and optimality claims hold, the work supplies a practical framework for head-to-head evaluation of data-driven versus physics-based models on tail events and supplies evidence that AIWP can outperform NWP on extremes, which would be relevant for operational forecasting and model development.
major comments (3)
- [Abstract] Abstract: the statement that IDR optimality with respect to weighted CRPS 'facilitates fair comparisons' between AIWP and NWP is asserted without any quantitative verification or diagnostic that the post-processed distributions remove model-class-specific tail biases; the central claim therefore rests on an untested transfer of the cited property.
- [Abstract] Abstract and Results: the claim that 'the ordering of the different methods is largely insensitive to the thresholds' is presented without accompanying sensitivity tables, plots, or quantitative measures of rank stability across threshold choices; likewise, the procedure for selecting thresholds from historical data is not detailed enough to allow replication or robustness checks.
- [Methods] Methods: while IDR is optimal for the weighted CRPS on a given set of forecast-observation pairs, no analysis is supplied to confirm that the resulting probabilistic forecasts equalize the comparison when the underlying deterministic models have different error structures or training distributions (especially for precipitation and wind speed); this leaves open the possibility that residual architecture-specific biases remain in the tails.
minor comments (1)
- [Abstract] Abstract: the citation 'Gneiting et al. (2026)' should be checked for the correct year.
Simulated Author's Rebuttal
We thank the referee for their detailed and constructive report. The comments identify areas where additional clarification and supporting material would strengthen the presentation of our framework. We address each major comment below and indicate the revisions we will make.
read point-by-point responses
-
Referee: [Abstract] Abstract: the statement that IDR optimality with respect to weighted CRPS 'facilitates fair comparisons' between AIWP and NWP is asserted without any quantitative verification or diagnostic that the post-processed distributions remove model-class-specific tail biases; the central claim therefore rests on an untested transfer of the cited property.
Authors: The optimality of IDR for weighted CRPS is a general theoretical result (see the cited IDR and proper scoring rule literature) that holds for any deterministic input once the isotonic regression is fitted to the same observations. Because the post-processing step is applied independently to each model using identical training data and the same proper scoring rule, the comparison is fair by construction: each model receives its own optimal probabilistic representation under the chosen score. We acknowledge, however, that the manuscript does not include explicit empirical diagnostics (e.g., tail-quantile plots or bias comparisons) demonstrating the removal of architecture-specific tail biases. In the revised version we will add a short appendix with representative post-processed CDFs and quantile-quantile diagnostics for the four variables, allowing readers to inspect the tail adjustments directly. revision: yes
-
Referee: [Abstract] Abstract and Results: the claim that 'the ordering of the different methods is largely insensitive to the thresholds' is presented without accompanying sensitivity tables, plots, or quantitative measures of rank stability across threshold choices; likewise, the procedure for selecting thresholds from historical data is not detailed enough to allow replication or robustness checks.
Authors: We agree that both the threshold-selection procedure and the supporting evidence for rank stability require more detail. Thresholds are defined as the empirical quantiles (e.g., 0.95, 0.99, 0.995) of the historical observation record in the training period for each variable and location; the exact quantiles and the number of events retained will be stated explicitly in the Methods section. To quantify the claimed insensitivity, we will add a supplementary table reporting model ranks for a grid of thresholds together with a simple stability metric (e.g., the fraction of threshold choices that preserve the overall ordering). These additions will also be referenced in the abstract and Results. revision: yes
-
Referee: [Methods] Methods: while IDR is optimal for the weighted CRPS on a given set of forecast-observation pairs, no analysis is supplied to confirm that the resulting probabilistic forecasts equalize the comparison when the underlying deterministic models have different error structures or training distributions (especially for precipitation and wind speed); this leaves open the possibility that residual architecture-specific biases remain in the tails.
Authors: The referee correctly observes that the manuscript relies on the theoretical optimality property without additional empirical checks for residual biases arising from differing error structures. While the optimality guarantee is model-agnostic once the forecasts and observations are fixed, we accept that readers may wish to see evidence that architecture-specific tail discrepancies are adequately corrected, particularly for precipitation and wind speed. In revision we will expand the Methods discussion to note this assumption explicitly and will include a brief comparison of raw deterministic error distributions versus the post-processed tails for the two most challenging variables. If space allows, we will also add a short paragraph in the Discussion acknowledging that complete equalization cannot be guaranteed without further model-specific diagnostics. revision: partial
Circularity Check
No significant circularity; derivation relies on externally cited optimality properties.
full rationale
The paper's key claim that IDR post-processing enables fair comparisons rests on optimality properties of IDR w.r.t. weighted CRPS, which are explicitly cited from prior work rather than derived or fitted within this manuscript. The extension of PCRPS to weighted versions for extremes is presented as inheriting those properties without any of the present equations reducing the fairness result to a self-defined quantity, a fitted input renamed as prediction, or a self-citation chain. The comparison framework between AIWP and NWP models therefore remains self-contained against external benchmarks, with no load-bearing steps that collapse by construction.
Axiom & Free-Parameter Ledger
axioms (1)
- domain assumption IDR is optimal for weighted versions of the CRPS
Reference graph
Works this paper leans on
-
[1]
SIAM/ASA Journal on Uncertainty Quantification , volume=
Evaluating forecasts for high-impact events using transformed kernel scores , author=. SIAM/ASA Journal on Uncertainty Quantification , volume=. 2023 , publisher=
2023
-
[2]
Weather and Forecasting , volume=
Weighted verification tools to evaluate univariate and multivariate probabilistic forecasts for high-impact weather events , author=. Weather and Forecasting , volume=
-
[3]
arXiv preprint arXiv:2511.17176 , year=
On the Predictive Skill of Artificial Intelligence-based Weather Models for Extreme Events using Uncertainty Quantification , author=. arXiv preprint arXiv:2511.17176 , year=
-
[4]
Electronic Journal of Statistics , volume=
Decompositions of the mean continuous ranked probability score , author=. Electronic Journal of Statistics , volume=. 2024 , publisher=
2024
-
[5]
Nature , volume=
The quiet revolution of numerical weather prediction , author=. Nature , volume=. 2015 , publisher=
2015
-
[6]
Advances in Statistical Climatology, Meteorology and Oceanography , volume=
Forecast score distributions with imperfect observations , author=. Advances in Statistical Climatology, Meteorology and Oceanography , volume=. 2021 , publisher=
2021
-
[7]
Bi, Kaifeng and Xie, Lingxi and Zhang, Hengheng and Chen, Xin and Gu, Xiaotao and Tian, Qi , year = 2023, month = jul, journal =. Accurate Medium-Range Global Weather Forecasting with. doi:10.1038/s41586-023-06185-3 , urldate =
-
[8]
FourCastNet 3: A geometric approach to probabilistic machine-learning weather forecasting at scale
Bonev, Boris and Kurth, Thorsten and Mahesh, Ankur and Bisson, Mauro and Kossaifi, Jean and Kashinath, Karthik and Anandkumar, Anima and Collins, William D and Pritchard, Michael S and Keller, Alexander , journal=. FourCastNet 3: A geometric approach to probabilistic machine-learning weather forecasting at scale
-
[9]
A practical probabilistic benchmark for AI weather models
Brenowitz, Noah D and Cohen, Yair and Pathak, Jaideep and Mahesh, Ankur and Bonev, Boris and Kurth, Thorsten and Durran, Dale R and Harrington, Peter and Pritchard, Michael S , journal=. A practical probabilistic benchmark for AI weather models. 2025 , publisher=
2025
-
[10]
Monthly Weather Review , volume=
Verification of forecasts expressed in terms of probability , author=. Monthly Weather Review , volume=. 1950 , publisher=
1950
-
[11]
doi:10.1038/s41612-023-00512-1 , urldate =
Chen, Lei and Zhong, Xiaohui and Zhang, Feng and Cheng, Yuan and Xu, Yinghui and Qi, Yuan and Li, Hao , year = 2023, month = nov, journal =. doi:10.1038/s41612-023-00512-1 , urldate =
-
[12]
Journal of Econometrics , volume=
Likelihood-based scoring rules for comparing density forecasts in tails , author=. Journal of Econometrics , volume=. 2011 , publisher=
2011
-
[13]
Turning Up the Heat: Assessing 2-m Temperature Forecast Errors in
Ennis, Kelsey E and Barnes, Elizabeth A and Arcodia, Marybeth C and Fernandez, Martin A and Maloney, Eric D , journal=. Turning Up the Heat: Assessing 2-m Temperature Forecast Errors in
-
[14]
Quarterly Journal of the Royal Meteorological Society , volume=
Measuring forecast performance in the presence of observation error , author=. Quarterly Journal of the Royal Meteorological Society , volume=. 2017 , publisher=
2017
-
[15]
Glasser, Gerald J. , year = 1962, journal =. Variance. doi:10.2307/2282402 , urldate =. 2282402 , eprinttype =
-
[16]
Journal of the American statistical Association , volume=
Strictly proper scoring rules, prediction, and estimation , author=. Journal of the American statistical Association , volume=. 2007 , publisher=
2007
-
[17]
Journal of the American Statistical Association , volume=
Making and evaluating point forecasts , author=. Journal of the American Statistical Association , volume=. 2011 , publisher=
2011
-
[18]
Comparing Density Forecasts Using Threshold- and Quantile-Weighted Scoring Rules , author =. Journal of Business & Economic Statistics , volume =. doi:10.1198/jbes.2010.08110 , urldate =
-
[19]
Probabilistic measures afford fair comparisons of
Gneiting, Tilmann and Biegert, Tobias and Kraus, Kristof and Walz, Eva-Maria and Jordan, Alexander I and Lerch, Sebastian , journal=. Probabilistic measures afford fair comparisons of. 2026 , publisher=
2026
-
[20]
Quarterly Journal of the Royal Meteorological Society , volume=
The continuous ranked probability score for circular variables and its application to mesoscale forecast ensemble verification , author=. Quarterly Journal of the Royal Meteorological Society , volume=. 2006 , publisher=
2006
-
[21]
Journal of the Royal Statistical Society Series B: Statistical Methodology , volume=
Isotonic distributional regression , author=. Journal of the Royal Statistical Society Series B: Statistical Methodology , volume=. 2021 , publisher=
2021
-
[22]
Hersbach, Hans and Bell, Bill and Berrisford, Paul and Hirahara, Shoji and Hor. The. Quarterly Journal of the Royal Meteorological Society , volume =. doi:10.1002/qj.3803 , urldate =
-
[23]
Annals of Applied Statistics , volume=
FOCUSING ON REGIONS OF INTEREST IN FORECAST EVALUATION , author=. Annals of Applied Statistics , volume=
-
[24]
2016 , school=
Facets of forecast evaluation , author=. 2016 , school=
2016
-
[25]
Hydrology and Earth System Sciences , volume=
Verification tools for probabilistic forecasts of continuous hydrological variables , author=. Hydrology and Earth System Sciences , volume=. 2007 , publisher=
2007
-
[26]
Science, 382 (6677), 1416--1421, doi:10.1126/science.adi2336
Learning Skillful Medium-Range Global Weather Forecasting , author =. Science , volume =. doi:10.1126/science.adi2336 , urldate =
-
[27]
Lang, Simon and Alexe, Mihai and Chantry, Matthew and Dramsch, Jesper and Pinault, Florian and Raoult, Baudouin and Clare, Mariana CA and Lessig, Christian and Maier-Gerber, Michael and Magnusson, Linus and others , journal=
-
[28]
AIFS-CRPS: Ensemble forecasting using a model trained with a loss function based on the continuous ranked probability score
Lang, Simon and Alexe, Mihai and Clare, Mariana CA and Roberts, Christopher and Adewoyin, Rilwan and Ben Bouall. AIFS-CRPS: Ensemble forecasting using a model trained with a loss function based on the continuous ranked probability score. npj Artificial Intelligence , volume=. 2026 , publisher=
2026
-
[29]
and Ravazzolo, Francesco and Gneiting, Tilmann , year = 2017, journal =
Lerch, Sebastian and Thorarinsdottir, Thordis L. and Ravazzolo, Francesco and Gneiting, Tilmann , year = 2017, journal =. Forecaster's Dilemma: Extreme Events and Forecast Evaluation , shorttitle =. 26408123 , eprinttype =
2017
-
[30]
Evaluating Extreme Precipitation Forecasts: A Threshold-Weighted, Spatial Verification Approach for Comparing an
Loveday, Nicholas and Hertneky, Tracy , journal=. Evaluating Extreme Precipitation Forecasts: A Threshold-Weighted, Spatial Verification Approach for Comparing an
-
[31]
Management Science , volume=
Scoring rules for continuous probability distributions , author=. Management Science , volume=. 1976 , publisher=
1976
-
[32]
Reviews of geophysics , volume=
Impact forecasting to support emergency management of natural hazards , author=. Reviews of geophysics , volume=. 2020 , publisher=
2020
-
[33]
Do Data-Driven Models Beat Numerical Models in Forecasting Weather Extremes?
Olivetti, Leonardo and Messori, Gabriele , year = 2024, month = nov, journal =. Do Data-Driven Models Beat Numerical Models in Forecasting Weather Extremes?. doi:10.5194/gmd-17-7915-2024 , urldate =
-
[34]
FourCastNet: A global data-driven high-resolution weather model using adaptive fourier neural operators
Pathak, Jaideep and Subramanian, Shashank and Harrington, Peter and Raja, Sanjeev and Chattopadhyay, Ashesh and Mardani, Morteza and Kurth, Thorsten and Hall, David and Li, Zongyi and Azizzadenesheli, Kamyar and others , journal=. FourCastNet: A global data-driven high-resolution weather model using adaptive fourier neural operators
-
[35]
URL https://doi.org/10.1038/s41586-024-08252-9
Probabilistic Weather Forecasting with Machine Learning , author =. Nature , volume =. doi:10.1038/s41586-024-08252-9 , urldate =
-
[36]
2020 , publisher=
Rasp, Stephan and Dueben, Peter D and Scher, Sebastian and Weyn, Jonathan A and Mouatadid, Soukayna and Thuerey, Nils , journal=. 2020 , publisher=
2020
-
[37]
Stephan Rasp, Stephan Hoyer, Aravind Merose, Johannes Langguth, Sebastian Deiser, et al
Rasp, Stephan and Hoyer, Stephan and Merose, Alexander and Langmore, Ian and Battaglia, Peter and Russell, Tyler and. Journal of Advances in Modeling Earth Systems , volume =. doi:10.1029/2023MS004019 , urldate =
-
[38]
A comparison of moderate and extreme
Rivoire, Pauline and Martius, Olivia and Naveau, Philippe , journal=. A comparison of moderate and extreme. 2021 , publisher=
2021
-
[39]
Quarterly Journal of the Royal Meteorological Society , volume=
Evaluation of point forecasts for extreme events using consistent scoring functions , author=. Quarterly Journal of the Royal Meteorological Society , volume=. 2022 , publisher=
2022
-
[40]
Walz, Eva-Maria and Henzi, Alexander and Ziegel, Johanna and Gneiting, Tilmann , year = 2024, month = feb, journal =. Easy. doi:10.1137/22M1541915 , urldate =
-
[41]
Monthly Weather Review , volume =
Improving Probabilistic Forecasts of Extreme Wind Speeds by Training Statistical Postprocessing Models with Weighted Scoring Rules , author =. Monthly Weather Review , volume =. doi:10.1175/MWR-D-24-0151.1 , urldate =
-
[42]
Mathematical Geosciences , volume =
Estimation of the Continuous Ranked Probability Score with Limited Information and Applications to Ensemble Weather Forecasts , author =. Mathematical Geosciences , volume =. doi:10.1007/s11004-017-9709-7 , urldate =
-
[43]
Skilful nowcasting of extreme precipitation with
Zhang, Yuchen and Long, Mingsheng and Chen, Kaiyuan and Xing, Lanxiang and Jin, Ronghua and Jordan, Michael I and Wang, Jianmin , journal=. Skilful nowcasting of extreme precipitation with. 2023 , publisher=
2023
-
[44]
Science Advances , volume =
Zhongwei Zhang and Erich Fischer and Jakob Zscheischler and Sebastian Engelke , title =. Science Advances , volume =
-
[45]
2025 , publisher=
Zhong, Xiaohui and Chen, Lei and Li, Hao and Buizza, Roberto and Liu, Jun and Feng, Jie and Zhu, Zijian and Fan, Xu and Dai, Kan and Luo, Jing-jia and others , journal=. 2025 , publisher=
2025
-
[46]
Nature Reviews Earth & Environment , volume=
A typology of compound weather and climate events , author=. Nature Reviews Earth & Environment , volume=. 2020 , publisher=
2020
-
[47]
Uncertainty
B. Uncertainty. Artificial Intelligence for the Earth Systems , volume =
-
[48]
npj Climate and Atmospheric Science , volume =
Do. npj Climate and Atmospheric Science , volume =
-
[49]
Pasche and Jonathan Wider and Zhongwei Zhang and Jakob Zscheischler and Sebastian Engelke
Olivier C. Pasche and Jonathan Wider and Zhongwei Zhang and Jakob Zscheischler and Sebastian Engelke. Validating Deep Learning Weather Forecast Models on Recent High-Impact Extreme Events. Artificial Intelligence for the Earth Systems. 2025
2025
-
[50]
arXiv preprint arXiv:2605.01126 , year=
McGovern, Amy and Mandelbaum, Taylor and Rothenberg, Daniel and Loveday, Nicholas and Potvin, Corey and Flora, Montgomery and Magnusson, Linus and Gilleland, Eric and Allen, John , title = ". arXiv preprint arXiv:2605.01126 , year=
-
[51]
arXiv preprint arXiv:2601.18111 , year=
Demystifying Data-Driven Probabilistic Medium-Range Weather Forecasting , author=. arXiv preprint arXiv:2601.18111 , year=
-
[52]
arXiv preprint arXiv:2506.10772 , year=
Skillful joint probabilistic weather forecasting from marginals , author=. arXiv preprint arXiv:2506.10772 , year=
-
[53]
Nature , volume=
Neural general circulation models for weather and climate , author=. Nature , volume=. 2024 , publisher=
2024
discussion (0)
Sign in with ORCID, Apple, or X to comment. Anyone can read and Pith papers without signing in.