Simulating Public Transit Fare Policies in NYC: An Efficient, Socioeconomic-Aware Framework
Pith reviewed 2026-06-26 11:24 UTC · model grok-4.3
The pith
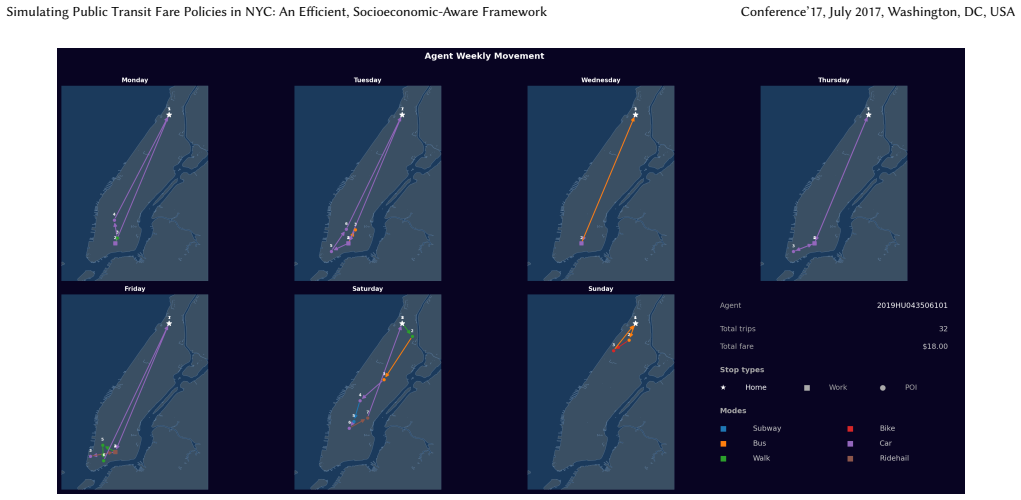
A simulation framework shows that fare-free bus policies in NYC increase bus use and cut costs for low-income riders while trading off revenue, with only modest effects on total ridership.
A machine-rendered reading of the paper's core claim, the machinery that carries it, and where it could break.
Core claim
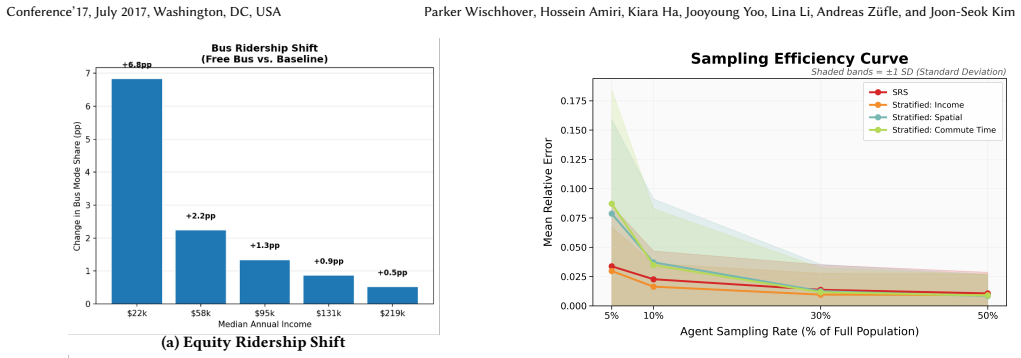
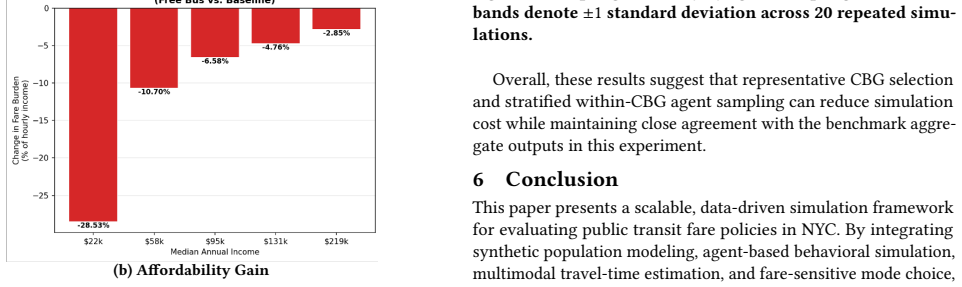
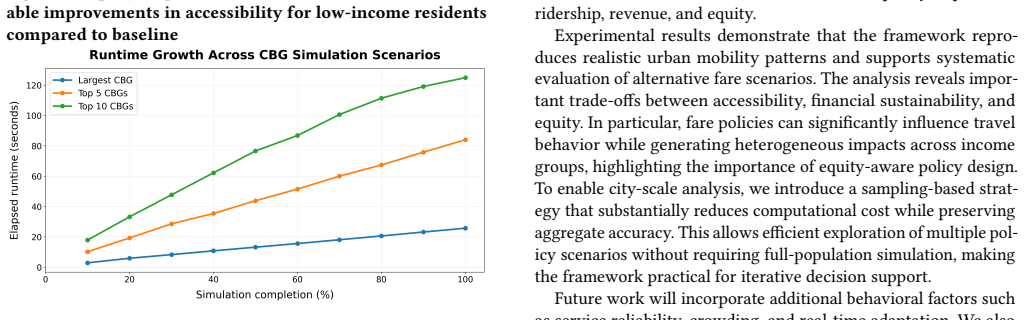
The paper claims that its integrated simulation framework, built from a synthetic population, agent-based simulation, multimodal travel-time estimation, and fare-sensitive mode choice, can evaluate transit fare policies at city scale; when applied to NYC, the framework shows that pricing changes produce only modest shifts in total ridership but substantial changes in modal composition and heterogeneous effects across income groups, with fare-free bus policies delivering clear benefits to lower-income riders through higher bus usage and reduced fare burden alongside revenue trade-offs.
What carries the argument
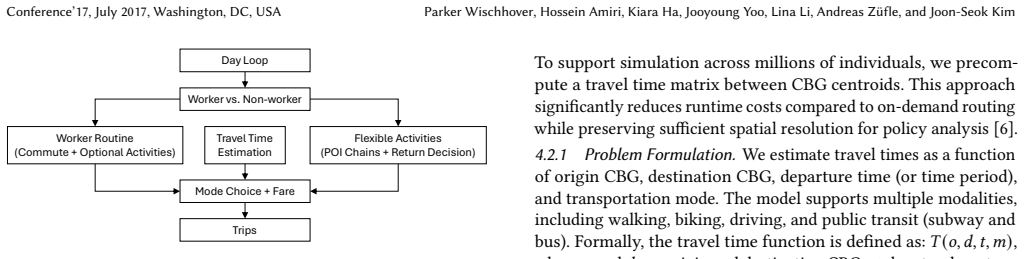
The scalable, data-driven simulation framework that combines a synthetic population, agent-based simulation, multimodal travel-time estimation, and fare-sensitive mode choice modeling, supported by a sampling approach to reduce computational cost.
If this is right
- Fare policy changes affect which modes travelers choose more than they affect overall ridership volume.
- Fare-free bus policies raise bus usage and lower costs most for lower-income groups.
- Revenue losses accompany the equity gains from fare-free buses.
- The sampling method allows repeated policy tests without full-scale computation.
- The framework supplies a tool for quantifying trade-offs among ridership, revenue, and equity.
Where Pith is reading between the lines
- Similar frameworks could be adapted to other large cities to test equity-focused policies before rollout.
- Uniform pricing across modes may systematically disadvantage lower-income riders, suggesting a need for targeted adjustments.
- Revenue shortfalls from free-bus policies might require offsetting measures such as dedicated funding streams if equity is prioritized.
- Extending the model to forecast long-term behavioral adaptation would test whether short-run modal shifts persist.
Load-bearing premise
The synthetic population, travel-time estimates, and mode-choice model together reproduce how real NYC travelers of different income levels actually respond to fare changes.
What would settle it
A real-world fare policy change whose observed income-group ridership and revenue effects differ markedly from the simulation's predictions would falsify the framework's reliability for the reported heterogeneous impacts.
Figures


read the original abstract
Designing equitable and effective public transit fare policies is challenging due to complex interactions among traveler behavior, multimodal networks, and socioeconomic heterogeneity. This paper presents a scalable, data-driven simulation framework for evaluating transit fare policies in New York City (NYC), integrating a synthetic population, agent-based simulation, multimodal travel-time estimation, and fare-sensitive mode choice modeling. We evaluate multiple fare scenarios, including distance-based pricing, fare increases, and fare-free bus policies. Results show that pricing changes modestly affect total ridership but significantly alter modal composition and produce heterogeneous impacts across income groups. In particular, fare-free bus policies generate substantial benefits for lower-income riders by increasing bus usage and reducing fare burden, while introducing trade-offs in revenue. To support city-scale analysis, we introduce a sampling-based approach that reduces computational cost while preserving aggregate accuracy. The proposed framework provides a practical tool for assessing trade-offs between ridership, revenue, and equity, enabling more informed and equitable transit policy design.
Editorial analysis
A structured set of objections, weighed in public.
Referee Report
Summary. The paper presents a scalable, data-driven simulation framework for evaluating public transit fare policies in NYC. It combines a synthetic population (from census/ACS data), agent-based simulation, multimodal travel-time estimation, and a fare-sensitive mode choice model. Multiple scenarios are evaluated, including distance-based pricing, fare increases, and fare-free bus policies. Results indicate modest effects on total ridership but significant changes in modal composition and heterogeneous impacts across income groups, with fare-free bus policies increasing bus usage and reducing fare burden for lower-income riders at the cost of revenue. A sampling-based approach is introduced to reduce computational cost while preserving aggregate accuracy.
Significance. If the reported calibration and sensitivity results hold, the framework supplies a practical, city-scale tool for assessing trade-offs among ridership, revenue, and equity in transit policy. Credit is due for the explicit calibration of the mode-choice model against observed MTA ridership statistics and for the sampling procedure that maintains aggregate fidelity within stated tolerances; these elements directly support the reliability of the income-heterogeneity claims.
minor comments (3)
- [§3] §3 (Synthetic Population): the description of how ACS and census tract data are fused into the synthetic population should include the exact matching variables and any post-stratification weights applied.
- [§4.2] §4.2 (Mode Choice Model): the calibration procedure against MTA ridership is mentioned but the goodness-of-fit metric (e.g., RMSE on boardings by route or income stratum) is not reported; adding this table would strengthen the validation claim.
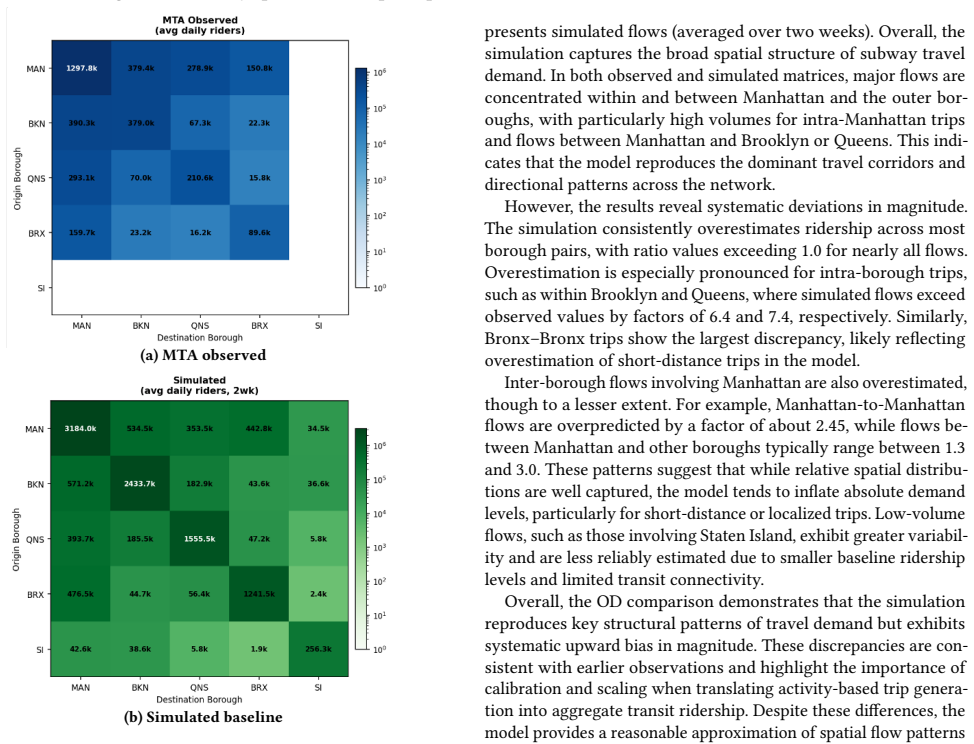
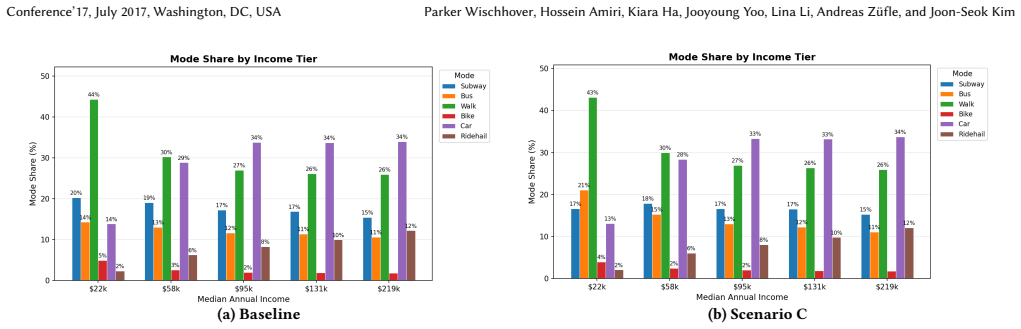
- [Figure 5] Figure 5 (Income-group impacts): axis labels and legend entries use inconsistent income brackets between the figure and the accompanying text; standardize the bracket definitions.
Simulated Author's Rebuttal
We thank the referee for their positive summary of the manuscript, recognition of the calibration and sampling contributions, and recommendation for minor revision. We are pleased that the framework is viewed as a practical city-scale tool for policy assessment.
Circularity Check
No significant circularity detected
full rationale
The paper describes a simulation framework built from external data sources (census/ACS for synthetic population, observed MTA ridership for mode-choice calibration) and applies it to generate policy scenario outputs. No load-bearing step reduces a claimed prediction or result to a fitted parameter or self-citation by construction; the sampling approach is presented as preserving aggregate statistics within tolerances rather than redefining the target quantities. The heterogeneous impact claims follow from running the calibrated model on new fare policies, with validation steps that remain independent of the specific scenario results. This is the common case of an applied simulation study whose central content is not equivalent to its inputs by definition.
Axiom & Free-Parameter Ledger
Reference graph
Works this paper leans on
-
[1]
Ittai Abraham, Daniel Delling, Andrew V Goldberg, and Renato F Werneck
-
[2]
In International Symposium on Experimental Algorithms
A hub-based labeling algorithm for shortest paths in road networks. In International Symposium on Experimental Algorithms. Springer, 230–241
-
[3]
Muhammad Adnan, Bat-hen Nahmias Biran, Vishnu Baburajan, Kakali Basak, and Moshe Ben-Akiva. 2020. Examining impacts of time-based pricing strategies in public transportation: A study of Singapore.Transportation Research Part A: Policy and Practice140 (2020), 127–141
2020
-
[4]
Advan Research. 2022. Foot Traffic / Weekly Patterns [Dataset]. Dewey Data. doi:10.82551/X1PP-1F65
-
[5]
Hossein Amiri, Joon-Seok Kim, Hamdi Kavak, Andrew Crooks, Dieter Pfoser, Carola Wenk, and Andreas Züfle. 2026. HD-GEN: A High-Performance Software Simulating Public Transit Fare Policies in NYC: An Efficient, Socioeconomic-Aware Framework Conference’17, July 2017, Washington, DC, USA System for Human Mobility Data Generation Based on Patterns of Life.arXi...
arXiv 2026
-
[6]
Hossein Amiri, Richard Yang, Shiyang Ruan, Joon-Seok Kim, Hamdi Kavak, Andrew Crooks, Dieter Pfoser, Carola Wenk, and Andreas Zufle. 2025. HD-GEN: A Software System for Large-Scale Human Mobility Data Generation Based on Patterns of Life. InProceedings of the 33rd ACM International Conference on Advances in Geographic Information Systems. 407–410
2025
-
[7]
Hannah Bast, Daniel Delling, Andrew Goldberg, Matthias Müller-Hannemann, Thomas Pajor, Peter Sanders, Dorothea Wagner, and Renato F Werneck. 2016. Route planning in transportation networks. InAlgorithm engineering: Selected results and surveys. Springer, 19–80
2016
-
[8]
Geoff Boeing. 2017. OSMnx: New methods for acquiring, constructing, analyzing, and visualizing complex street networks.Computers, environment and urban systems65 (2017), 126–139
2017
-
[9]
CBS New York. 2023. Assemblyman Zohran Mamdani introduces legislation for free MTA bus rides. https://www.cbsnews.com/newyork/news/zohran-mamdani- new-york-city-free-buses. Accessed: 2026-06-18
2023
-
[10]
Long Cheng, Xuewu Chen, Jonas De Vos, Xinjun Lai, and Frank Witlox. 2019. Applying a random forest method approach to model travel mode choice behavior. Travel behaviour and society14 (2019), 1–10
2019
-
[11]
Joseph YJ Chow, Kaan Ozbay, Yueshuai He, Jinkai Zhou, Mina Lee, Ding Wang, and Di Sha. 2020. Multi-agent simulation-based virtual test bed ecosystem: MATSim-NYC. (2020)
2020
-
[12]
Community Service Society of New York. 2024. CSS Report: New Yorkers Struggle to Afford Mass Transit; Expanding Fair Fares Can Help. https://www.cssny.org/news/entry/css-report-new-yorkers-struggle-to- afford-mass-transit-expanding-fair-fares. Accessed: 2026-06-18
2024
-
[13]
A Divasson-J, Ana M Macarulla, J Ignacio Garcia, and Cruz E Borges. 2025. Agent- based modeling in urban human mobility: A systematic review.Cities158 (2025), 105697
2025
-
[14]
Federal Highway Administration. 2022. 2022 National Household Travel Survey. https://nhts.ornl.gov
2022
-
[15]
Google Developers. 2023. General Transit Feed Specification (GTFS). https://developers.google.com/transit/gtfs
2023
-
[16]
Aric A Hagberg, Daniel A Schult, and Pieter J Swart. 2008. Exploring Network Structure, Dynamics, and Function using NetworkX. InProceedings of the Python in Science Conference. SciPy, 11–15
2008
-
[17]
Brian Y He, Jinkai Zhou, Ziyi Ma, Joseph YJ Chow, and Kaan Ozbay. 2020. Evalua- tion of city-scale built environment policies in New York City with an emerging- mobility-accessible synthetic population.Transportation Research Part A: Policy and Practice141 (2020), 444–467
2020
-
[18]
Brian Yueshuai He, Jinkai Zhou, Ziyi Ma, Ding Wang, Di Sha, Mina Lee, Joseph YJ Chow, and Kaan Ozbay. 2021. A validated multi-agent simulation test bed to evaluate congestion pricing policies on population segments by time-of-day in New York City.Transport Policy101 (2021), 145–161
2021
-
[19]
Peiyu Jing, Ravi Seshadri, Takanori Sakai, Ali Shamshiripour, Andre Romano Alho, Antonios Lentzakis, and Moshe E Ben-Akiva. 2024. Evaluating conges- tion pricing schemes using agent-based passenger and freight microsimulation. Transportation Research Part A: Policy and Practice186 (2024), 104118
2024
-
[20]
Ihab Kaddoura, Benjamin Kickhöfer, Andreas Neumann, and Alejandro Tirachini
-
[21]
Optimal public transport pricing: Towards an agent-based marginal social cost approach.Journal of Transport Economics and Policy (JTEP)49, 2 (2015), 200–218
2015
-
[22]
Islam Kamel, Md Sami Hasnine, Amer Shalaby, Khandker Nurul Habib, and Baher Abdulhai. 2021. Integrated framework of departure time choice, mode choice, and route assignment for large-scale networks.Case Studies on Transport Policy 9, 3 (2021), 1284–1297
2021
-
[23]
Simon Lämmer, Mark Colley, and Patrick Ebel. 2026. GTA: Generative Traffic Agents for Simulating Realistic Mobility Behavior. InProceedings of the 2026 CHI Conference on Human Factors in Computing Systems (CHI ’26). Association for Computing Machinery, New York, NY, USA, Article 1302, 16 pages. doi:10.1145/ 3772318.3790772
arXiv 2026
-
[24]
Milan Lovrić, Sebastián Raveau, Muhammad Adnan, Francisco C Pereira, Kakali Basak, Harish Loganathan, and Moshe Ben-Akiva. 2016. Evaluating off-peak pricing strategies in public transportation with an activity-based approach.Trans- portation Research Record2544, 1 (2016), 10–19
2016
-
[25]
Metropolitan Transportation Authority. 2025. MTA to Sunset MetroCard Sales at End of the Year. https://www.mta.info/press-release/mta-sunset-metrocard- sales-end-of-year. Accessed: 2026-06-18
2025
-
[26]
Metropolitan Transportation Authority. 2026. MTA Budget. https://www.mta. info/budget. Accessed: 2026-06-18
2026
-
[27]
Metropolitan Transportation Authority. 2026. The Policy Brief: How Fair Fares NYC Riders Use the Subway and Bus Network. https://www.mta.info/article/ policy-brief-how-fair-fares-nyc-riders-use-subway-and-bus-network. Ac- cessed: 2026-06-18
2026
-
[28]
MTA. 2023. Metropolitan Transportation Authority Data. https://data.ny.gov
2023
-
[29]
New York City Department of Transportation. 2024. Citywide Mobility Survey. https://www.nyc.gov/html/dot/html/about/citywide-mobility-survey.shtml
2024
-
[30]
New York City Taxi and Limousine Commission. 2025. High Volume For-Hire Ve- hicle Trip Records [Dataset]. https://www.nyc.gov/site/tlc/about/tlc-trip-record- data.page. Accessed: 2026-06-18
2025
-
[31]
New York Metropolitan Transportation Council and North Jersey Transporta- tion Planning Authority. 2014. 2010–2011 Regional Household Travel Survey (RHTS). https://www.nymtc.org/Data-and-Modeling/Travel-Surveys/2010-11- Travel-Survey. Accessed: 2026-06-18
2014
-
[32]
Office of the New York State Comptroller. 2025. DiNapoli Report Tracks MTA’s Shifting Revenue Streams. https://www.osc.ny.gov/press/releases/2025/ 05/dinapoli-report-tracks-mtas-shifting-revenue-streams. Accessed: 2026-06-18
2025
-
[33]
OpenStreetMap Contributors. 2024. OpenStreetMap Data. https://www.openstreetmap.org
2024
-
[34]
Duc-Minh Phan and Laurent Viennot. 2019. Fast Public Transit Routing with Unrestricted Walking through Hub Labeling. arXiv:1906.08971 [cs.NI] https: //arxiv.org/abs/1906.08971
Pith/arXiv arXiv 2019
-
[35]
Soora Rasouli and Harry Timmermans. 2014. Activity-based models of travel demand: promises, progress and prospects.International Journal of Urban Sciences 18, 1 (2014), 31–60
2014
-
[36]
Xiyuan Ren, Zhenglei Ji, and Joseph YJ Chow. 2025. Distributional welfare impacts and compensatory transit strategies under NYC congestion pricing.arXiv preprint arXiv:2510.06416(2025), 1–55
Pith/arXiv arXiv 2025
-
[37]
Kathleen Salazar-Serna, Lorena Cadavid, and Carlos J. Franco. 2024. Modeling Urban Transport Choices: Incorporating Sociocultural Aspects. In2024 Winter Simulation Conference (WSC). 146–157. doi:10.1109/WSC63780.2024.10838860
-
[38]
Tilmann Schlenther, Timofey Volotskiy, Gregor Leich, Felix Zwick, Nico Kuehnel, Jaroslav Smirnov, and Kai Nagel. 2025. Ridepooling and Public Transit: How Pricing Schemes Reveal the Tradeoff between Intermodality and On-Demand Efficiency.Transportation Research Record2679, 11 (2025), 207–220
2025
-
[39]
Andrew W. Stuntz. 2018.Transit Fare Policy: Use of Automated Data to Improve Incremental Decision Making. Master’s thesis. Massachusetts Institute of Tech- nology, Cambridge, MA. https://dspace.mit.edu/handle/1721.1/119275
2018
-
[40]
Joseph V Tuccillo and James D Gaboardi. 2022. Likeness: a toolkit for connecting the social fabric of place to human dynamics.SciPy 2022(2022)
2022
-
[41]
Bureau of Labor Statistics
U.S. Bureau of Labor Statistics. 2023. American Time Use Survey. https://www.bls.gov/tus/
2023
-
[42]
Census Bureau
U.S. Census Bureau. 2022. American Community Survey 5-Year Estimates. https://www.census.gov/programs-surveys/acs
2022
-
[43]
Census Bureau
U.S. Census Bureau. 2023. LEHD Origin-Destination Employment Statistics (LODES): Workplace Area Characteristics [Dataset]. https://lehd.ces.census.gov/ data/. Accessed: 2026-06-18
2023
-
[44]
2016.The multi-agent transport simulation MATSim
Kay W Axhausen, Andreas Horni, and Kai Nagel. 2016.The multi-agent transport simulation MATSim. Ubiquity Press
2016
-
[45]
Srikanth B Yoginath, Nasir Ahmad, Chathika Gunaratne, Licia Amichi, Joon-Seok Kim, Annetta Burger, Haowen Xu, Bhaskar Bishnoi, Steven Carter Christopher, and Gautam Malviya Thakur. 2025. A Scalable Multi-Modal Framework for High- Fidelity Distributed Human Mobility Simulations. InProceedings of the 8th ACM SIGSPATIAL International Workshop on Geospatial S...
-
[46]
Yihua Zhang and Zhan Zhao. 2024. Optimal dynamic pricing for public trans- portation considering consumer social learning.Plos one19, 1 (2024), e0296263
2024
-
[47]
Use of cumulants to quantify uncertainties in the HBT measurements of the homogeneity regions
Ruiyi Zhao, Taha Rashidi, and S. Travis Waller. 2025. ABM-ETOP: Agent- Based Modelling for Transport Equity Policy Optimisation. In2025 IEEE 28th International Conference on Intelligent Transportation Systems (ITSC). 2517–2522. doi:10.1109/ITSC60802.2025.11423433
work page internal anchor Pith review Pith/arXiv arXiv doi:10.1109/itsc60802.2025.11423433 2025
-
[48]
Xilei Zhao, Xiang Yan, Alan Yu, and Pascal Van Hentenryck. 2020. Prediction and behavioral analysis of travel mode choice: A comparison of machine learning and logit models.Travel behaviour and society20 (2020), 22–35. Conference’17, July 2017, Washington, DC, USA Parker Wischhover, Hossein Amiri, Kiara Ha, Jooyoung Yoo, Lina Li, Andreas Züfle, and Joon-S...
2020
discussion (0)
Sign in with ORCID, Apple, or X to comment. Anyone can read and Pith papers without signing in.