The OTELO Survey: The main sequence of low-mass galaxies
Pith reviewed 2026-06-25 20:47 UTC · model grok-4.3
The pith
The main sequence of star formation rate and stellar mass for low-mass galaxies agrees with literature values except for a higher turnover mass at all redshifts.
A machine-rendered reading of the paper's core claim, the machinery that carries it, and where it could break.
Core claim
When comparing the main sequence obtained for the sample of low-mass emission line galaxies with those from the bibliography, very good agreement is found in general. The main sequence can be considered almost the same for the relatively unexplored regime of low-mass galaxies, although the turnover mass is higher for all redshifts compared with the ones from the literature, an effect suggested to arise from the different methods and samples used.
What carries the argument
The main sequence parameterized by a turnover mass and the slope of the low-mass regime, derived from fitting spectral energy distributions of emission line galaxies to obtain stellar masses and total infrared luminosities as proxies for star formation rates.
If this is right
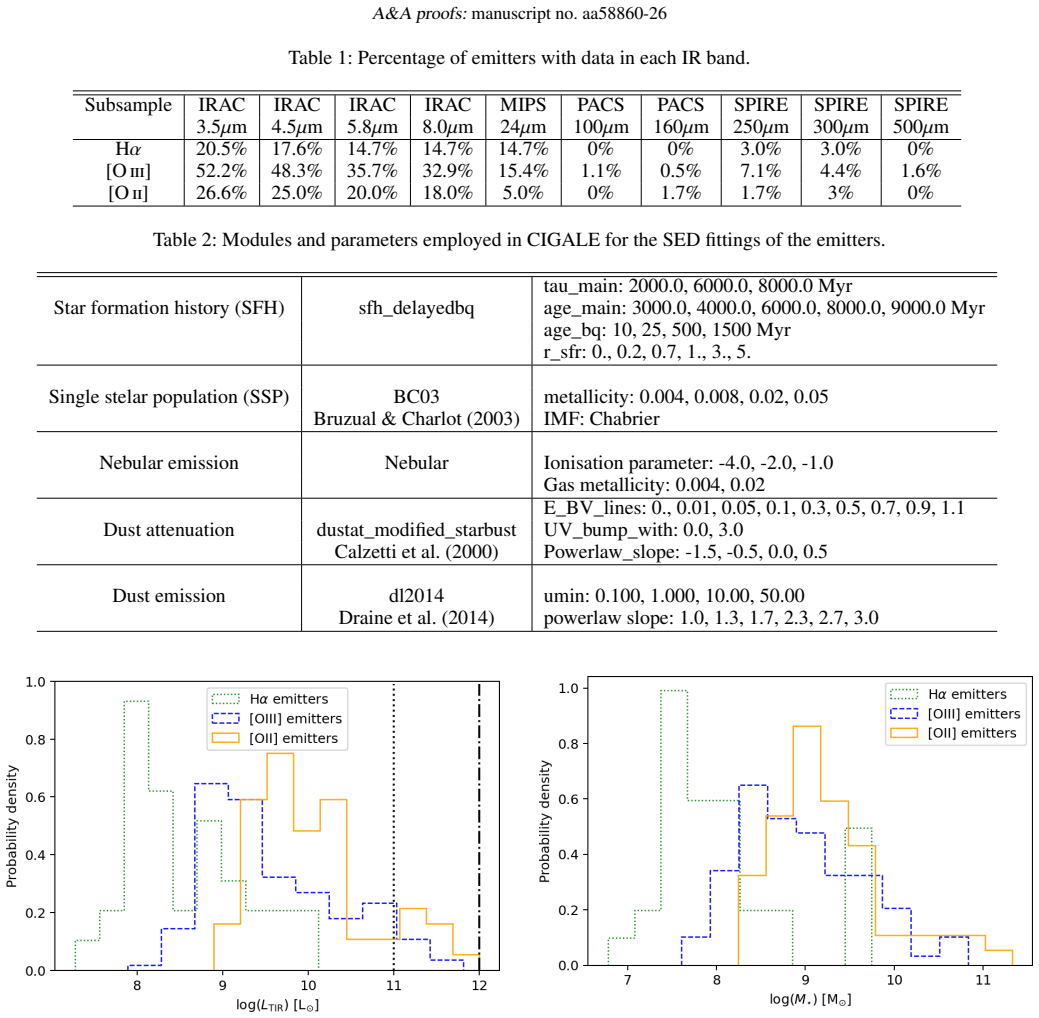
- 100 percent of H-alpha emitters and about 90 percent of [OIII] and [OII] emitters are low-mass galaxies below 10^10 solar masses.
- The main sequence holds similarly across the three redshift regimes for low-mass galaxies.
- The color-magnitude selection method leaves out a significant number of emission line galaxies.
- The sample contains few luminous infrared galaxies and no ultra-luminous infrared galaxies.
Where Pith is reading between the lines
- The higher turnover mass may indicate that low-mass galaxies have different dust attenuation or star formation properties not captured in prior samples.
- Improving infrared constraints could refine the star formation rates and potentially adjust the main sequence parameters.
- Broader application of the color-magnitude selection might reveal a more complete main sequence at these redshifts.
Load-bearing premise
The total infrared luminosity, and therefore the star formation rate, can be reliably recovered from spectral energy distribution fits that lack direct infrared constraints.
What would settle it
Independent measurements of infrared emission from the same set of galaxies that produce star formation rates differing from the SED-derived values would show whether the main sequence parameters are accurate.
Figures



read the original abstract
This paper describes the relationship between the star formation rate and the stellar mass, the so-called main sequence (MS), of low-mass galaxies at three different redshifts from the OTELO survey. In particular, we study Halpha at z=0.38, [OIII] at z=0.83, and [OII] at z=1.43 emission line galaxies (ELGs). This is done to characterise the properties of low-mass ELGs. We fitted the spectral energy distribution (SED) of each emitter and obtained the stellar masses, the total infrared luminosity, and the star formation rate. We found that 100% of the Halpha emitters and about 90% of the [OIII] and [OII] emitters are low-mass galaxies (< 1E10M_sun). We generated a MS for each redshift regime, employing all galaxies and binning them in stellar mass. We obtained the parameters of the fit (turnover mass and slope of the low-mass regime) and compared them to results from the literature. We found that the colour-magnitude method employed to select ELGs leaves out a significant number of them. We also found that the whole sample contains few luminous infrared galaxies and no ultra-luminous infrared galaxies. We also found that the lack of infrared constraints in the input SEDs may generate problems when determining the total infrared luminosity. When comparing the MS obtained for our sample of low-mass ELGs with those from the bibliography, we found, in general, very good agreement. We can consider the MS to be almost the same for the relatively unexplored regime of low-mass galaxies. However, the turnover mass obtained by this work is higher for all redshifts compared with the ones from the literature. We suggest that this is an effect of the different methods and samples used in the generation of the MS compared to those of the bibliography.
Editorial analysis
A structured set of objections, weighed in public.
Referee Report
Summary. This manuscript analyzes the star-formation main sequence (MS) for low-mass emission-line galaxies (ELGs) selected via the OTELO survey at three redshift slices (Hα at z=0.38, [OIII] at z=0.83, [OII] at z=1.43). SED fits without direct IR photometry yield stellar masses and total IR luminosities (hence SFRs); the authors report that 90–100% of the sample lies below 10^10 M⊙, construct binned MS relations, and fit for turnover mass and low-mass slope. They claim general agreement with literature MS relations in the low-mass regime but systematically higher turnover masses at all redshifts, attributing the offset to differences in methods and samples.
Significance. The work targets the sparsely sampled low-mass end of the MS, which is relevant for galaxy evolution models. If the higher turnover masses prove robust after addressing SFR uncertainties, the result would highlight possible selection or methodological effects in prior studies. The manuscript already notes the absence of luminous/ultra-luminous IR galaxies and incompleteness from the colour-magnitude selection, which are useful contextual findings.
major comments (3)
- [Abstract] Abstract: turnover masses are reported as 'higher for all redshifts' with no numerical values, uncertainties, or tabulated comparison to specific literature fits (e.g., no error bars or baseline sample listed), preventing quantitative assessment of the central claim.
- [SED fitting and SFR derivation] The section describing SED fitting and SFR derivation: the text explicitly states that 'the lack of infrared constraints in the input SEDs may generate problems when determining the total infrared luminosity,' yet no quantitative test (e.g., comparison of TIR-derived SFRs against any available IR photometry or mock tests) is provided. Because the turnover mass is the bend point fitted to the high-mass SFRs, any systematic offset or scatter in these SFRs directly shifts the fitted turnover location and undermines the claim that the turnover is higher than literature values.
- [MS fitting and comparison] The MS fitting and comparison section: no explicit baseline comparison sample is defined, and the binned MS fits lack reported uncertainties on the turnover mass or low-mass slope parameters, making it impossible to judge whether the reported offset is statistically significant or driven by the acknowledged selection incompleteness.
minor comments (2)
- [Abstract] The abstract states 'We also found that the colour-magnitude method employed to select ELGs leaves out a significant number of them' without quantifying the fraction or showing the impact on the MS parameters.
- [Methods] Notation for turnover mass and low-mass slope should be defined once with symbols and units when first introduced in the fitting description.
Simulated Author's Rebuttal
We thank the referee for their constructive comments. We address each major comment below and will revise the manuscript to strengthen quantitative aspects and clarify limitations.
read point-by-point responses
-
Referee: [Abstract] Abstract: turnover masses are reported as 'higher for all redshifts' with no numerical values, uncertainties, or tabulated comparison to specific literature fits (e.g., no error bars or baseline sample listed), preventing quantitative assessment of the central claim.
Authors: We agree that the abstract would benefit from including specific numerical values for the turnover masses, their uncertainties, and explicit comparisons to literature fits. We will revise the abstract to incorporate these details for quantitative assessment. revision: yes
-
Referee: [SED fitting and SFR derivation] The section describing SED fitting and SFR derivation: the text explicitly states that 'the lack of infrared constraints in the input SEDs may generate problems when determining the total infrared luminosity,' yet no quantitative test (e.g., comparison of TIR-derived SFRs against any available IR photometry or mock tests) is provided. Because the turnover mass is the bend point fitted to the high-mass SFRs, any systematic offset or scatter in these SFRs directly shifts the fitted turnover location and undermines the claim that the turnover is higher than literature values.
Authors: We acknowledge this limitation, which is already noted in the manuscript. No IR photometry is available for the sample, so quantitative tests or mocks cannot be performed. The emission-line selected, low-mass sample may reduce the impact, but we recognize the potential effect on high-mass SFRs. We will expand the discussion to address possible systematics on the turnover mass as a caveat. revision: partial
-
Referee: [MS fitting and comparison] The MS fitting and comparison section: no explicit baseline comparison sample is defined, and the binned MS fits lack reported uncertainties on the turnover mass or low-mass slope parameters, making it impossible to judge whether the reported offset is statistically significant or driven by the acknowledged selection incompleteness.
Authors: We agree and will revise the section to explicitly define the comparison literature samples and report uncertainties on the turnover mass and slope parameters. We already discuss selection incompleteness and will add further evaluation of its potential effect on the results. revision: yes
Circularity Check
No significant circularity in MS parameter derivation or literature comparison
full rationale
The paper derives MS parameters (turnover mass, low-mass slope) by direct fitting to OTELO SED-derived stellar masses and SFRs at each redshift, then compares the resulting curves to external literature values. No load-bearing self-citations appear in the provided text, and the higher-turnover claim is presented as an empirical outcome of the new sample rather than a quantity forced by prior fits or definitions. The derivation chain remains independent of its own inputs and does not reduce by construction to any fitted parameter or self-referential premise.
Axiom & Free-Parameter Ledger
free parameters (2)
- turnover mass (per redshift bin)
- low-mass slope (per redshift bin)
axioms (2)
- domain assumption SED fitting yields reliable stellar masses and SFRs even without direct IR photometry
- domain assumption Color-magnitude selection of ELGs is sufficiently complete for the low-mass regime
Reference graph
Works this paper leans on
-
[1]
1999, MNRAS, 310, 540 Bongiovanni, Á., Ramón-Pérez, M., Pérez García, A
Arnouts, S., Cristiani, S., Moscardini, L., et al. 1999, MNRAS, 310, 540 Bongiovanni, Á., Ramón-Pérez, M., Pérez García, A. M., et al. 2019, A&A, 631, A9 Bongiovanni, Á., Ramón-Pérez, M., Pérez García, A. M., et al. 2020, A&A, 635, A35
1999
-
[2]
2019, A&A, 622, A103
Boquien, M., Burgarella, D., Roehlly, Y ., et al. 2019, A&A, 622, A103
2019
-
[3]
Brinchmann, J., Charlot, S., White, S. D. M., et al. 2004, MNRAS, 351, 1151
2004
-
[4]
& Charlot, S
Bruzual, G. & Charlot, S. 2003, MNRAS, 344, 1000
2003
-
[5]
J., Warren, S
Bunker, A. J., Warren, S. J., Hewett, P. C., & Clements, D. L. 1995, MNRAS, 273, 513
1995
-
[6]
C., et al
Calzetti, D., Armus, L., Bohlin, R. C., et al. 2000, ApJ, 533, 682 Cedrés, B., Bongiovanni, Á., Cerviño, M., et al. 2021a, A&A, 649, A73 Cedrés, B., Pérez-García, A. M., Pérez-Martínez, R., et al. 2021b, ApJ, 915, L17 Cerviño, M., Bongiovanni, A., & Hidalgo, S. 2016, A&A, 589, A108
2000
-
[7]
2003, PASP, 115, 763
Chabrier, G. 2003, PASP, 115, 763
2003
-
[8]
2024, ApJ, 968, 32
Chen, N., Motohara, K., Spitler, L., Nakajima, K., & Terao, Y . 2024, ApJ, 968, 32
2024
-
[9]
2019, PASJ, 71, 31
Chiang, C.-Y ., Goto, T., Hashimoto, T., et al. 2019, PASJ, 71, 31
2019
-
[10]
2022, A&A, 661, L7
Daddi, E., Delvecchio, I., Dimauro, P., et al. 2022, A&A, 661, L7
2022
-
[11]
2007, ApJ, 670, 156
Daddi, E., Dickinson, M., Morrison, G., et al. 2007, ApJ, 670, 156
2007
-
[12]
T., Aniano, G., Krause, O., et al
Draine, B. T., Aniano, G., Krause, O., et al. 2014, ApJ, 780, 172
2014
-
[13]
B., Simpson, C., Collins, C
Drake, A. B., Simpson, C., Collins, C. A., et al. 2013, MNRAS, 433, 796
2013
- [14]
-
[15]
K., De Looze, I., Boquien, M., et al
Hunt, L. K., De Looze, I., Boquien, M., et al. 2019, A&A, 621, A51
2019
-
[16]
J., et al
Ilbert, O., Arnouts, S., McCracken, H. J., et al. 2006, A&A, 457, 841
2006
-
[17]
& Bothun, G
Impey, C. & Bothun, G. 1997, ARA&A, 35, 267
1997
-
[18]
Kennicutt, R. C. & Evans, N. J. 2012, ARA&A, 50, 531
2012
-
[19]
Kennicutt, Jr., R. C. 1998, ARA&A, 36, 189
1998
-
[20]
C., Hao, C.-N., Calzetti, D., et al
Kennicutt, Jr., R. C., Hao, C.-N., Calzetti, D., et al. 2009, ApJ, 703, 1672
2009
-
[21]
J., Geller, M
Kewley, L. J., Geller, M. J., & Jansen, R. A. 2004, AJ, 127, 2002
2004
-
[22]
B., Casey, C
Lee, N., Sanders, D. B., Casey, C. M., et al. 2015, ApJ, 801, 80
2015
-
[23]
C., Fanson, J., Schiminovich, D., et al
Martin, D. C., Fanson, J., Schiminovich, D., et al. 2005, ApJ, 619, L1
2005
-
[24]
P., Somerville, R
Moster, B. P., Somerville, R. S., Newman, J. A., & Rix, H.-W. 2011, ApJ, 731, 113
2011
-
[25]
A., Cerviño, M., et al
Nadolny, J., Lara-López, M. A., Cerviño, M., et al. 2020, A&A, 636, A84 Navarro Martínez, R., Cerviño, M., Pérez-Martínez, R., et al. 2026, A&A, 709, A234 Navarro Martínez, R., Pérez-García, A. M., Pérez-Martínez, R., et al. 2021, A&A, 653, A24
2020
-
[26]
G., Weiner, B
Noeske, K. G., Weiner, B. J., Faber, S. M., et al. 2007, ApJ, 660, L43
2007
-
[27]
D., Xilouris, E
Paspaliaris, E. D., Xilouris, E. M., Nersesian, A., et al. 2021, A&A, 649, A137
2021
-
[28]
2023, MNRAS, 519, 1526
Popesso, P., Concas, A., Cresci, G., et al. 2023, MNRAS, 519, 1526
2023
-
[29]
2019, MNRAS, 483, 3213 Ramón-Pérez, M., Bongiovanni, Á., Pérez García, A
Popesso, P., Concas, A., Morselli, L., et al. 2019, MNRAS, 483, 3213 Ramón-Pérez, M., Bongiovanni, Á., Pérez García, A. M., et al. 2019, A&A, 631, A10
2019
-
[30]
2011, ApJ, 739, L40
Rodighiero, G., Daddi, E., Baronchelli, I., et al. 2011, ApJ, 739, L40
2011
-
[31]
Sanders, D. B. & Mirabel, I. F. 1996, ARA&A, 34, 749
1996
-
[32]
Santos, D. J. D., Goto, T., Kim, S. J., et al. 2021, MNRAS, 507, 3070
2021
-
[33]
2015, A&A, 575, A74
Schreiber, C., Pannella, M., Elbaz, D., et al. 2015, A&A, 575, A74
2015
-
[34]
2025, MNRAS, 544, 4551
Simmonds, C., Tacchella, S., McClymont, W., et al. 2025, MNRAS, 544, 4551
2025
-
[35]
C., Feldmann, R., et al
Sparre, M., Hayward, C. C., Feldmann, R., et al. 2017, MNRAS, 466, 88
2017
-
[36]
S., Steinhardt, C
Speagle, J. S., Steinhardt, C. L., Capak, P. L., & Silverman, J. D. 2014, ApJS, 214, 15
2014
-
[37]
L., Kodama, T., Sobral, D., et al
Suzuki, T. L., Kodama, T., Sobral, D., et al. 2016, MNRAS, 462, 181
2016
-
[38]
M., et al
Tacchella, S., Dekel, A., Carollo, C. M., et al. 2016, MNRAS, 457, 2790
2016
-
[39]
R., Motohara, K., & Chen, N
Terao, Y ., Spitler, L. R., Motohara, K., & Chen, N. 2022, ApJ, 941, 70
2022
-
[40]
2010, A&A, 517, A93
Villaverde, M., Cerviño, M., & Luridiana, V . 2010, A&A, 517, A93
2010
-
[41]
J., et al
Wang, T.-W., Goto, T., Kim, S. J., et al. 2020, MNRAS, 499, 4068 Article number, page 9 of 9
2020
discussion (0)
Sign in with ORCID, Apple, or X to comment. Anyone can read and Pith papers without signing in.