Deciphering Region-Level Signatures from Latency Measurements in LEO Satellite Internet
Pith reviewed 2026-06-30 07:53 UTC · model grok-4.3
The pith
Region-level latency differences in LEO satellite networks stem from infrastructure availability and dish-to-PoP distances, with minimum RTT as the top discriminator.
A machine-rendered reading of the paper's core claim, the machinery that carries it, and where it could break.
Core claim
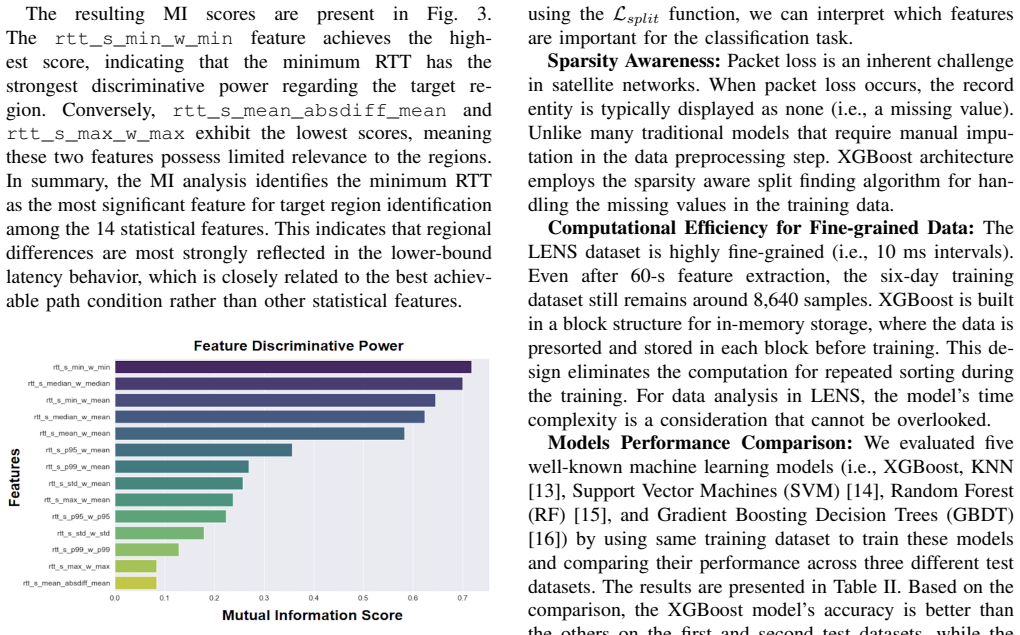
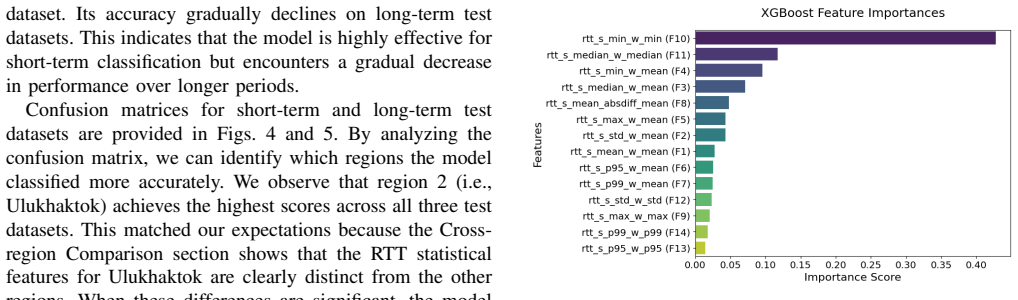
Using RTT data from the LENS dataset across five regions, the authors show that latency variations are strongly tied to deployment factors, especially infrastructure availability and the distance from Starlink dishes to Points of Presence. Mutual information analysis reveals minimum RTT as the most informative feature, corroborated by XGBoost importance scores. A classifier built on these features reaches 83 percent accuracy for short-term region identification, though accuracy drops over longer time spans.
What carries the argument
A hierarchical analytical framework converting raw RTT sequences into multi-scale statistical features for comparing regions.
If this is right
- Deployment factors such as infrastructure availability and dish-to-PoP distance explain a substantial portion of cross-region latency differences.
- Minimum RTT is the single most informative statistic for separating regions.
- Statistical features extracted at multiple time scales support region classification at 83 percent accuracy when data are short-term.
- Classifier performance declines over longer observation windows, indicating that fixed feature sets lose effectiveness as network conditions evolve.
Where Pith is reading between the lines
- The same feature-extraction approach could be applied to measurements from other LEO constellations to compare their region-level signatures.
- Operators might use minimum-RTT maps to prioritize PoP placement or ground-station upgrades in high-distance regions.
- Periodic retraining or online adaptation of the feature set would likely be required to maintain classification performance as deployments change.
Load-bearing premise
The RTT measurements from the public LENS dataset and the selection of five regions are representative enough to reveal general principles of region-level latency signatures without significant confounding variables.
What would settle it
Repeating the mutual-information ranking and classification experiment on RTT traces from more than five regions or from a different LEO provider to test whether minimum RTT remains the highest-ranked feature and whether short-term accuracy stays near 83 percent.
Figures

read the original abstract
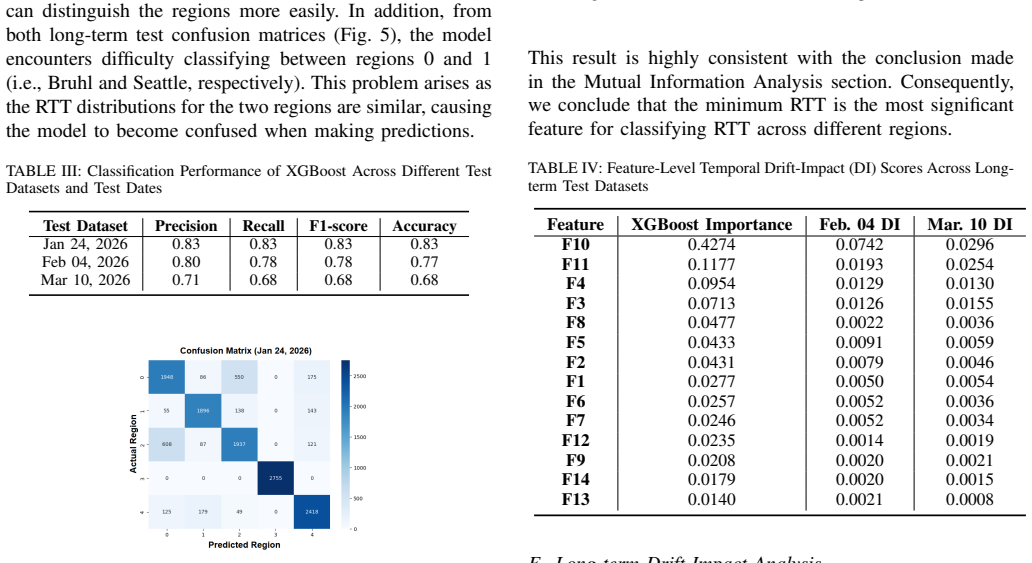
Low-Earth orbit (LEO) satellite Internet has become an indispensable infrastructure that provide growing coverage for global users. Despite extensive measurement efforts, the principles underlying region-level performance characteristics remain insufficiently understood, limiting the ability to identify region-specific latency signatures under dynamic network conditions. In this paper, we formulate the problem of region-level latency characterization using Starlink round-trip time (RTT) measurements from the public LENS dataset. We then propose a hierarchical analytical framework that transforms raw RTT sequences into multi-scale statistical features for cross-region comparison. Using data from five geographically representative regions, we demonstrate that latency differences are strongly associated with deployment factors, particularly infrastructure availability and Starlink dish-to-Point-of-Presence distance. Mutual information analysis identifies minimum RTT as the most discriminative feature, which is further supported by XGBoost-based feature importance. The proposed model well achieves 83% accuracy on short-term data. However, its performance degrades over longer periods, indicating limited temporal generalization and motivating the need for adaptive models and feature representations for long-term performance in the future.
Editorial analysis
A structured set of objections, weighed in public.
Referee Report
Summary. The paper formulates region-level latency characterization for LEO satellite Internet using Starlink RTT data from the public LENS dataset. It introduces a hierarchical framework converting raw RTT sequences into multi-scale statistical features, then applies mutual information and XGBoost to data from five regions to show strong associations between latency differences and deployment factors (infrastructure availability, dish-to-PoP distance), with minimum RTT as the most discriminative feature; the model reaches 83% short-term accuracy but degrades over longer periods.
Significance. If the associations prove robust, the work supplies an empirical baseline for understanding LEO performance variation and could guide adaptive modeling. The use of a public dataset together with standard mutual-information and tree-based importance methods supplies a reproducible starting point, though the small region count and temporal degradation limit immediate broader applicability.
major comments (2)
- [Abstract] Abstract and data description: the central claim that latency differences are 'strongly associated' with deployment factors rests on RTT measurements from only five regions. No justification is given for region selection or controls for confounders (user load, handoff patterns, local routing, measurement timing), so the mutual-information ranking and 83% accuracy may reflect dataset-specific artifacts rather than general region-level signatures.
- [Abstract] Abstract (results paragraph): the explicit note that performance 'degrades over longer periods' directly undermines the goal of identifying stable 'region-level latency signatures under dynamic network conditions.' The multi-scale features therefore appear insufficiently invariant, which is load-bearing for the problem formulation.
minor comments (1)
- The abstract refers to a 'hierarchical analytical framework' and 'multi-scale statistical features' without enumerating the exact transformations or scales; a methods section should list them explicitly for reproducibility.
Simulated Author's Rebuttal
We thank the referee for the constructive feedback on the abstract and data description. We address each major comment below, proposing revisions where the manuscript can be strengthened without misrepresenting the work.
read point-by-point responses
-
Referee: [Abstract] Abstract and data description: the central claim that latency differences are 'strongly associated' with deployment factors rests on RTT measurements from only five regions. No justification is given for region selection or controls for confounders (user load, handoff patterns, local routing, measurement timing), so the mutual-information ranking and 83% accuracy may reflect dataset-specific artifacts rather than general region-level signatures.
Authors: We agree the analysis uses only five regions drawn from the public LENS dataset, which limits generalizability. These regions were selected in the full manuscript (Section 3) to span diverse geographic and infrastructure settings, but we acknowledge that explicit justification is missing from the abstract and that the dataset lacks metadata to control for the listed confounders. We will revise the abstract to state the selection criteria and add a dedicated limitations paragraph discussing potential dataset-specific artifacts and the absence of controls. revision: yes
-
Referee: [Abstract] Abstract (results paragraph): the explicit note that performance 'degrades over longer periods' directly undermines the goal of identifying stable 'region-level latency signatures under dynamic network conditions.' The multi-scale features therefore appear insufficiently invariant, which is load-bearing for the problem formulation.
Authors: The abstract already reports the degradation as an empirical finding rather than a contradiction. This observation refines the contribution by showing that current multi-scale features capture short-term but not long-term invariance. We will revise the problem statement and abstract to explicitly frame the work as characterizing short-term signatures while highlighting the temporal limitation and the resulting need for adaptive modeling. revision: yes
Circularity Check
No circularity: empirical analysis on public dataset with standard ML tools
full rationale
The paper performs standard empirical analysis: it ingests the public LENS RTT dataset from five regions, extracts multi-scale statistical features, applies mutual information and XGBoost to rank features (min RTT highest), and reports classification accuracy (83% short-term). No derivation chain, fitted parameter renamed as prediction, self-citation load-bearing premise, or ansatz is present. All steps are data-driven and externally falsifiable against the public dataset; the degradation on longer periods is explicitly reported rather than hidden. This matches the default non-circular case for measurement papers.
Axiom & Free-Parameter Ledger
axioms (2)
- domain assumption The LENS dataset provides accurate and representative RTT measurements for the studied regions.
- domain assumption Statistical features extracted from RTT sequences capture the relevant latency signatures without loss of critical information.
Reference graph
Works this paper leans on
-
[1]
Closing the performance and management gaps with satellite internet: Challenges, approaches, and future directions,
P. Hu, “Closing the performance and management gaps with satellite internet: Challenges, approaches, and future directions,” inInternet Architecture Board (IAB) Barries to Internet Access of Services (BIAS) Workshop, January 2024. [Online]. Available: https://tinyurl.com/mvwukdev
2024
-
[2]
Multivariate variance-based genetic ensemble learning for satellite anomaly detection,
M. A. M. Sadr, Y . Zhu, and P. Hu, “Multivariate variance-based genetic ensemble learning for satellite anomaly detection,”IEEE Transactions on Vehicular Technology, vol. 72, no. 11, pp. 14 155– 14 165, 2023
2023
-
[3]
Lens: A leo satellite network measurement dataset,
J. Zhao and J. Pan, “Lens: A leo satellite network measurement dataset,” inProceedings of the 15th ACM Multimedia Systems Con- ference, 2024, pp. 278–284
2024
-
[4]
A multifaceted look at starlink performance,
N. Mohan, A. E. Ferguson, H. Cechet al., “A multifaceted look at starlink performance,” inProc. of the ACM Web Conference 2024, ser. WWW ’24. New York, NY , USA: Association for Computing Machinery, 2024, p. 2723–2734
2024
-
[5]
Democratizing leo satellite network measurement,
L. Izhikevich, M. Tran, K. Izhikevichet al., “Democratizing leo satellite network measurement,”Proc. ACM Meas. Anal. Comput. Syst., vol. 8, no. 1, Feb. 2024. [Online]. Available: https://doi.org/10.1145/3639039
-
[6]
A detailed characterization of starlink one-way delay,
J. Garcia, S. Sundberg, and A. Brunstrom, “A detailed characterization of starlink one-way delay,” inProceedings of the 2025 3rd Workshop on LEO Networking and Communication, ser. LEO-NET ’25. New York, NY , USA: ACM, 2025, p. 43–49
2025
-
[7]
Statistical characterization and prediction of e2e latency over leo satellite networks,
A. Casparsen, J. E. Jakobsen, J. J. Nielsenet al., “Statistical characterization and prediction of e2e latency over leo satellite networks,” 2026, arXiv:2601.08439 [cs.NI]. [Online]. Available: https://arxiv.org/abs/2601.08439
-
[8]
Minimum round-trip time prediction for low earth orbit satellite networks,
J. Chen, Y . Li, H. Chaiet al., “Minimum round-trip time prediction for low earth orbit satellite networks,”International Journal of Satellite Communications and Networking, vol. 43, no. 4, pp. 309–317, 2025
2025
-
[9]
WetLinks: a Large- Scale Longitudinal Starlink Dataset with Contiguous Weather Data,
D. Laniewski, E. Lanfer, B. Meijerinket al., “WetLinks: a Large- Scale Longitudinal Starlink Dataset with Contiguous Weather Data,” inProc. of the 8th Network Traffic Measurement and Analysis Conf. (TMA), 2024
2024
-
[10]
Investigating web content delivery performance over starlink,
R. Bose, J. Zhao, T. Shreedharet al., “Investigating web content delivery performance over starlink,” 2025, arXiv:2510.13710 [cs.NI]. [Online]. Available: https://arxiv.org/abs/2510.13710
-
[11]
Mutual information between discrete and continuous data sets,
B. C. Ross, “Mutual information between discrete and continuous data sets,”PloS one, vol. 9, no. 2, p. e87357, 2014
2014
-
[12]
Xgboost: A scalable tree boosting system,
T. Chen and C. Guestrin, “Xgboost: A scalable tree boosting system,” inProceedings of the 22nd acm sigkdd international conference on knowledge discovery and data mining, 2016, pp. 785–794
2016
-
[13]
Knn model-based approach in classification,
G. Guo, H. Wang, D. Bellet al., “Knn model-based approach in classification,” inOTM Confederated International Conferences” On the Move to Meaningful Internet Systems”. Springer, 2003, pp. 986– 996
2003
-
[14]
Svm classification: Its contents and challenges,
S. Yue, P. Li, and P. Hao, “Svm classification: Its contents and challenges,”Applied Mathematics-A Journal of Chinese Universities, vol. 18, no. 3, pp. 332–342, 2003
2003
-
[15]
Random forests,
L. Breiman, “Random forests,”Machine learning, vol. 45, no. 1, pp. 5–32, 2001
2001
-
[16]
Lightgbm: A highly efficient gradient boosting decision tree,
G. Ke, Q. Meng, T. Finleyet al., “Lightgbm: A highly efficient gradient boosting decision tree,”Advances in neural information processing systems, vol. 30, 2017
2017
discussion (0)
Sign in with ORCID, Apple, or X to comment. Anyone can read and Pith papers without signing in.