Quantum percolation based dynamic propagation connectivity for critical-area identification in transport networks
Pith reviewed 2026-06-30 05:57 UTC · model grok-4.3
The pith
A quantum percolation metric using continuous propagation strengths identifies critical areas in transport networks that differ from those found by link counts, betweenness, or binary percolation.
A machine-rendered reading of the paper's core claim, the machinery that carries it, and where it could break.
Core claim
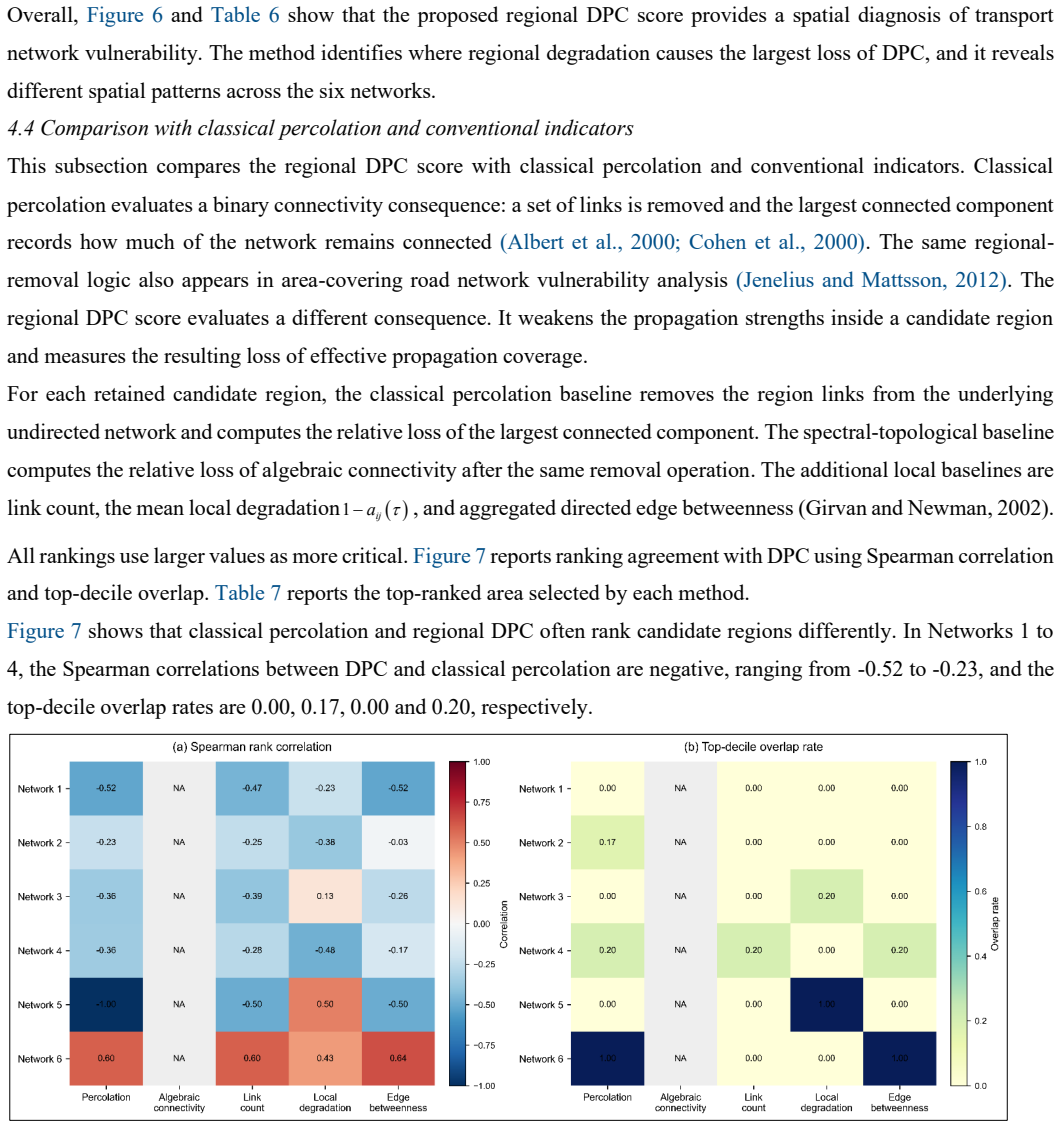
The regional DPC score, computed by converting time-varying travel times into continuous propagation strengths, constructing a Hermitian propagation operator, and quantifying the drop in the resulting connectivity measure after regional degradation, identifies critical areas whose impact on propagation differs from regions selected by link count, local degradation, edge betweenness, algebraic connectivity, and classical percolation, with negative rank correlations observed between DPC and classical percolation in Networks 1-4.
What carries the argument
The Hermitian propagation operator built at each observation time from continuous propagation strengths obtained by mapping link travel times, whose associated DPC value is then used in a regional degradation experiment to rank areas by propagation loss.
If this is right
- Transport networks can be monitored for gradual propagation loss rather than waiting for binary connectivity failure.
- Recovery prioritisation can target regions that produce the largest measured drop in DPC after simulated degradation.
- Vulnerability patterns differ when continuous degradation is considered instead of discrete fragmentation.
- The method remains stable under changes in travel-time scaling, degradation strength, and grid resolution.
Where Pith is reading between the lines
- Planners could combine DPC rankings with existing topological measures to cover both gradual slowdowns and sudden breaks.
- The negative correlation with classical percolation suggests that continuous models may highlight different intervention points than discrete ones in any system with time-varying link conditions.
- The same conversion of travel times to strengths could be applied to other flow networks where partial degradation precedes full disconnection.
Load-bearing premise
Converting time-varying link travel times into continuous propagation strengths and defining a Hermitian propagation operator produces a DPC score whose regional degradation loss ranks areas by their true impact on network-wide propagation capability.
What would settle it
In the Sioux Falls benchmark or Florida networks, degrade the known critical corridor or high-DPC regions and observe that the measured DPC loss does not place them at the top of the regional ranking, or that DPC rankings show consistently positive rather than negative correlation with classical percolation.
Figures


read the original abstract
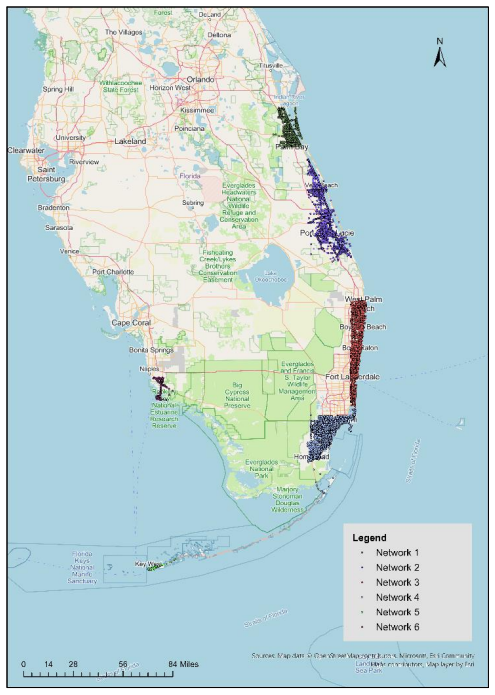
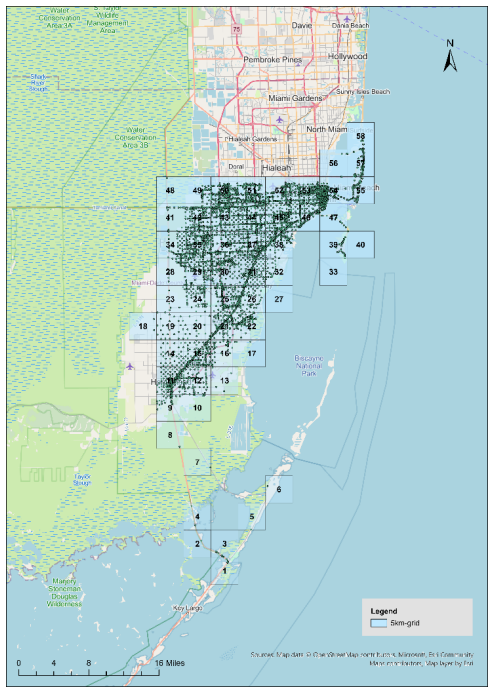
Transport networks often lose functionality through gradual degradation in link operating conditions before topological disconnection occurs. Link-centred and binary percolation measures identify important facilities or connectivity failures, but they provide limited information on which spatial areas cause the largest loss of network-wide propagation capability. This paper develops a Dynamic Propagation Connectivity (DPC) metric based on quantum percolation for critical-area identification in transport networks. Time-varying link travel times are converted into continuous propagation strengths, which define a Hermitian propagation operator at each observation time. Candidate regions are then evaluated by a regional degradation experiment that measures the resulting loss of DPC. The method is applied to a benchmark Sioux Falls network and six Florida road networks during the post-Hurricane Irma disruption and recovery period, using 1,281 five-minute observation times. The benchmark confirms that the regional DPC score identifies a predefined structurally critical corridor. In the Florida networks, the identified critical areas differ from regions selected by link count, local degradation, edge betweenness, algebraic connectivity, and classical percolation. In Networks 1 to 4, DPC and classical percolation rankings have negative Spearman correlations, showing that continuous propagation degradation and binary fragmentation reveal different vulnerability patterns. Robustness tests under alternative travel time scaling, degradation strength, and grid size show stable results, with mean rank agreement between 0.84 and 0.96. The findings extend transport resilience analysis based on percolation from binary connectivity loss to continuous propagation degradation and provide a spatial diagnostic tool for regional monitoring, emergency planning, and recovery prioritisation.
Editorial analysis
A structured set of objections, weighed in public.
Referee Report
Summary. The paper develops a Dynamic Propagation Connectivity (DPC) metric based on quantum percolation for identifying critical areas in transport networks. Time-varying link travel times are converted into continuous propagation strengths that define a Hermitian propagation operator at each observation time. Candidate regions are ranked by the loss in DPC after targeted regional degradation. The method is applied to the Sioux Falls benchmark network and six Florida road networks using 1,281 five-minute observation times during post-Hurricane Irma disruption and recovery. It reports that DPC identifies a predefined critical corridor in the benchmark, produces rankings distinct from link count, local degradation, edge betweenness, algebraic connectivity, and classical percolation (with negative Spearman correlations in Networks 1-4), and yields stable results under alternative travel time scaling, degradation strength, and grid size (mean rank agreement 0.84-0.96).
Significance. If the operator construction and degradation protocol are as described, the work extends percolation-based resilience analysis from binary topological disconnection to continuous propagation degradation. The benchmark confirmation, application to real disruption data, explicit distinction from multiple classical metrics, and reported robustness across parameter choices constitute concrete strengths that could support practical use in regional monitoring and recovery prioritisation.
minor comments (2)
- [Abstract] Abstract: the statement that DPC and classical percolation rankings have negative Spearman correlations in Networks 1 to 4 should be accompanied by the numerical coefficient values and any associated p-values or sample-size information.
- [Robustness tests] Robustness section: the reported mean rank agreement range (0.84-0.96) should indicate whether this is an average across all tested parameter combinations or per-network, and whether variation or standard deviation is available.
Simulated Author's Rebuttal
We thank the referee for the constructive and positive assessment of our manuscript on the Dynamic Propagation Connectivity (DPC) metric. The recommendation for minor revision is noted. As no specific major comments were raised in the report, we provide no point-by-point responses below and confirm that the manuscript can be revised accordingly if any editorial or minor clarifications are requested.
Circularity Check
No significant circularity; derivation is self-contained
full rationale
The paper constructs DPC by converting observed travel times to continuous strengths, forming a Hermitian operator per time slice, and computing regional loss under targeted degradation. These steps are defined explicitly from input data and standard quantum-percolation operators without reducing to fitted parameters renamed as predictions, self-citation chains, or ansatzes smuggled from prior author work. The negative Spearman correlations with classical percolation and robustness checks (rank agreement 0.84-0.96) are computed directly from the defined quantities on the Florida networks, providing independent content against external benchmarks. No load-bearing step collapses by construction to its inputs.
Axiom & Free-Parameter Ledger
free parameters (3)
- travel time scaling
- degradation strength
- grid size
axioms (1)
- domain assumption Time-varying link travel times can be converted into continuous propagation strengths that define a valid Hermitian propagation operator.
invented entities (1)
-
Dynamic Propagation Connectivity (DPC) metric
no independent evidence
Reference graph
Works this paper leans on
-
[1]
Error and attack tolerance of complex networks. nature, 406, 378-382. https://doi.org/https://doi.org/10.1038/35019019. Anderson, P. W
-
[2]
Transportation Research Part B: Methodological, 34, 533-545
A game theory approach to measuring the performance reliability of transport networks. Transportation Research Part B: Methodological, 34, 533-545. https://doi.org/https://doi.org/10.1016/S0191-2615(99)00042-9. Bell, M. G., Kurauchi, F., Perera, S. & Wong, W
-
[3]
Transportation Research Part B: Methodological, 99, 251-266
Investigating transport network vulnerability by capacity weighted spectral analysis. Transportation Research Part B: Methodological, 99, 251-266. https://doi.org/https://doi.org/10.1016/j.trb.2017.03.002. Biamonte, J., Faccin, M. & De Domenico, M
-
[4]
https://doi.org/https://doi.org/10.1038/s42005-019-0152-6. Broadbent, S. R. & Hammersley, J. M
-
[5]
Percolation processes: I. Crystals and mazes. Mathematical Proceedings of the Cambridge Philosophical Society, 53, 629-641. https://doi.org/10.1017/S0305004100032680. Cohen, R., Erez, K., Ben-Avraham, D. & Havlin, S
-
[6]
https://doi.org/https://doi.org/10.1103/PhysRevLett.85.4626. Evers, F. & Mirlin, A. D
-
[7]
Reviews of Modern Physics, 80, 1355-1417
Anderson transitions. Reviews of Modern Physics, 80, 1355-1417. https://doi.org/https://doi.org/10.1103/RevModPhys.80.1355. Faturechi, R. & Miller-Hooks, E
-
[8]
Transportation research part B: methodological, 70, 47-64
Travel time resilience of roadway networks under disaster. Transportation research part B: methodological, 70, 47-64. https://doi.org/https://doi.org/10.1016/j.trb.2014.08.007. Fiedler, M
-
[9]
Resilience and efficiency in transporta tion networks. Science advances, 3, e1701079. https://doi.org/10.1126/sciadv.1701079. Girvan, M. & Newman, M. E
-
[10]
Proceedings of the national academy of sciences, 99, 7821-7826
Community structure in social and biological networks. Proceedings of the national academy of sciences, 99, 7821-7826. https://doi.org/https://doi.org/10.1073/pnas.122653799. Guo, K. & Mohar, B
-
[11]
Journal of Graph Theory, 85, 217-248
Hermitian adjacency matrix of digraphs and mixed graphs. Journal of Graph Theory, 85, 217-248. https://doi.org/https://doi.org/10.1002/jgt.22057. Hamedmoghadam, H., Jalili, M., Vu, H. L. & Stone, L
-
[12]
https://doi.org/https://doi.org/10.1038/s41467-021-21483-y. Jenelius, E
-
[13]
Journal of Transport Geography, 17, 234-244
Network structure and travel patterns: explaining the geographical disparities of road network vulnerabili ty. Journal of Transport Geography, 17, 234-244. https://doi.org/https://doi.org/10.1016/j.jtrangeo.2008.06.002. Jenelius, E. & Mattsson, L.-G
-
[14]
Transportation research part A: policy and practice, 46, 746-760
Road network vulnerability analysis of area-covering disruptions: A grid-based approach with case study. Transportation research part A: policy and practice, 46, 746-760. https://doi.org/https://doi.org/10.1016/j.tra.2012.02.003. Jenelius, E., Petersen, T. & Mattsson, L.-G
-
[15]
Transportation Research Part A: Policy and Practice, 40, 537-560
Importance and exposure in road network vulnerability analysis. Transportation Research Part A: Policy and Practice, 40, 537-560. https://doi.org/https://doi.org/10.1016/j.tra.2005.11.003. Li, D., Fu, B., Wang, Y., Lu, G., Berezin, Y., Stanley, H. E. & Havlin, S
-
[16]
Proceedings of the National Academy of Sciences, 112, 669-672
Percolation transition in dynamical traffic network with evolving critical bottlenecks. Proceedings of the National Academy of Sciences, 112, 669-672. https://doi.org/https://doi.org/10.1073/pnas.1419185112. Mattsson, L. -G. & Jenelius, E
-
[17]
Transportation research part A: policy and practice, 81, 16-34
Vulnerability and resilience of transport systems –A discussion of recent research. Transportation research part A: policy and practice, 81, 16-34. https://doi.org/https://doi.org/10.1016/j.tra.2015.06.002. Meng, Q. & Yang, H
-
[18]
Transportation Research Part B: Methodological, 36, 19-35
Benefit distribution and equity in road network design. Transportation Research Part B: Methodological, 36, 19-35. https://doi.org/https://doi.org/10.1016/S0191-2615(00)00036-9. Page 31 of 31 Meng, Q., Yang, H. & Bell, M. G
-
[19]
Transportation Research Part B: Methodological, 35, 83-105
An equivalent continuously differentiable model and a locally convergent algorithm for the continuous network design problem. Transportation Research Part B: Methodological, 35, 83-105. https://doi.org/https://doi.org/10.1016/S0191-2615(00)00016-3. Mülken, O. & Blumen, A
-
[20]
Continuous -time quantum walks: Models for coherent transport on complex networks. Physics Reports, 502, 37-87. https://doi.org/https://doi.org/10.1016/j.physrep.2011.01.002. Saberi, M., Hamedmoghadam, H., Ashfaq, M., Hosseini, S. A., Gu, Z., Shafiei, S., Nair, D. J., Dixit, V., Gardner, L. & Waller , S. T
-
[21]
https://doi.org/https://doi.org/10.1038/s41467-020-15353-2. Sohn, J
-
[22]
Transportation research part A: policy and practice, 40, 491-506
Evaluating the significance of highway network links under the flood damage: An accessibility approach. Transportation research part A: policy and practice, 40, 491-506. https://doi.org/https://doi.org/10.1016/j.tra.2005.08.006. Sullivan, J. L., Novak, D. C., Aultman-Hall, L. & Scott, D. M
-
[23]
Transportation Research Part A: Policy and Practice, 44, 323-336
Identifying critical road segments and measuring system-wide robustness in transportation networks with isolating links: A link -based capacity -reduction approach. Transportation Research Part A: Policy and Practice, 44, 323-336. https://doi.org/https://doi.org/10.1016/j.tra.2010.02.003. Taylor, M. A., Sekhar, S. V. & D'Este, G. M
-
[24]
Networks and Spatial Economics, 6, 267-291
Application of accessibility based methods for vulnerability analysis of strategic road networks. Networks and Spatial Economics, 6, 267-291. https://doi.org/https://doi.org/10.1007/s11067-006-9284-9. Wang, W., Yang, S., Stanley, H. E. & Gao, J
-
[25]
Xu, X.-Y., Wang, X.-W., Chen, D.-Y., Smith, C
https://doi.org/https://doi.org/10.1038/s41467-019-10063-w. Xu, X.-Y., Wang, X.-W., Chen, D.-Y., Smith, C. M. & Jin, X.-M
-
[26]
Quantum transport in fractal networks. Nature Photonics, 15, 703-710. https://doi.org/https://doi.org/10.1038/s41566-021-00845-4. Zeng, G., Li, D., Guo, S., Gao, L., Gao, Z., Stanley, H. E. & Havlin, S
-
[27]
Proceedings of the National Academy of Sciences, 116, 23-28
Switch between critical percolation modes in c ity traffic dynamics. Proceedings of the National Academy of Sciences, 116, 23-28. https://doi.org/https://doi.org/10.1073/pnas.1801545116. Zhu, T., Yang, X., Wei, Y., Chen, A. & Wu, J
-
[28]
Communications in Transportation Research, 5, 100177
Urban rail transit resilience under different operation schemes: A percolation- based approach. Communications in Transportation Research, 5, 100177. https://doi.org/https://doi.org/10.1016/j.commtr.2025.100177
discussion (0)
Sign in with ORCID, Apple, or X to comment. Anyone can read and Pith papers without signing in.