Conditional Inference Trees and Forests for Feature Selection
Pith reviewed 2026-07-03 21:14 UTC · model grok-4.3
The pith
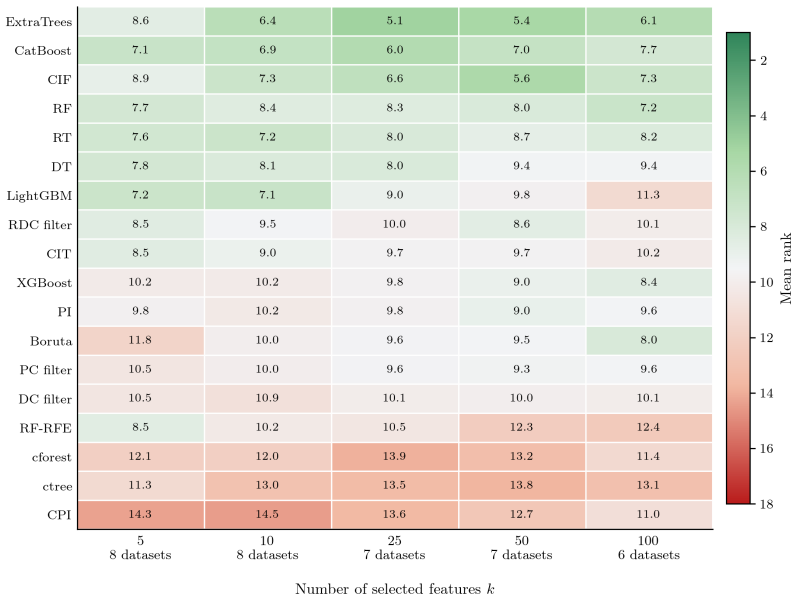
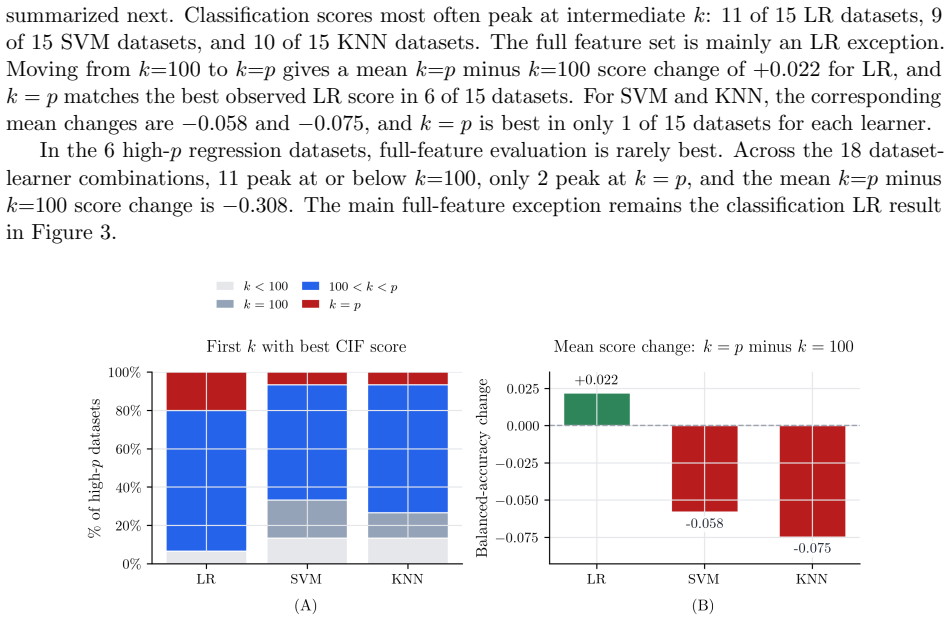
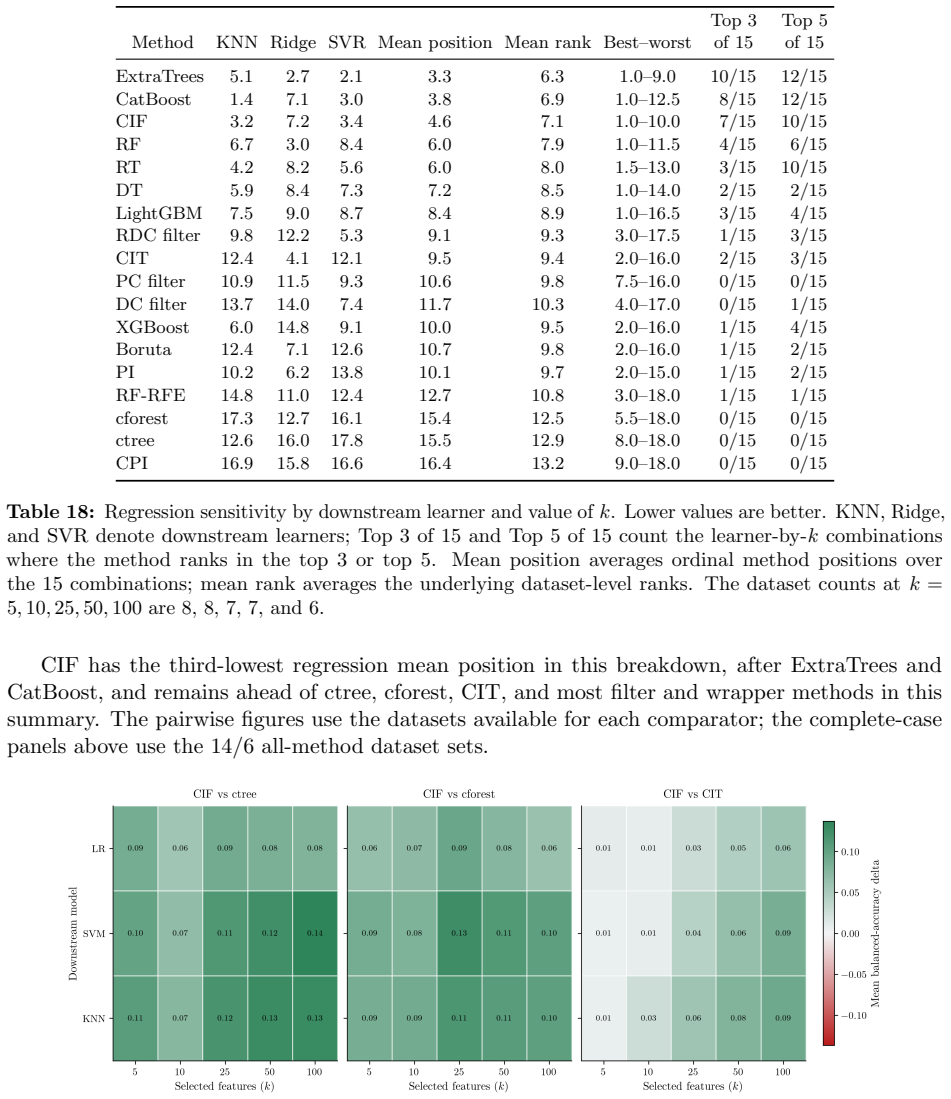
Conditional inference forests rank 4th and 3rd among feature selectors in classification and regression benchmarks.
A machine-rendered reading of the paper's core claim, the machinery that carries it, and where it could break.
Core claim
Conditional inference forests, which test each feature with a permutation p-value before choosing any split threshold, produce feature rankings that place fourth among seventeen classification methods on twenty-two datasets and third among eighteen regression methods on eight datasets, supporting their use for top-k feature selection.
What carries the argument
Bonferroni-corrected Monte Carlo permutation p-values computed at each node to decide which feature receives a split, independent of the number of thresholds tested.
If this is right
- CIF can be applied directly as a feature-ranking step before training any downstream classifier or regressor.
- Turning off adaptive stopping increases fitting time by a factor of four to eight with negligible change in final scores.
- Exact threshold search multiplies runtime by up to ten with little accuracy gain.
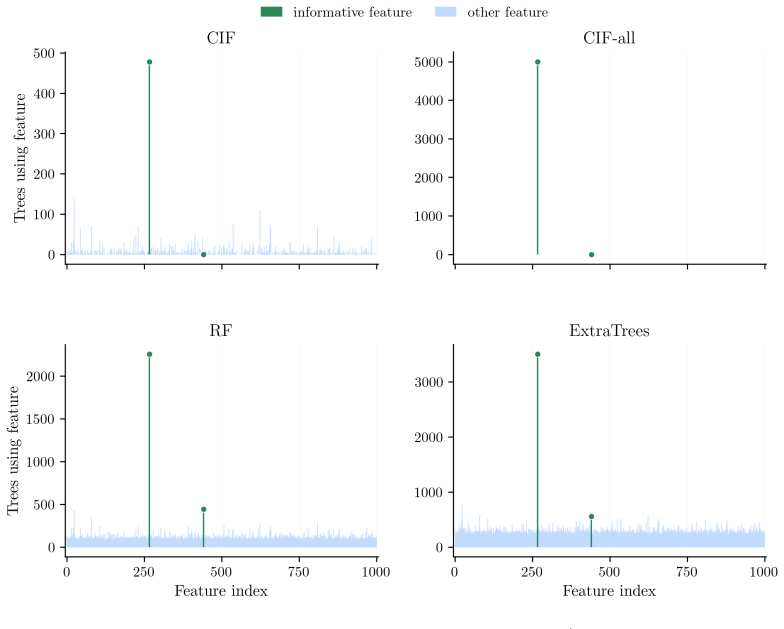
- In sparse high-dimensional settings, the random feature sampling inside the forest can exclude informative variables from many candidate splits.
Where Pith is reading between the lines
- The same permutation-test logic could be grafted onto other tree algorithms to reduce split bias without switching to full conditional inference.
- Runtime gains from adaptive stopping suggest that similar early-stopping rules might help permutation-based methods in other domains such as causal discovery.
- The observed risk that informative features are sampled out of many trees points to a need for stratified or importance-weighted sampling inside the forest.
Load-bearing premise
The collection of real and synthetic datasets used is representative of the problems where top-k feature ranking matters.
What would settle it
A new collection of thirty datasets in which CIF rankings produce downstream prediction scores that fall below the median of the other sixteen or seventeen methods.
Figures


read the original abstract
Conditional inference trees (CIT) and conditional inference forests (CIF) reduce split-selection bias by testing features before choosing split thresholds, but repeated permutation tests and threshold searches can make these methods computationally expensive. We study CIT and CIF as top-$k$ feature-ranking methods for downstream prediction using real-data benchmarks, runtime ablations, and synthetic feature-recovery experiments. At a fixed node, if the features and permutation budget do not depend on the node responses, Bonferroni-corrected $+1$ Monte Carlo permutation $p$-values control nodewise rejection under the complete permutation null. CIF ranks 4th among 17 classification methods on 22 datasets and 3rd among 18 regression methods on 8 datasets. With Bonferroni correction held fixed, the CIF runtime ablations indicate that adaptive stopping and the number of thresholds searched have the largest measured effect on runtime: turning off adaptive stopping and using exact threshold search increase fitting time by 4.0--8.4$\times$ and 1.9--10.8$\times$, respectively, while downstream score changes are at most 0.011. Sparse high-$p$ simulations indicate that forest feature sampling can leave informative features out of many split decisions. Overall, the results support CIF as a top-$k$ feature-ranking method in the evaluated downstream prediction benchmarks.
Editorial analysis
A structured set of objections, weighed in public.
Referee Report
Summary. The paper studies conditional inference trees (CIT) and forests (CIF) as top-k feature-ranking methods for downstream prediction tasks. It provides a condition under which Bonferroni-corrected +1 Monte Carlo permutation p-values control nodewise rejection under the complete permutation null, reports that CIF ranks 4th among 17 classification methods on 22 datasets and 3rd among 18 regression methods on 8 datasets, presents runtime ablations showing that adaptive stopping and threshold search have the largest effects on runtime (with downstream score changes ≤0.011), and includes synthetic feature-recovery experiments indicating that forest feature sampling can omit informative features.
Significance. If the p-value control holds and the empirical rankings are robust, the work would provide a theoretically grounded, bias-reduced alternative to standard tree-based feature selection with competitive downstream performance and quantified runtime trade-offs. The ablations and synthetic results add practical insight into implementation choices.
major comments (1)
- [Abstract and runtime ablations] Abstract (p-value control statement) and runtime ablations: The paper states that at a fixed node, Bonferroni-corrected +1 Monte Carlo permutation p-values control nodewise rejection under the complete permutation null only "if the features and permutation budget do not depend on the node responses." The runtime ablations report that turning off adaptive stopping increases fitting time by 4.0–8.4× and identify it as having the largest measured effect, implying the main reported CIF results use adaptive stopping. This makes the effective permutation budget depend on observed responses, directly violating the stated precondition and removing the claimed frequentist guarantee for the nodewise p-values that justify reduced split-selection bias and reliable top-k ranking.
minor comments (2)
- [Abstract] The abstract reports CIF ranking 4th/17 on classification and 3rd/18 on regression but does not specify whether these are mean ranks, median ranks, or win counts, nor the exact metric (e.g., AUC, accuracy) used for downstream evaluation.
- [Abstract] The synthetic experiments mention "sparse high-p simulations" but the abstract does not report the exact dimensions (p, n, sparsity level) or recovery metric, making it hard to assess how representative they are of the real-data regime.
Simulated Author's Rebuttal
We thank the referee for the careful review and for pointing out the potential inconsistency between the stated condition for p-value control and the use of adaptive stopping in the reported experiments. We respond to the major comment below.
read point-by-point responses
-
Referee: [Abstract and runtime ablations] Abstract (p-value control statement) and runtime ablations: The paper states that at a fixed node, Bonferroni-corrected +1 Monte Carlo permutation p-values control nodewise rejection under the complete permutation null only "if the features and permutation budget do not depend on the node responses." The runtime ablations report that turning off adaptive stopping increases fitting time by 4.0–8.4× and identify it as having the largest measured effect, implying the main reported CIF results use adaptive stopping. This makes the effective permutation budget depend on observed responses, directly violating the stated precondition and removing the claimed frequentist guarantee for the nodewise p-values that justify reduced split-selection bias and reliable top-k ranking.
Authors: We agree with the referee that the main CIF results utilize adaptive stopping, which causes the permutation budget to depend on the observed responses at each node, thereby violating the precondition for the nodewise p-value control result. The theoretical guarantee applies specifically to the case of fixed permutation budget independent of responses. We will revise the abstract to clarify the scope of the p-value control statement and add a note in the methods or discussion section explaining that adaptive stopping is employed for computational efficiency in the empirical evaluations, while the frequentist control is guaranteed only without it. The benchmark rankings and runtime ablation results are empirical observations and remain unchanged. This revision addresses the concern without altering the core findings. revision: yes
Circularity Check
No circularity; empirical claims rest on external benchmarks
full rationale
The paper presents no derivation chain that reduces to its inputs by construction. Its strongest claims are direct empirical rankings of CIF against 17/18 other methods on 22/8 datasets plus runtime ablations and synthetic recovery experiments. The single conditional statement on p-value control is an if-then claim about a fixed-node permutation test and is not invoked to derive the reported rankings or to rename any fitted quantity as a prediction. No self-citations, ansatzes, or uniqueness theorems appear as load-bearing steps. The work is therefore self-contained against the external benchmarks it reports.
Axiom & Free-Parameter Ledger
Reference graph
Works this paper leans on
-
[1]
Generalized random forests.The Annals of Statistics, 47(2):1148–1178, 2019
Susan Athey, Julie Tibshirani, and Stefan Wager. Generalized random forests.The Annals of Statistics, 47(2):1148–1178, 2019. doi: 10.1214/18-AOS1709
-
[2]
Sequential Monte Carlo p-values.Biometrika, 78(2):301–304,
Julian Besag and Peter Clifford. Sequential Monte Carlo p-values.Biometrika, 78(2):301–304,
-
[3]
doi: 10.1093/biomet/78.2.301
-
[4]
Random forests.Machine Learning, 45(1):5–32, 2001
Leo Breiman. Random forests.Machine Learning, 45(1):5–32, 2001. doi: 10.1023/A: 1010933404324. 17
work page doi:10.1023/a: 2001
-
[5]
Friedman, Charles J
Leo Breiman, Jerome H. Friedman, Charles J. Stone, and Richard A. Olshen.Classification and Regression Trees. Wadsworth International Group, Belmont, CA, 1984. ISBN 9780412048418
1984
-
[6]
A scalable tree boosting system
Tianqi Chen and Carlos Guestrin. A scalable tree boosting system. InProceedings of the 22nd ACM SIGKDD International Conference on Knowledge Discovery and Data Mining, pages 785–794, 2016. doi: 10.1145/2939672.2939785
-
[7]
Conditional permutation importance revisited.BMC Bioinformatics, 21(1):307, 2020
Dries Debeer and Carolin Strobl. Conditional permutation importance revisited.BMC Bioinformatics, 21(1):307, 2020. doi: 10.1186/s12859-020-03622-2
-
[8]
Exploring classification strategies with the CoEPrA 2006 contest.Bioinformatics, 26(5):603–609, 2010
Ozgur Demir-Kavuk, Henning Riedesel, and Ernst-Walter Knapp. Exploring classification strategies with the CoEPrA 2006 contest.Bioinformatics, 26(5):603–609, 2010. doi: 10.1093/ bioinformatics/btq021
2006
-
[9]
Michael D. Ernst. Permutation methods: A basis for exact inference.Statistical Science, 19(4): 676–685, 2004. doi: 10.1214/088342304000000396
-
[10]
Sequential implementation of Monte Carlo tests with uniformly bounded resampling risk.Journal of the American Statistical Association, 104(488):1504–1511, 2009
Axel Gandy. Sequential implementation of Monte Carlo tests with uniformly bounded resampling risk.Journal of the American Statistical Association, 104(488):1504–1511, 2009. doi: 10.1198/ jasa.2009.tm08368
2009
-
[11]
Variable selection using random forests.Pattern Recognition Letters, 31(14):2225–2236, 2010
Robin Genuer, Jean-Michel Poggi, and Christine Tuleau-Malot. Variable selection using random forests.Pattern Recognition Letters, 31(14):2225–2236, 2010. doi: 10.1016/j.patrec.2010.03.014
-
[12]
Extremely randomized trees.Machine Learning, 63(1):3–42, 2006
Pierre Geurts, Damien Ernst, and Louis Wehenkel. Extremely randomized trees.Machine Learning, 63(1):3–42, 2006. doi: 10.1007/s10994-006-6226-1
-
[13]
Isabelle Guyon, Jason Weston, Stephen Barnhill, and Vladimir Vapnik. Gene selection for cancer classification using support vector machines.Machine Learning, 46(1-3):389–422, 2002. doi: 10.1023/A:1012487302797
-
[14]
Result analysis of the NIPS 2003 feature selection challenge
Isabelle Guyon, Steve Gunn, Asa Ben-Hur, and Gideon Dror. Result analysis of the NIPS 2003 feature selection challenge. InAdvances in Neural Information Processing Systems, volume 17, 2004. URL https://proceedings.neurips.cc/paper_files/paper/2004/hash/ 5e751896e527c862bf67251a474b3819-Abstract.html
2003
-
[15]
Exact testing with random permutations.TEST, 27(4): 811–825, 2018
Jesse Hemerik and Jelle Goeman. Exact testing with random permutations.TEST, 27(4): 811–825, 2018. doi: 10.1007/s11749-017-0571-1
-
[16]
partykit: A modular toolkit for recursive partytioning in R.Journal of Machine Learning Research, 16(118):3905–3909, 2015
Torsten Hothorn and Achim Zeileis. partykit: A modular toolkit for recursive partytioning in R.Journal of Machine Learning Research, 16(118):3905–3909, 2015. URL https://jmlr. org/papers/v16/hothorn15a.html
2015
-
[17]
Torsten Hothorn, Peter B¨ uhlmann, Sandrine Dudoit, Annette Molinaro, and Mark J. van der Laan. Survival ensembles.Biostatistics, 7(3):355–373, 2006. doi: 10.1093/biostatistics/kxj011
-
[18]
van de Wiel, and Achim Zeileis
Torsten Hothorn, Kurt Hornik, Mark A. van de Wiel, and Achim Zeileis. A lego system for conditional inference.The American Statistician, 60(3):257–263, 2006. doi: 10.1198/ 000313006X118430
2006
-
[19]
Unbiased recursive partitioning: A condi- tional inference framework.Journal of Computational and Graphical Statistics, 15(3):651–674,
Torsten Hothorn, Kurt Hornik, and Achim Zeileis. Unbiased recursive partitioning: A condi- tional inference framework.Journal of Computational and Graphical Statistics, 15(3):651–674,
-
[20]
doi: 10.1198/106186006X133933. 18
-
[21]
URL https://CRAN.R-project.org/package=partykit
Torsten Hothorn, Heidi Seibold, and Achim Zeileis.partykit: A Toolkit for Recursive Par- tytioning, 2026. URL https://CRAN.R-project.org/package=partykit. R package version 1.2-27
2026
-
[22]
A highly efficient gradient boosting decision tree
Guolin Ke, Qi Meng, Thomas Finley, Taifeng Wang, Wei Chen, Weidong Ma, Qiwei Ye, and Tie-Yan Liu. A highly efficient gradient boosting decision tree. InAdvances in Neural Information Processing Systems, volume 30, pages 3146–3154, 2017. URL https://papers. nips.cc/paper/6907-a-highly-efficient-gradient-boosting-decision-tree
2017
-
[23]
UCI machine learning repository
Markelle Kelly, Rachel Longjohn, and Kolby Nottingham. UCI machine learning repository. https://archive.ics.uci.edu, n.d. URL https://archive.ics.uci.edu/. Accessed 2026- 05-04
2026
-
[24]
Hyunjoong Kim and Wei-Yin Loh. Classification trees with unbiased multiway splits.Journal of the American Statistical Association, 96(454):589–604, 2001. doi: 10.1198/016214501753168271
-
[25]
Miron B. Kursa and Witold R. Rudnicki. Feature selection with the Boruta package.Journal of Statistical Software, 36(11):1–13, 2010. doi: 10.18637/jss.v036.i11
-
[26]
Trevino, Jiliang Tang, and Huan Liu
Jundong Li, Kewei Cheng, Suhang Wang, Fred Morstatter, Robert P. Trevino, Jiliang Tang, and Huan Liu. Feature selection: A data perspective.ACM Computing Surveys, 50(6):94:1–94:45,
-
[27]
doi: 10.1145/3136625
-
[28]
Regression trees with unbiased variable selection and interaction detection.Sta- tistica Sinica, 12(2):361–386, 2002
Wei-Yin Loh. Regression trees with unbiased variable selection and interaction detection.Sta- tistica Sinica, 12(2):361–386, 2002. URL https://www3.stat.sinica.edu.tw/statistica/ j12n2/j12n21/j12n21.htm
2002
-
[29]
Split selection methods for classification trees.Statistica Sinica, 7(4):815–840, 1997
Wei-Yin Loh and Yu-Shan Shih. Split selection methods for classification trees.Statistica Sinica, 7(4):815–840, 1997. URL https://www3.stat.sinica.edu.tw/statistica/j7n4/ j7n41/j7n41.htm
1997
-
[30]
The Randomized Dependence Coefficient
David Lopez-Paz, Philipp Hennig, and Bernhard Sch¨ olkopf. The randomized dependence coefficient, 2013. arXiv:1304.7717
work page internal anchor Pith review Pith/arXiv arXiv 2013
-
[31]
B. V. North, David Curtis, and Pak C. Sham. A note on the calculation of empirical P values from Monte Carlo procedures.American Journal of Human Genetics, 71(2):439–441, 2002. doi: 10.1086/341527
-
[32]
Scikit-learn: Machine learning in Python.Journal of Machine Learning Research, 12(85):2825–2830, 2011
Fabian Pedregosa, Ga¨ el Varoquaux, Alexandre Gramfort, Vincent Michel, Bertrand Thirion, Olivier Grisel, Mathieu Blondel, Peter Prettenhofer, Ron Weiss, Vincent Dubourg, Jake VanderPlas, Alexandre Passos, David Cournapeau, Matthieu Brucher, Matthieu Perrot, and ´Edouard Duchesnay. Scikit-learn: Machine learning in Python.Journal of Machine Learning Resea...
2011
-
[33]
Belinda Phipson and Gordon K. Smyth. Permutation P-values should never be zero: Calculating exact P-values when permutations are randomly drawn.Statistical Applications in Genetics and Molecular Biology, 9(1):1–12, 2010. doi: 10.2202/1544-6115.1585
-
[34]
Unbiased boosting with categorical features
Liudmila Ostroumova Prokhorenkova, Gleb Gusev, Aleksandr Vorobev, Anna Veronika Doro- gush, and Andrey Gulin. Unbiased boosting with categorical features. InAdvances in Neural Information Processing Systems, volume 31, pages 6639–6649, 2018. URL https://papers. nips.cc/paper/7898-catboost-unbiased-boosting-with-categorical-features. 19
2018
-
[35]
Yu-San Shih. A note on split selection bias in classification trees.Computational Statistics & Data Analysis, 45(3):457–466, 2004. doi: 10.1016/S0167-9473(03)00064-1
-
[36]
The asymptotic theory of permutation statistics
Helmut Strasser and Christian Weber. The asymptotic theory of permutation statistics. Mathematical Methods of Statistics, 8(2):220–250, 1999
1999
-
[37]
Carolin Strobl, Anne-Laure Boulesteix, and Thomas Augustin. Unbiased split selection for classification trees based on the Gini index.Computational Statistics & Data Analysis, 52(1): 483–501, 2007. doi: 10.1016/j.csda.2006.12.030
-
[38]
Carolin Strobl, Anne-Laure Boulesteix, Achim Zeileis, and Torsten Hothorn. Bias in random forest variable importance measures: Illustrations, sources and a solution.BMC Bioinformatics, 8(1):25, 2007. doi: 10.1186/1471-2105-8-25
-
[39]
Conditional variable importance for random forests.BMC Bioinformatics, 9(1):307, 2008
Carolin Strobl, Anne-Laure Boulesteix, Thomas Kneib, Thomas Augustin, and Achim Zeileis. Conditional variable importance for random forests.BMC Bioinformatics, 9(1):307, 2008. doi: 10.1186/1471-2105-9-307
-
[40]
Sz´ ekely, Maria L
G´ abor J. Sz´ ekely, Maria L. Rizzo, and Nail K. Bakirov. Measuring and testing dependence by correlation of distances.The Annals of Statistics, 35(6):2769–2794, 2007. doi: 10.1214/ 009053607000000505
2007
-
[41]
van Rijn, Bernd Bischl, and Luis Torgo
Joaquin Vanschoren, Jan N. van Rijn, Bernd Bischl, and Luis Torgo. OpenML: Networked science in machine learning.ACM SIGKDD Explorations Newsletter, 15(2):49–60, 2013. doi: 10.1145/2641190.2641198. URLhttps://doi.org/10.1145/2641190.2641198
-
[42]
Estimation and inference of heterogeneous treatment effects using random forests.Journal of the American Statistical Association, 113(523):1228–1242,
Stefan Wager and Susan Athey. Estimation and inference of heterogeneous treatment effects using random forests.Journal of the American Statistical Association, 113(523):1228–1242,
-
[43]
Variational inference: A review for statisticians,
doi: 10.1080/01621459.2017.1319839. 20 Appendix A Setup and assumptions A.1 Fixed-node setup Let (Xi, Yi)n i=1 be the training data. Fix a node t with sample index set It and size nt := |It|. Write Xt := (Xi)i∈It and Yt := (Yi)i∈It for the data restricted to that node. Stage A tests features Ft with mt :=|F t|. The fixed-node theorem analyzes the exhausti...
discussion (0)
Sign in with ORCID, Apple, or X to comment. Anyone can read and Pith papers without signing in.