REVIEW 4 major objections 5 minor 25 references
A Preliminary Study on Explaining Risk of Code Changes using LLM-Based Prediction Models
T0 review · 4 major / 5 minor · reviewed 2026-07-12 · grok-4.5
Pith's one-line read Attention from an LLM risk model can flag the hunks that experts say caused outages, covering them about half the time while reviewing only a quarter of the change.
desk verdict Solid industrial engineering note on attention-to-hunk highlighting for DRS, but the 53.85% headline rests on ~13 expert-labeled outages with no baseline or uncertainty. read the letter →
The pith
A machine-rendered reading of the paper's core claim, the machinery that carries it, and where it could break.
The reading
What carries the argument
Hierarchical attention aggregation: last-layer multi-head attention over the single risk token is averaged, reconstituted into tokens/lines/hunks/files, and scored with level-specific functions (mean at token/line/file, top-k sum at hunk) so that the top-K units can be returned as a review budget.
What would settle it
On a larger set of expert-labeled outages, measure whether top-2 hunk highlights still cover root-cause lines at roughly 50 percent while keeping review burden near 25 percent; a large drop in coverage or a large rise in review percent would falsify the claimed operating point.
Extended reading notes
Core claim
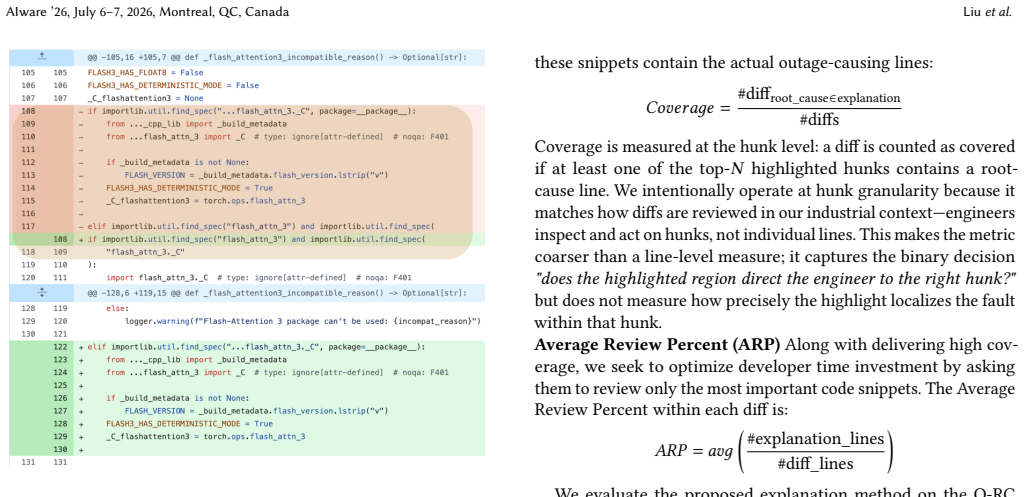
Aggregated last-layer attention from a fine-tuned LLM risk model, mapped to code hunks, covers expert-annotated outage-causing lines 53.85 percent of the time when the top two hunks are highlighted, at an average review cost of 26.28 percent of the changed lines—providing a low-latency, actionable alternative to a bare risk score.
Load-bearing premise
That averaged last-layer attention, after test-file nullification, is a useful enough pointer to the places that actually caused outages even though the authors do not claim it is a faithful explanation of the model's reasoning.
Editorial analysis
A structured set of objections, weighed in public.
Referee Report
Summary. The paper proposes a pragmatic explainability method for an industrial LLM-based Diff Risk Score (DRS) model: last-layer attention over the one-token risk classification is pooled across heads, mapped through a hierarchical token→line→hunk→file aggregation, and the top-K units are highlighted in the code-review UI. Evaluation uses an expert-curated Outage Root Cause (O-RC) set of real outage-causing diffs; the headline result is that top-2 hunks cover expert-labeled root-cause lines 53.85% of the time at 26.28% average review percent (ARP). The authors explicitly disclaim causal faithfulness of attention and report early UI feedback (7 positive / 48 negative).
Significance. Just-in-time defect prediction at FAANG scale is a real operational problem, and the lack of actionable localization is a genuine adoption barrier for LLM risk scores. Using free attention as a low-latency highlighting signal is a practical engineering contribution, and validating against independently collected expert root-cause labels of real outages (rather than against the attention signal itself) is the right evaluation design. The hierarchical aggregation and tokenizer-agnostic pipeline are carefully specified. If the coverage–effort numbers hold under proper uncertainty quantification and baselines, the work would be a useful applied step toward deployable explanations for industrial JIT risk models. The preliminary framing and industrial context are appropriate strengths.
major comments (4)
- Table 1 / §4.1–4.2: The central claim (Abstract; top-2 hunks cover root-cause lines 53.85% of the time at 26.28% ARP) rests on percentages that are exact k/N fractions only for N≈13 (e.g., 4/13, 7/13, 12/13). The O-RC construction is described as manually curated with four experts and high-confidence primary labels, but N is never stated, no confidence intervals or binomial/bootstrap uncertainty is reported, and no statistical comparison is given. With N≈13 the SE on 7/13 is ~0.14, so the headline number is compatible with many nulls. Please report N, per-granularity counts, and uncertainty; without this the coverage claim cannot support “measurably improving over the current production baseline of no highlighting.”
- §4.2 and §7: There is no baseline against which coverage at a given ARP is compared—no random-hunk, size-matched, first-K-hunks, or attention-scrambled control. Coverage of 53.85% at 26% review budget is only informative relative to what a developer would hit by inspecting a comparable fraction of the diff under a null policy. A size-matched or random top-K hunk baseline (and ideally a coverage–effort curve / AUCU as the authors themselves mention) is load-bearing for the claim that attention-based highlighting is useful rather than merely non-zero.
- §3.4.3 / Table 2: Hunk-level aggregation is top-k sum with k=20, chosen “empirically based on a held-out validation set,” but neither the held-out set size/composition nor sensitivity of coverage/ARP to k (or to mean vs. sum vs. max) is reported. Because free parameters (top-K budget, k, and the 16 test-file nullification regexes) directly determine the Table 1 operating point, a short ablation or sensitivity table is needed to show the result is not an artifact of that choice.
- §4.4 and §6: Early UI feedback is 48 negative vs. 7 positive, with concrete failure modes (test/codegen highlights, boilerplate, polarity ambiguity). The conclusions still claim the signal “makes … predictions actionable” and “may increase engineer trust.” Either temper the actionability/trust claims to match the feedback, or present a clearer plan (and, if available, any post-filter metrics) showing how the known failure modes affect the O-RC coverage numbers.
minor comments (5)
- §4.1: Typo “a an Outage Root Cause (O-RC) dataset”.
- §3.2 / Figure 1 vs. Figure 2: The text says “we apply the prompt demonstrated in Figure 1,” but Figure 1 is the redacted code-review UI; the prompt is associated with Figure 2. Clarify figure references.
- Table 1 header uses “Precision” for what §4.2 defines as Coverage; rename the column to Coverage for consistency.
- §3.4.4: “16 regular expressions” for test-file nullification are mentioned but not listed or characterized (languages covered, false-negative rate). A short appendix list would aid reproducibility.
- Related work (§5) correctly notes that XAI for deep JIT models is sparse; a brief explicit comparison to saliency/gradient alternatives (even if only as future work cost/latency argument) would strengthen the design rationale for attention.
Circularity Check
No load-bearing circularity: coverage is an empirical match of free attention byproduct to independently curated expert root-cause labels.
full rationale
The paper’s central quantitative claim (top-2 hunks cover expert-labeled outage lines 53.85 % of the time at 26.28 % ARP) is obtained by running an already-trained DRS model, extracting last-layer attention as a free byproduct of ordinary inference, aggregating it hierarchically, and measuring overlap against a separately curated O-RC set of expert-annotated outage root-cause lines. Attention is never fitted or trained on the O-RC labels; the aggregation functions were chosen on a held-out validation set and then frozen. Self-citations to prior DRS papers supply the base risk model but do not force the coverage numbers, which remain an independent empirical measurement. No equation equates a fitted quantity to a claimed prediction, no uniqueness theorem is imported to forbid alternatives, and no known result is merely renamed. Minor self-citation of the production DRS system is present but not load-bearing for the explanation-quality claim, yielding only a residual score of 1.
Assumptions & free parameters
free parameters (3)
- top-K hunk budget =
2
- hunk-level top-k sum (k) =
20
- test-file nullification regex set =
16 regexes
assumptions (3)
- domain assumption Last-layer multi-head attention averaged over heads is a useful importance signal for localizing risk inside a diff
- domain assumption Expert-annotated outage-causing lines constitute reliable ground truth for explanation quality
- ad hoc to paper Hunk-level binary coverage is the right success criterion for developer utility
Cite this review
Pith. "Pith review of A Preliminary Study on Explaining Risk of Code Changes using LLM-Based Prediction Models." pith.science (2026). https://pith.science/paper/6GLPYUBM
@misc{pith2026260702782,
  author       = {Pith},
  title        = {Pith review of: A Preliminary Study on Explaining Risk of Code Changes using LLM-Based Prediction Models},
  year         = {2026},
  howpublished = {\url{https://pith.science/paper/6GLPYUBM}},
  note         = {Machine review of arXiv:2607.02782}
}
read the original abstract
Predictions by machine learning (ML) and artificial intelligence (AI) models are often received skeptically unless they are paired with intelligible explanations. In the context of just-in-time defect prediction, highlighting small portions of a software change (diff) -- beyond rule-based lints -- where risk may be concentrated has not yet been extensively investigated. In this work, we leverage attention weights from an LLM-based Diff Risk Score (DRS) model to highlight parts of a diff that the model focuses on when predicting risk. We aggregate token-level attention into interpretable code units (lines, hunks, and files), and present the top-K units to developers as a lightweight form of guidance during code review. We evaluate our approach using expert-labeled changes that have caused real outages. Results show that the highlighted snippets cover expert-labeled outage-causing change lines 53.85% of the time when highlighting the top-2 hunks, while requiring developers to review 26.28% of the changed lines on average. Because attention is produced during standard model inference, the approach is scalable for large development workflows and can be surfaced in the code review UI with low additional latency.
Figures


Figures from the paper (1 more)
Reference graph
Works this paper leans on
-
[1]
Rui Abreu, Vijayaraghavan Murali, Peter C Rigby, Chandra Maddila, Weiyan Sun, Jun Ge, Kaavya Chinniah, Audris Mockus, Megh Mehta, and Nachiappan Nagappan. 2025. Moving Faster and Reducing Risk: Using LLMs in Release Deployment.ICSE 2025(2025)
2025
-
[2]
Vijay Arya, Rachel K. E. Bellamy, Pin-Yu Chen, Amit Dhurandhar, Michael Hind, Samuel C. Hoffman, Stephanie Houde, Q. Vera Liao, Ronny Luss, Aleksandra Mojsilović, Sami Mourad, Pablo Pedemonte, Ramya Raghavendra, John Richards, Prasanna Sattigeri, Karthikeyan Shanmugam, Moninder Singh, Kush R. Varshney, Dennis Wei, and Yunfeng Zhang. 2022. AI Explainabilit...
-
[3]
Hoa Khanh Dam, Truyen Tran, and Aditya Ghose. 2018. Explainable software an- alytics. InProceedings of the 40th international conference on software engineering: New ideas and Emerging results. 53–56
2018
-
[4]
Henk W De Regt. 2020. Understanding, values, and the aims of science.Philosophy of Science87, 5 (2020), 921–932
2020
-
[5]
Henk W De Regt and Dennis Dieks. 2005. A contextual approach to scientific understanding.Synthese144 (2005), 137–170
2005
-
[6]
Geanderson Esteves, Eduardo Figueiredo, Adriano Veloso, Markos Viggiato, and Nivio Ziviani. 2020. Understanding machine learning software defect predictions. Automated Software Engineering27, 3 (2020), 369–392
2020
-
[7]
Daniel Fryer, Inga Strümke, and Hien Nguyen. 2021. Shapley values for feature selection: The good, the bad, and the axioms.Ieee Access9 (2021), 144352–144360
2021
-
[8]
Brian Hu, Paul Tunison, Brandon RichardWebster, and Anthony Hoogs. 2023. Xaitk-saliency: An open source explainable ai toolkit for saliency. InProceedings A Preliminary Study on Explaining Risk of Code Changes using LLM-Based Prediction Models AIware ’26, July 6–7, 2026, Montreal, QC, Canada of the AAAI Conference on Artificial Intelligence, Vol. 37. 15760–15766
2023
Show all 25 references
-
[9]
Sarthak Jain and Byron C Wallace. 2019. Attention is not explanation.arXiv preprint arXiv:1902.10186(2019)
2019 arXiv
-
[10]
Narine Kokhlikyan, Vivek Miglani, Miguel Martin, Edward Wang, Bilal Alsallakh, Jonathan Reynolds, Alexander Melnikov, Natalia Kliushkina, Carlos Araya, Siqi Yan, and Orion Reblitz-Richardson. 2020. Captum: A unified and generic model interpretability library for PyTorch.arXiv ...
2020 arXiv
-
[11]
Mario Krenn, Robert Pollice, Si Yue Guo, Matteo Aldeghi, Alba Cervera-Lierta, Pascal Friederich, Gabriel dos Passos Gomes, Florian Häse, Adrian Jinich, Ak- shatKumar Nigam, et al. 2022. On scientific understanding with artificial intelli- gence.Nature Reviews Physics4, 12 (202...
2022
-
[12]
Shengzhong Liu, Franck Le, Supriyo Chakraborty, and Tarek Abdelzaher. 2021. On exploring attention-based explanation for transformer models in text clas- sification. In2021 IEEE International Conference on Big Data (Big Data). IEEE, 1193–1203
2021
-
[13]
Prashan Madumal, Tim Miller, Liz Sonenberg, and Frank Vetere. 2020. Explain- able reinforcement learning through a causal lens. InProceedings of the AAAI conference on artificial intelligence, Vol. 34. 2493–2500
2020
-
[14]
Rupayan Mallick, Jenny Benois-Pineau, and Akka Zemmari. 2022. I Saw: A Self-Attention Weighted Method for Explanation of Visual Transformers. In2022 IEEE International Conference on Image Processing (ICIP). 3271–3275. doi:10.1109/ ICIP46576.2022.9897347
2022
-
[15]
Audris Mockus, Rui Abreu, Peter C Rigby, David Amsallem, Parveen Bansal, Kaavya Chinniah, Brian Ellis, Peng Fan, Jun Ge, Bingjie He, Kelly Hirano, Sahil Kumar, Ajay Lingapuram, Andrew Loe, Megh Mehta, Venus Montes, Maher Saba, Gursharan Singh, Matt Steiner, Weiyan Sun, Siri Up...
2025
-
[16]
Ahmad Haji Mohammadkhani, Nitin Sai Bommi, Mariem Daboussi, Onkar Sabnis, Chakkrit Tantithamthavorn, and Hadi Hemmati. 2023. A systematic literature review of explainable AI for software engineering.arXiv preprint arXiv:2302.06065 (2023)
2023 arXiv
-
[17]
Judea Pearl. 2019. The seven tools of causal inference, with reflections on machine learning.Commun. ACM62 (2019), 54–60
2019
-
[18]
Mukund Sundararajan and Amir Najmi. 2020. The many Shapley values for model explanation. InInternational conference on machine learning. PMLR, 9269–9278
2020
-
[19]
Hugo Touvron, Louis Martin, Kevin Stone, Peter Albert, Amjad Almahairi, Yas- mine Babaei, Nikolay Bashlykov, Soumya Batra, Prajjwal Bhargava, Shruti Bhos- ale, et al. 2023. Llama 2: Open foundation and fine-tuned chat models.arXiv preprint arXiv:2307.09288(2023)
2023 arXiv
-
[20]
Martin Tutek and Jan Šnajder. 2020. Staying true to your word:(how) can attention become explanation?arXiv preprint arXiv:2005.09379(2020)
2020 arXiv
-
[21]
Bingyang Wen, KP Subbalakshmi, and Fan Yang. 2022. Revisiting attention weights as explanations from an information theoretic perspective.arXiv preprint arXiv:2211.07714(2022)
2022 arXiv
-
[22]
Feiyu Xu, Hans Uszkoreit, Yangzhou Du, Wei Fan, Dongyan Zhao, and Jun Zhu
-
[23]
InNatural language processing and Chinese computing: 8th cCF interna- tional conference, NLPCC 2019, dunhuang, China, October 9–14, 2019, proceedings, part II 8
Explainable AI: A brief survey on history, research areas, approaches and challenges. InNatural language processing and Chinese computing: 8th cCF interna- tional conference, NLPCC 2019, dunhuang, China, October 9–14, 2019, proceedings, part II 8. Springer, 563–574
2019
-
[24]
Jinqiang Yu, Michael Fu, Alexey Ignatiev, Chakkrit Tantithamthavorn, and Peter Stuckey. 2024. A Formal Explainer for Just-In-Time Defect Predictions.ACM Transactions on Software Engineering and Methodology33, 7 (2024), 1–31
2024
-
[25]
Yunhua Zhao, Kostadin Damevski, and Hui Chen. 2023. A systematic survey of just-in-time software defect prediction.Comput. Surveys55, 10 (2023), 1–35. Received 2026-02-15; accepted 2026-03-28
2023
Reviewed July 12, 2026 · model on record in the stance chip above.
Discussion (0). Continue with ORCID to comment.