REVIEW 3 major objections 5 minor 28 references
Velocity- and Regime-Aware Detection of Intraday Options Market Manipulation, with Explainable Attribution
T0 review · 3 major / 5 minor · reviewed 2026-08-08 · deepseek-v4-flash
Pith's one-line read One minute-level velocity signature of pump-and-crash manipulation recovers all ten regulator-identified options-manipulation days and transfers to U.S. equities.
desk verdict Careful time-partitioned evaluation and honest negative results, but the central 'velocity' claim is not backed by the paper's own SHAP numbers or an ablation. read the letter →
The pith
A machine-rendered reading of the paper's core claim, the machinery that carries it, and where it could break.
The reading
What carries the argument
The load-bearing object is the smoothed state-velocity feature $v_t = |\bar{\Delta}^{(15)}_t - \bar{\Delta}^{(15)}_{t-1}|/(\tau_t - \tau_{t-1})/\text{minute}$, the absolute one-minute rate of change of the trailing 15-observation mean of option $\Delta$, blanked when quote gaps fall outside 0.5–2 minutes and grouped by day to avoid overnight jumps. This feature writes the minute-scale pump-then-crash sequence into every row, so even a row-level autoencoder can see the dynamic. For equities, the same shape is captured by a prespecified pump-reversal score (price rises over ten minutes, gives back within five, weighted by volume participation), and exact SHAP attribution (enumerating all $2^3$ feature coalitions) explains each alert in units of reconstruction error.
What would settle it
Audit the 31 unconfirmed BANKNIFTY alert days (41 alerts minus the 10 regulator-identified days) using participant-attributed order data or later adjudication: if none shows manipulative trading, or if the SHAP profile of those alerts matches ordinary crisis days as closely as it matches the confirmed days, the precision floor is a detector failure and the practical-utility claim is weakened.
Extended reading notes
Core claim
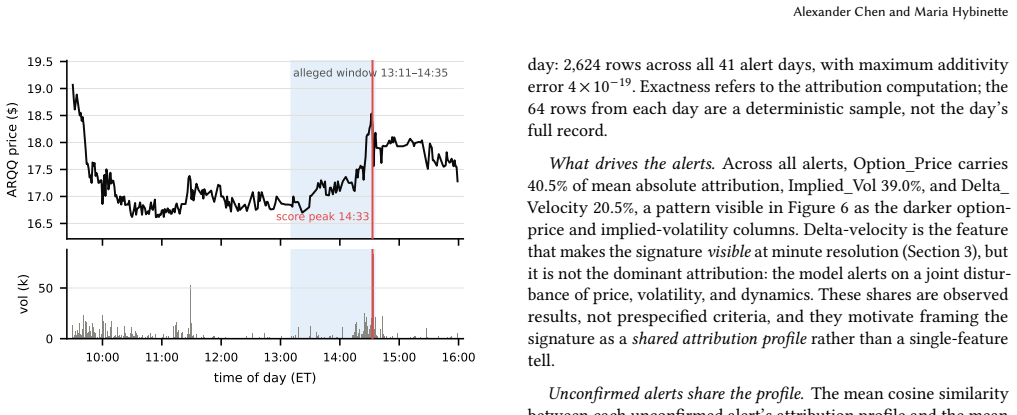
The central discovery is that a specific dynamic pattern, called the "Mountain," separates manipulation from ordinary volatility: option $\Delta$ is forced up sharply over minutes and crashes back, producing two large velocity spikes. The paper builds a feature that measures this rate of change directly, $\Delta$ velocity, and shows that a plain autoencoder trained on it recovers 10 of 10 regulator-identified manipulation days in the sequestered 2024 BANKNIFTY test, while a pump-reversal shape score ranks SEC-alleged days at AUC 0.91 (ARQQ) and 0.81 (ACY). The paper also reports a negative result: conditioning detection on hidden-Markov volatility regimes trades recall for precision and does not resolve the manipulation-volatility overlap. Attribution over every alert shows unconfirmed alerts share the regulator-identified days' attribution profile (cosine similarity 0.9894), which the authors read as consistent with incomplete enforcement labels.
Load-bearing premise
The claim that near-25 percent precision is a label-completeness floor rather than detector failure rests on the assumption that the unconfirmed alerts sharing the regulator-identified days' attribution profile are themselves manipulation; the paper concedes those days could simply be extreme-but-legitimate volatility.
Editorial extensions
If this is right
- A public-data velocity screen can rank trading days for forensic review: in the BANKNIFTY case it flags all ten regulator-identified days and 31 additional unconfirmed days that share their attribution profile.
- Regime-aware detection does not separate manipulation from legitimate volatility; the hidden-Markov conditioning only reduces alert volume at the cost of recall, so the bottleneck is label scope, not architecture.
- The shape of the signature transfers across instrument types, but its magnitude does not, so velocity-based detectors should be designed around shape, not thresholds on raw magnitude.
- Days attributed to marking the close (rather than pump-and-reversal) are poorly visible to velocity screens, indicating that suppression-style manipulation requires participant-attributed data rather than public price bars.
Reading between the lines
- If the label-incompleteness reading is correct, the same detector should flag additional days when future enforcement orders or adjudications expand the labeled set; this is a testable prediction the paper does not itself make.
- The cosine-similarity attribution profile could be used as a triage score in practice, but the paper's own caveat means a shared profile is not a fingerprint; it needs validation against independently adjudicated normal days.
- A natural extension is to test whether the velocity signature detects pump-and-dump episodes in other thin markets such as crypto or small-cap equities, where enforcement labels exist but are scarce.
- The marking-the-close negative result suggests a hybrid screen: public velocity shape for pump-reversals, and participant-attributed volume share for suppression, mirroring the two enforcement mechanisms.
Editorial analysis
A structured set of objections, weighed in public.
Referee Report
Summary. The paper proposes a minute-level detection pipeline for intraday market manipulation based on a "pump-and-crash" signature in the velocity of market state: option-Delta velocity for BANKNIFTY index options and price-velocity shape scores for U.S. equities. The protocol is strictly time-partitioned: models are trained on 2022, thresholds are calibrated on 2023 and locked, and 2024 is held out. The plain autoencoder is reported to recover 10 of 10 regulator-identified manipulation days on the locked 2024 test, at roughly 24% closed-world precision. A hidden-Markov-regime conditioning experiment yields a negative result, and exact SHAP attribution over alert days is used to argue that unconfirmed alerts share the attribution profile of regulator-identified days. Cross-market validation on SEC v. Patel equities alleges transfer of the shape signature with AUC 0.91 for ARQQ and 0.81 for ACY.
Significance. If the central velocity claim holds, the paper provides a rare enforcement-linked, leakage-safe evaluation of manipulation detection at minute resolution, with a clean time-partitioned protocol, locked thresholds, and exact SHAP attribution. These are real strengths: the protocol prevents label leakage, the SHAP additivity error is machine-checked, and the claimed transfer to a different market and instrument is an unusual falsifiable result. However, the significance depends on the velocity feature actually being the operative signal, and the current evidence for that is indirect: no ablation or feature-subset rerun is reported, and the SHAP attribution assigns Delta_Velocity only 20.5% of average absolute attribution. The interpretation of the roughly 25% precision as a floor due to incomplete enforcement labels is plausible but not demonstrated, and the label set itself was selected by a profitability screen. The paper is honest about many of these limitations, but the load-bearing claims need additional verification before the contribution can be accepted as stated.
major comments (3)
- [Section 7, Figure 6, Table 1] The central claim of a "velocity-based" detector is not supported by the attribution evidence. Section 7 reports mean absolute SHAP attribution of Option_Price 40.5%, Implied_Vol 39.0%, and Delta_Velocity 20.5% across the 41 alert days, so the model's decisions are dominated by static price and volatility features rather than by the Eq. (1) velocity feature. No experiment removes Delta_Velocity from the feature set or reruns the locked-evaluation protocol with price and implied volatility only. Without such an ablation or a two-feature rerun, the 10/10 recall could be driven by generic price/volatility outliers that coincide with the labeled days; the title's velocity mechanism would then be a narrative overlay rather than the operative signal. This is load-bearing because the cross-market transfer in Section 6 uses a different shape score and therefore cannot validate the BANKNIFTY autoencoder's mechanism. Please add a locked-threshold ablation or a two-feature rerun, and report whether recall and precision change.
- [Section 8, "Label scope" and Section 5] The interpretation of the roughly 25% precision as a floor caused by incomplete enforcement labels is an unverified assumption, not a demonstrated result. Section 8 states that the enforcement order formed its labeled set by selecting the 30 most profitable days for minute-level review, and that unlisted days are unverified. The paper's own Section 7 concession that "a shared profile could also characterize extreme days in general rather than manipulation in particular" acknowledges the alternative: the unconfirmed alerts may be ordinary extreme-volatility days, in which case the low precision reflects genuine detector failure. The matched comparison in Section 7 is suggestive but does not resolve this, because it only shows that identified days differ from calm non-alert days, not that unconfirmed alerts are manipulation-like. Please either provide a falsifiable test that distinguishes these hypotheses (for example, using contract-level or event-context evidence on a sample of unconfirmed alerts) or materially weaken the claim that the precision ceiling is consistent with label incompleteness rather than detector failure.
- [Section 6, "prespecified pump-reversal shape score"] The cross-market validation relies on a shape-score parameterization described as "prespecified," but no evidence is provided that the 10-minute rise and 5-minute give-back windows, or the volume participation weighting, were locked before the SEC v. Patel data were examined. This matters because the ACY result is weaker (AUC 0.81), and the paper reports that an unweighted variant outperforms the prespecified primary on ACY (0.87 versus 0.81), which suggests sensitivity to the scoring rule. Please report the source and date of prespecification, or provide a parameter-sensitivity analysis showing that the AUC conclusions are robust to reasonable perturbations of the windows. Without this, the cross-market transfer claim is not fully established.
minor comments (5)
- [Equation (1)] In Eq. (1), the denominator is written as "(tau_t - tau_{t-1})/minute"; please clarify the intended units and state explicitly that on uninterrupted one-minute data the velocity is expressed in Delta change per minute.
- [Section 7] The SHAP "exactness" is exact only for the deterministic 64-row sample per alert day, not for the full day's record; the paper says this, but the abstract and contribution list state "exact SHAP attribution over every alert" without that qualification. Please make the sampling explicit in the contribution statement.
- [Figure 6] The caption states that rows are not normalized to sum to one and that one color scale applies to both panels; this makes it difficult to compare attribution profiles across rows. Consider adding normalized profiles in a supplementary figure.
- [Reference [8]] The primary data source is a Kaggle dataset without a persistent DOI or versioned identifier; a frozen working copy is mentioned, but please include a checksum or a more permanent archival location to support reproducibility.
- [Section 5] The sentence "A detector built for the pump-and-reversal signature reported, accurately, which days contain that signature" is more definitive than the evidence supports; the detector was built with a three-feature set including price and volatility, not velocity alone, so "accurately" should be qualified.
Circularity Check
No significant circularity: the held-out test recall is a genuine out-of-sample result under locked thresholds.
full rationale
The paper's central claims are supported by a strictly time-partitioned protocol: the autoencoder is trained on 2022, thresholds are calibrated on 2023, and the 2024 test set is sequestered until after thresholds are locked. The 10/10 recall on regulator-identified days is therefore not forced by construction: the test labels were not used to set the detection thresholds, and the model could have failed on those days. The Delta-velocity feature is indeed motivated by the documented pump-and-crash signature, but that is standard feature engineering informed by the known phenomenon; the evaluation still requires the feature to generalize to held-out days, which it does according to the reported results. The cross-market shape score is likewise applied to complaint-labeled ticker-days, but the labels are legal allegations, not a re-encoding of the score's 10-minute/5-minute parameters, so the AUC results remain empirical. The paper also reports honest negative results (regime conditioning trades recall for precision), discloses that Delta_Velocity carries only 20.5% of SHAP attribution, and explicitly concedes that a shared attribution profile could characterize extreme days generally rather than manipulation specifically. No load-bearing self-citation or uniqueness theorem is invoked. The only concerns—prespecification evidence for the shape-score parameters and the absence of a velocity-ablation experiment—are reproducibility and evidentiary issues, not circularity. Under the stated criteria, no derivation step reduces by definition to its inputs.
Assumptions & free parameters
free parameters (3)
- Delta smoothing window length =
15 observations
- Row and daily hit-rate alert thresholds =
Calibrated on 2023 validation data
- Pump-reversal shape score windows =
Rise: 10 minutes; give-back: 5 minutes
assumptions (4)
- domain assumption Black-Scholes Delta is an adequate summary of option market state for detecting the manipulation signature.
- domain assumption The public one-minute BANKNIFTY options dataset is accurate and complete enough to compute the velocity features.
- domain assumption Unlabeled days are unverified, not normal, so the closed-world precision is a floor, not a point estimate.
- ad hoc to paper The manipulation signature is best represented by pump-and-reversal dynamics in Delta velocity.
Cite this review
Pith. "Pith review of Velocity- and Regime-Aware Detection of Intraday Options Market Manipulation, with Explainable Attribution." pith.science (2026). https://pith.science/paper/6PPX5575
@misc{pith2026260805373,
  author       = {Pith},
  title        = {Pith review of: Velocity- and Regime-Aware Detection of Intraday Options Market Manipulation, with Explainable Attribution},
  year         = {2026},
  howpublished = {\url{https://pith.science/paper/6PPX5575}},
  note         = {Machine review of arXiv:2608.05373}
}
read the original abstract
Intraday market manipulation is hard to detect because its footprint is brief, buried in millions of quotes, and statistically similar to ordinary volatility. Detectors reach high recall only by flagging so many other days that measured precision collapses, producing alerts no regulator can act on. We show that this manipulation leaves a distinctive dynamic signature: a pump-and-crash pattern visible in the velocity of market state, rather than its level. We build a minute-level detection pipeline, strictly partitioned in time, based on smoothed state velocity: option-Delta velocity for index options and price velocity for equities. We explain every alert with SHAP attribution. We hold the test period strictly out-of-sample and fix all thresholds before evaluation. On the locked Indian BANKNIFTY index-options test, the plain autoencoder recovers 10 of 10 regulator-identified manipulation days. Conditioning detection on market regimes inferred by a hidden Markov model yields an instructive negative result. The regimes are descriptively distinct, but using them trades recall for precision. Under the closed-world assumption that unlabeled days are normal, precision remains near 25%. The same dynamic appears in thinly traded U.S. equities (SEC v. Patel). The shape of the signature survives the transfer; its velocity magnitude does not. A pump-reversal shape score ranks the complaint's alleged manipulation days with AUC 0.91 (ARQQ) and 0.81 (ACY). On the ARQQ worked example, the score peaks inside the complaint's documented minute window. Finally, exact SHAP attribution over every alert shows that unconfirmed alerts share the regulator-identified days' attribution profile (cosine similarity 0.99). The precision ceiling is consistent with incomplete enforcement labels rather than detector failure. What transfers across markets and instrument types is the dynamic signature itself.
Figures


Figures from the paper (1 more)

Reference graph
Works this paper leans on
-
[1]
Rajesh K. Aggarwal and Guojun Wu. 2006. Stock Market Manipulations.The Journal of Business79, 4 (2006), 1915–1953. doi:10.1086/503652
-
[2]
Michael Aitken, Douglas Cumming, and Feng Zhan. 2015. High Frequency Trading and End-of-Day Price Dislocation.Journal of Banking & Finance59 (2015), 330–349. doi:10.1016/j.jbankfin.2015.06.011
-
[3]
Erdinc Akyildirim, Matteo Gambara, Josef Teichmann, and Syang Zhou. 2022. Ap- plications of Signature Methods to Market Anomaly Detection. arXiv:2201.02441
arXiv 2022
-
[4]
Schrager, Srijan Sood, Jared Vann, and Manuela Veloso
Tucker Richard Balch, Veronica Mejia Bustamante, Naan Cho, Matthew Howard, Maxime Kawawa-Beaudan, Ganapathy Mani, Ivan Rankenburg, Andrew J. Schrager, Srijan Sood, Jared Vann, and Manuela Veloso. 2026. Method and system for detecting anomalous behavior in stream data. US Patent 12,585,762 B2, assigned to JPMorgan Chase Bank, N.A. Granted March 24, 2026
work page 2026
-
[5]
Fischer Black and Myron Scholes. 1973. The Pricing of Options and Corporate Liabilities.Journal of Political Economy81, 3 (1973), 637–654
work page 1973
-
[6]
David Diaz, Babis Theodoulidis, and Pedro Sampaio. 2011. Analysis of Stock Market Manipulations Using Knowledge Discovery Techniques Applied to Intra- day Trade Prices.Expert Systems with Applications38, 10 (2011). doi:10.1016/j. eswa.2011.04.066
doi:10.1016/j 2011
-
[7]
Koosha Golmohammadi and Osmar R. Zaïane. 2015. Time Series Contextual Anomaly Detection for Detecting Market Manipulation in Stock Market. In Proceedings of the IEEE International Conference on Data Science and Advanced Analytics (DSAA). doi:10.1109/DSAA.2015.7344856
arXiv 2015
-
[8]
Ayush Gupta. 2023. Indian Nifty and Banknifty Options Data 2020–2024. Kaggle dataset. https://www.kaggle.com/datasets/ayushsacri/indian-nifty-and- banknifty-options-data-2020-2024. Accessed July 16, 2026. Redistributed data are not included; a frozen working copy is preserved in the project archive
work page 2023
Show all 28 references
-
[9]
Hamilton
James D. Hamilton. 1989. A New Approach to the Economic Analysis of Nonsta- tionary Time Series and the Business Cycle.Econometrica57, 2 (1989), 357–384. doi:10.2307/1912559
1989 doi
-
[10]
John C. Hull. 2018.Options, Futures, and Other Derivatives(10 ed.). Pearson
2018
-
[11]
Josh Kamps and Bennett Kleinberg. 2018. To the Moon: Defining and Detecting Cryptocurrency Pump-and-Dumps.Crime Science7, 1 (2018). doi:10.1186/s40163- 018-0093-5
2018 doi
-
[12]
Maxime Kawawa-Beaudan, Srijan Sood, Soham Palande, Ganapathy Mani, Tucker Balch, and Manuela Veloso. 2024. Ensemble methods for sequence classification with hidden Markov models.arXiv preprint arXiv:2409.07619(2024)
2024 arXiv
-
[13]
Massimo La Morgia, Alessandro Mei, Francesco Sassi, and Julinda Stefa. 2023. The Doge of Wall Street: Analysis and Detection of Pump and Dump Cryptocurrency Manipulations.ACM Transactions on Internet Technology23, 1 (2023). doi:10. 1145/3561300
2023
-
[14]
Fei Tony Liu, Kai Ming Ting, and Zhi-Hua Zhou. 2008. Isolation Forest. In Proceedings of the Eighth IEEE International Conference on Data Mining (ICDM). 413–422. doi:10.1109/ICDM.2008.17
2008 doi
-
[15]
Lundberg and Su-In Lee
Scott M. Lundberg and Su-In Lee. 2017. A Unified Approach to Interpreting Model Predictions. InAdvances in Neural Information Processing Systems 30 (NeurIPS)
2017
-
[16]
Karim Mahrous and Roberto Di Pietro. 2025. TSTR for Financial Fraud: Learn- ing to Detect Manipulation Without Real Data. InProceedings of the 6th ACM International Conference on AI in Finance (ICAIF). doi:10.1145/3768292.3770393
2025
-
[17]
Stewart Mayhew. 2002. Competition, Market Structure, and Bid-Ask Spreads in Stock Option Markets.Journal of Finance57, 2 (2002), 931–958
2002
-
[18]
Robert C. Merton. 1973. Theory of Rational Option Pricing.The Bell Journal of Economics and Management Science4, 1 (1973), 141–183
1973
-
[19]
Dmitriy Muravyev and Neil D. Pearson. 2020. Options Trading Costs Are Lower than You Think.The Review of Financial Studies33, 11 (2020), 4973–5014. doi:10. 1093/rfs/hhaa010
2020
-
[20]
Sandeep Neela. 2025. AIMM: An AI-Driven Multimodal Framework for Detecting Social-Media-Influenced Stock Market Manipulation. arXiv:2512.16103
2025
-
[21]
Astudillo, and David Díaz
Hugo Núñez Delafuente, César A. Astudillo, and David Díaz. 2024. Ensemble Approach Using k-Partitioned Isolation Forests for the Detection of Stock Market Manipulation.Mathematics12, 9 (2024), 1336. doi:10.3390/math12091336
2024 doi
-
[22]
Peter Nystrup, Henrik Madsen, and Erik Lindström. 2018. Dynamic Portfolio Optimization Across Hidden Market Regimes.Quantitative Finance18, 1 (2018), 83–95. doi:10.1080/14697688.2017.1342857
2018
-
[23]
Guansong Pang, Chunhua Shen, Longbing Cao, and Anton van den Hengel. 2021. Deep Learning for Anomaly Detection: A Review.Comput. Surveys54, 2 (2021), 1–38. doi:10.1145/3439950
2021 doi
-
[24]
Lawrence R. Rabiner. 1989. A Tutorial on Hidden Markov Models and Selected Applications in Speech Recognition.Proc. IEEE77, 2 (1989), 257–286. doi:10. 1109/5.18626
1989
-
[25]
Why Should I Trust You?
Marco Tulio Ribeiro, Sameer Singh, and Carlos Guestrin. 2016. “Why Should I Trust You?”: Explaining the Predictions of Any Classifier. InProceedings of the 22nd ACM SIGKDD International Conference on Knowledge Discovery and Data Mining. 1135–1144. doi:10.1145/2939672.2939778
2016
-
[26]
Platt, John Shawe-Taylor, Alex J
Bernhard Schölkopf, John C. Platt, John Shawe-Taylor, Alex J. Smola, and Robert C. Williamson. 2001. Estimating the Support of a High-Dimensional Distribution.Neural Computation13, 7 (2001), 1443–1471. doi:10.1162/ 089976601750264965
2001
-
[27]
Securities and Exchange Board of India. 2025. Interim Order in the Matter of Index Manipulation by Jane Street Group. Order WTM/AN/MRD/MRD-SEC- 3/31013/2025-26, July 3, 2025. https://www.sebi.gov.in/enforcement/orders/jul- 2025/interim-order-in-the-matter-of-index-manipulation...
2025
-
[28]
Securities and Exchange Commission
U.S. Securities and Exchange Commission. 2026. SEC v. Harsh V. Patel, No. 1:26-cv-03203 (S.D.N.Y. filed Apr. 20, 2026). Complaint and Attachment A; SEC Litigation Release No. 26532. https://www.sec.gov/files/litigation/complaints/ 2026/comp26532.pdf
2026
Reviewed August 8, 2026 · model on record in the stance chip above.
Discussion (0). Continue with ORCID to comment.