Stochastic network epidemic model and particle filter: General framework and application to influenza in Japan
Pith reviewed 2026-06-28 23:53 UTC · model grok-4.3
The pith
A particle filter framework applied to a stochastic 2D lattice epidemic model estimates hidden states and parameters from incomplete observations and generates one-week-ahead influenza forecasts for Japan.
A machine-rendered reading of the paper's core claim, the machinery that carries it, and where it could break.
Core claim
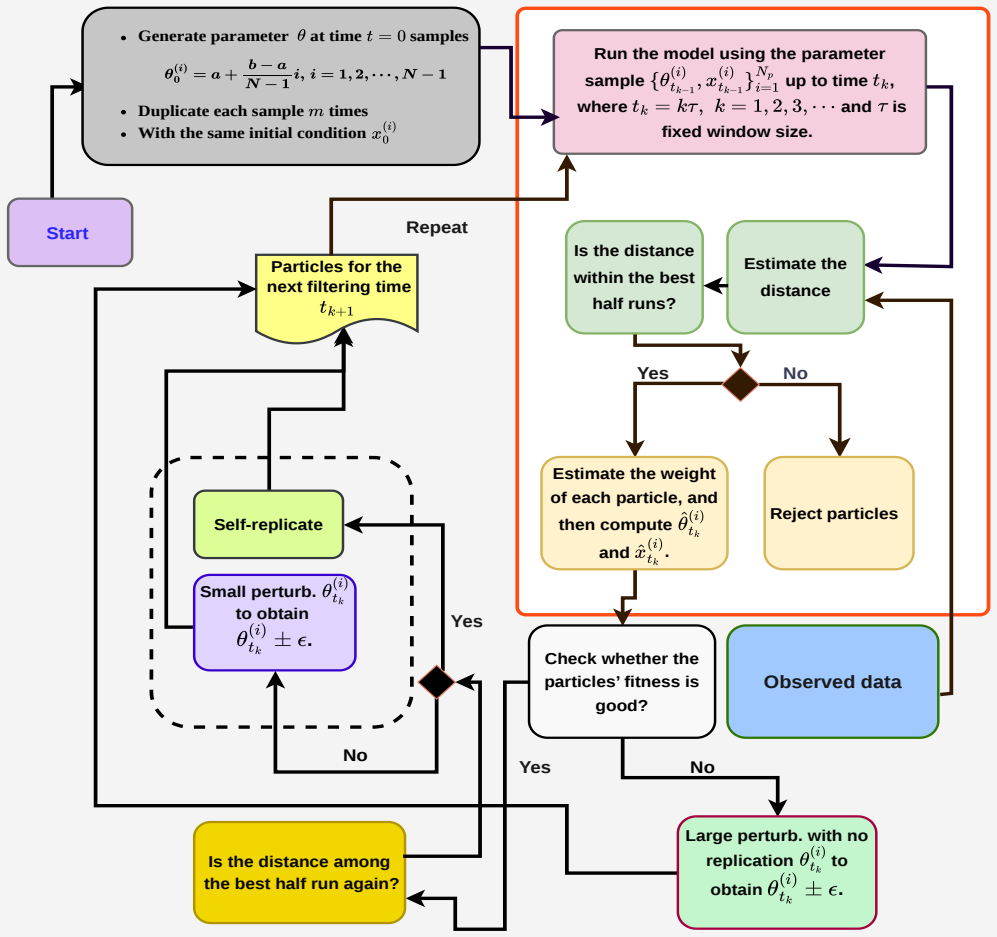
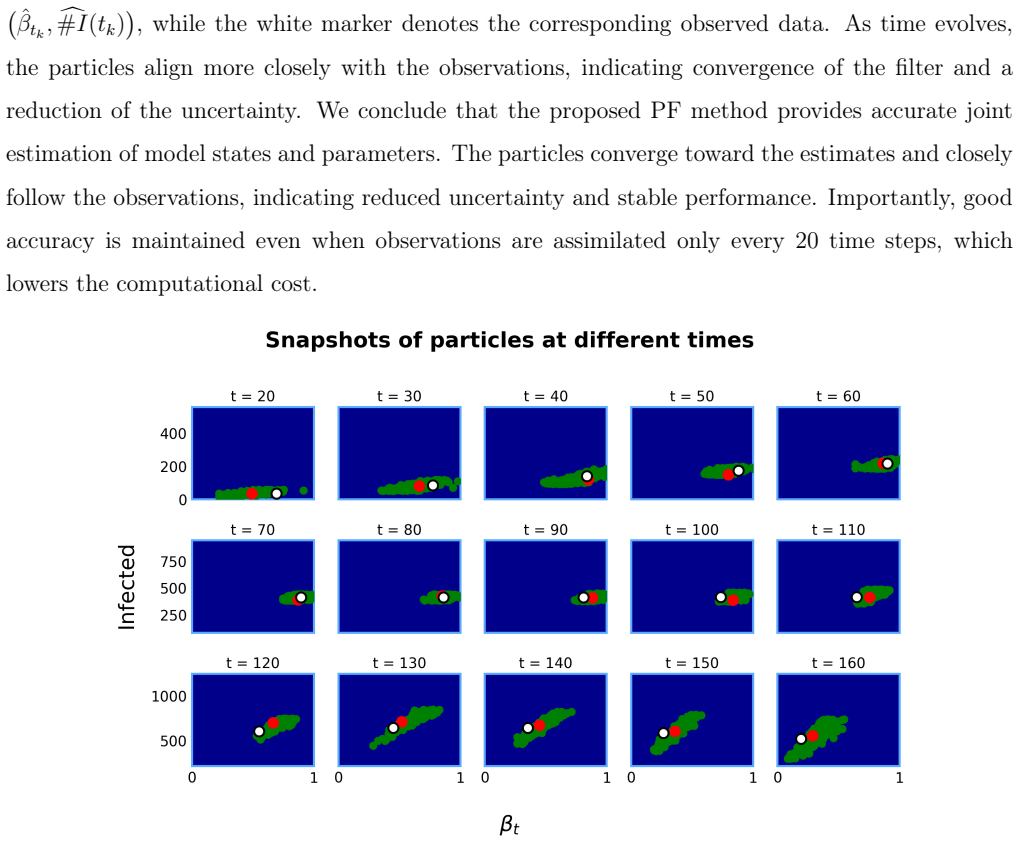
The authors introduce a two-dimensional lattice graph model for infectious disease spread and propose a particle filter based data assimilation framework for the sequential estimation of both model states and unknown parameters. Two methodologies are developed based on the number of infected agents and partial spatial information. The first method is applied to influenza data from Japan, demonstrating effectiveness for monitoring and forecasting.
What carries the argument
The particle filter data assimilation framework for estimating states and parameters in the stochastic lattice epidemic model.
If this is right
- Enables real-time epidemic monitoring using partial observations.
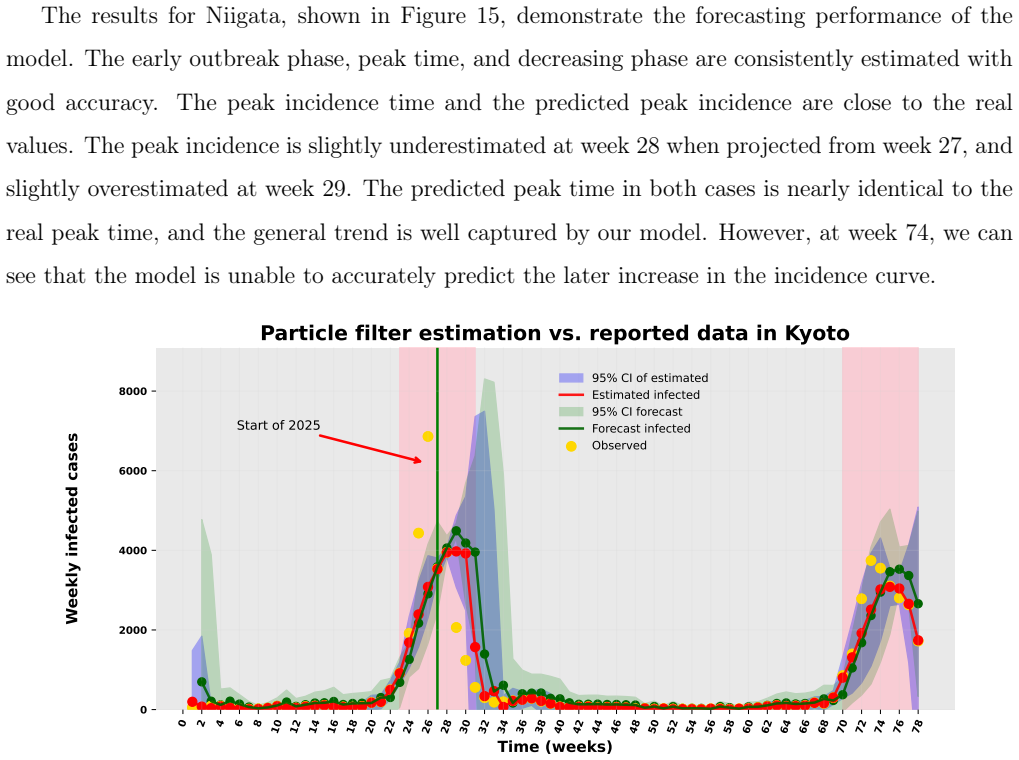
- Supports one-week-ahead forecasting simulations from current weekly data.
- Facilitates adaptive public health decision-making based on estimated states.
- Handles both aggregate infected counts and partial spatial location information.
Where Pith is reading between the lines
- The approach could be tested on surveillance data from other countries or diseases with similar reporting structures.
- Spatial estimates from the partial-information method might guide localized interventions if validated further.
- Longer forecast horizons or integration with mobility data could be explored as extensions of the current one-week setup.
Load-bearing premise
The particle filter methods can reliably estimate both states and parameters in the stochastic lattice model when applied to real-world incomplete data.
What would settle it
A systematic mismatch between the one-week-ahead forecasts generated by the model and the actual subsequent weekly influenza cases in the Japanese prefectures would indicate the framework does not perform as claimed.
Figures






read the original abstract
Parameter inference and state estimation in stochastic and partially observed biological systems remain major problems in mathematical biology. In this work, we introduce a two-dimensional lattice graph model for the spread of infectious diseases. Estimating states and parameters in graph-based stochastic epidemic systems is particularly challenging because of randomness and incomplete observations. To address these issues, we propose a particle filter based data assimilation framework for the sequential estimation of both model states and unknown parameters. Two methodologies are developed: one based on the number of infected agents and another based on partial spatial location's information of infected agents on a two-dimensional lattice. The performance of the two methods are firstly analyzed and validated using synthetic data, and the first method is then applied to influenza data collected from different prefectures in Japan between July 2024 and December 2025. One-week-ahead forecasting simulations are also performed using current weekly data. The findings highlight the effectiveness of the proposed PF framework for real-time epidemic monitoring, forecasting, and adaptive public health decision-making.
Editorial analysis
A structured set of objections, weighed in public.
Referee Report
Summary. The paper introduces a two-dimensional lattice graph stochastic epidemic model and develops a particle filter data assimilation framework for sequential state and parameter estimation. Two variants are presented (one using infected counts, one using partial spatial information on the lattice). The methods are validated on synthetic data and the first variant is applied to real influenza data from Japanese prefectures (July 2024–December 2025) with one-week-ahead forecasting simulations.
Significance. If the particle-filter methods can be shown to produce reliable joint state-parameter estimates from incomplete observations, the framework would supply a practical tool for real-time epidemic monitoring and short-term forecasting on spatially structured stochastic models, with direct relevance to public-health decision support.
major comments (2)
- [Abstract] Abstract: the central claim that the PF framework is 'effective' for real-time monitoring, forecasting, and adaptive decision-making is not accompanied by any quantitative error metrics, baseline comparisons, or goodness-of-fit statistics on either the synthetic or real-data experiments, leaving the effectiveness assertion without measurable support.
- [Abstract] Abstract / Methods (synthetic validation paragraph): the description of the two PF methodologies does not specify how the particle filter handles the joint estimation of transmission/recovery rates together with the latent state on the lattice, nor whether the reported performance degrades under the partial-observation regimes that are the paper’s stated target.
minor comments (1)
- [Abstract] Abstract: the data-collection interval 'July 2024 to December 2025' should be checked for typographical error or clarified as a projection, since the manuscript’s submission context appears to predate the end of this window.
Simulated Author's Rebuttal
We thank the referee for their constructive comments, which help clarify key aspects of our presentation. We provide point-by-point responses below and will revise the manuscript accordingly.
read point-by-point responses
-
Referee: [Abstract] Abstract: the central claim that the PF framework is 'effective' for real-time monitoring, forecasting, and adaptive decision-making is not accompanied by any quantitative error metrics, baseline comparisons, or goodness-of-fit statistics on either the synthetic or real-data experiments, leaving the effectiveness assertion without measurable support.
Authors: We agree that the abstract would benefit from explicit quantitative support. In the revised manuscript we will add concise references to error metrics (e.g., RMSE on state and parameter estimates from the synthetic experiments) and one-week-ahead forecast accuracy measures from the Japanese influenza application, together with a brief mention of baseline comparisons performed in the main text. revision: yes
-
Referee: [Abstract] Abstract / Methods (synthetic validation paragraph): the description of the two PF methodologies does not specify how the particle filter handles the joint estimation of transmission/recovery rates together with the latent state on the lattice, nor whether the reported performance degrades under the partial-observation regimes that are the paper’s stated target.
Authors: We accept that additional detail is warranted. The current methods section describes the two variants but does not explicitly state that parameters are jointly estimated by state augmentation within the particle filter. We will revise both the abstract and the synthetic-validation paragraph to clarify the augmented-state mechanism and to report performance separately for the partial-spatial-information regime, including any observed degradation relative to the infected-count variant. revision: yes
Circularity Check
No significant circularity in derivation chain
full rationale
The paper introduces a 2D lattice stochastic epidemic model and a particle filter framework for state/parameter estimation from partial observations. It validates the methods on synthetic data before applying the first method to external real-world influenza incidence data from Japanese prefectures (July 2024–December 2025) and performs one-week-ahead forecasts. No equations, ansatzes, or uniqueness claims are shown to reduce by construction to fitted parameters or self-citations; the central effectiveness claim rests on empirical performance against independent data sources. This matches the provided reader's assessment of score 2.0 with no load-bearing self-referential steps.
Axiom & Free-Parameter Ledger
free parameters (1)
- transmission and recovery rates
axioms (1)
- domain assumption Disease spread follows a stochastic process on a two-dimensional lattice graph with partial observations.
Reference graph
Works this paper leans on
-
[1]
Mathematical modeling for estimating influenza vaccine efficacy: A case study of the Valencian Community, Spain
Andreu-Vilarroig, C., Villanueva, R. J. and González-Parra, G. “Mathematical modeling for estimating influenza vaccine efficacy: A case study of the Valencian Community, Spain.”In- fectious Disease Modelling, 9(3), 744–762, 2024
2024
-
[2]
Mathematical modeling of influenza dynamics: Integrating seasonality and gradual waning immunity
Andreu-Vilarroig, C., González-Parra, G. and Villanueva, R. J. “Mathematical modeling of influenza dynamics: Integrating seasonality and gradual waning immunity.”Bulletin of Math- ematical Biology, 87(6), 2025
2025
-
[3]
A multi-model ensemble Kalman filter for data assimilation and fore- casting
Bach, E. and Ghil, M. “A multi-model ensemble Kalman filter for data assimilation and fore- casting.”Journal of Advances in Modeling Earth Systems, 15(1), e2022MS003123, 2023
2023
-
[4]
A network with tunable clustering, degree correlation and degree distribution, and an epidemic thereon
Ball, F., Britton, T. and Sirl, D. “A network with tunable clustering, degree correlation and degree distribution, and an epidemic thereon.”Journal of Mathematical Biology, 66(4), 979– 1019, 2013
2013
-
[5]
Network epidemi- ological analysis of COVID-19 transmission patterns by age, occupation and residence across four waves in Cyprus
Dimitriou, P. A., Silvestros, V., Constantinou, E., Pitris, C. and Kolios, P. “Network epidemi- ological analysis of COVID-19 transmission patterns by age, occupation and residence across four waves in Cyprus.”Scientific Reports, 15(1), 28416, 2025
2025
-
[6]
A tutorial on particle filtering and smoothing: Fifteen years later
Doucet, A. and Johansen, A. M. “A tutorial on particle filtering and smoothing: Fifteen years later.”Handbook of Nonlinear Filtering, 12(1), 1–41, 2009
2009
-
[7]
Data assimilation for agent-based models
Ghorbani, A., Ghorbani, V., Nazari-Heris, M. and Asadi, S. “Data assimilation for agent-based models.”Mathematics, 11(20), 4296, 2023
2023
-
[8]
Age-structured model of dengue transmission dynamics with time- varying parameters, and its application to Brazil
Haq, I. U. and Richard, S. “Age-structured model of dengue transmission dynamics with time- varying parameters, and its application to Brazil.”Nonlinear Science, 100–133, 2026
2026
-
[9]
Three basic epidemiological models
Hethcote, H. W. “Three basic epidemiological models.”Applied Mathematical Ecology, 119–144, 1989
1989
-
[10]
A stochastic agent-based model of the SARS-CoV-2 epidemic in France
Hoertel, N., Blachier, M., Blanco, C., Olfson, M., Massetti, M., Sánchez Rico, M., Limosin, F. and Leleu, H. “A stochastic agent-based model of the SARS-CoV-2 epidemic in France.” Nature Medicine, 26(9), 1417–1421, 2020. 33
2020
-
[11]
Particle filter-based data assimilation in dynamic data-driven simulation: Sensitivity analysis of three critical experimental conditions
Huang, Y., Xie, X., Cho, Y. and Verbraeck, A. “Particle filter-based data assimilation in dynamic data-driven simulation: Sensitivity analysis of three critical experimental conditions.” Simulation, 99(4), 403–415, 2023
2023
-
[12]
A minimal model for household effects in epidemics
Huber, G., Kamb, M., Kawagoe, K., Li, L. M., Veytsman, B., Yllanes, D. and Zigmond, D. “A minimal model for household effects in epidemics.”Physical Biology, 17(6), 065010, 2020
2020
-
[13]
Extinction and sta- tionary distribution of a stochastic COVID-19 epidemic model with time-delay
Ikram, R., Khan, A., Zahri, M., Saeed, A., Yavuz, M. and Kumam, P. “Extinction and sta- tionary distribution of a stochastic COVID-19 epidemic model with time-delay.”Computers in Biology and Medicine, 141(1), 105–115, 2022
2022
-
[14]
Assessing the impact of disease incidence and immunization on the resilience of complex networks during epidemics
Islam, M. S., Ullah, M. S. and Kabir, K. A. “Assessing the impact of disease incidence and immunization on the resilience of complex networks during epidemics.”Infectious Disease Mod- elling, 10(1), 1–27, 2025
2025
-
[15]
A comparative study of deterministic and stochastic computational modeling approaches for analyzing and optimizing COVID-19 control
Kadri, A., Boudaoui, A., Ullah, S., Asiri, M., Saqib, A. B. and Riaz, M. B. “A comparative study of deterministic and stochastic computational modeling approaches for analyzing and optimizing COVID-19 control.”Scientific Reports, 15(1), 11710, 2025
2025
-
[16]
Mathematical models of the spread of infection
Kendall, D. G. “Mathematical models of the spread of infection.”Mathematics and Computer Science in Biology and Medicine, 213–225, 1965
1965
-
[17]
Concurrency measures in the era of temporal network epidemiology: A review
Masuda, N., Miller, J. C. and Holme, P. “Concurrency measures in the era of temporal network epidemiology: A review.”Journal of The Royal Society Interface, 18(179), 2021
2021
-
[18]
Bridging compartmental models and network analysis in epidemiological modelling
Mendes, J. M., Baptista, H. and MacNab, Y. C. “Bridging compartmental models and network analysis in epidemiological modelling.”Epidemiological Modelling, 2024
2024
-
[19]
Stochastic epidemic models inference and diagnosis with Poisson random measure data augmentation
Nguyen-Van-Yen, B., Del Moral, P. and Cazelles, B. “Stochastic epidemic models inference and diagnosis with Poisson random measure data augmentation.”Mathematical Biosciences, 335(1), 108583, 2021
2021
-
[20]
An age-structured extension to the vectorial capacity model
Novoseltsev, V. N., Michalski, A. I., Novoseltseva, J. A., Yashin, A. I., Carey, J. R. and Ellis, A. M. “An age-structured extension to the vectorial capacity model.”PLOS ONE, 7(6), e39479, 2012
2012
-
[21]
Real-time growth rate for general stochastic SIR epidemics on unclustered networks
Pellis, L., Spencer, S. E. F. and House, T. “Real-time growth rate for general stochastic SIR epidemics on unclustered networks.”Mathematical Biosciences, 265(1), 65–81, 2015. 34
2015
-
[22]
Determining the rate of infectious disease testing through contagion potential
Roy, S., Biswas, P. and Ghosh, P. “Determining the rate of infectious disease testing through contagion potential.”PLOS Global Public Health, 3(8), e0002229, 2023
2023
-
[23]
Spatial-temporal dynamics in nonlocal epidemiological models
Ruan, S. “Spatial-temporal dynamics in nonlocal epidemiological models.”Mathematics for Life Science and Medicine, 97–122, 2007
2007
-
[24]
Data-assimilation and state estimation for contact-based spreading processes using the ensemble Kalman filter: Application to COVID- 19
Schaum, A., Bernal-Jaquez, R. and Ramos, L. A. “Data-assimilation and state estimation for contact-based spreading processes using the ensemble Kalman filter: Application to COVID- 19.”Chaos, Solitons & Fractals, 157(1), 111887, 2022
2022
-
[25]
Analysis of COVID-19 spread in Tokyo through an agent-based model with data assimilation
Sun, C., Miyoshi, T., Richard, S. and Tsuzu, N. “Analysis of COVID-19 spread in Tokyo through an agent-based model with data assimilation.”J. Clin. Med.11, 2401, 2022
2022
-
[26]
Data assim- ilation and agent-based modelling: Towards the incorporation of categorical agent parameters
Ternes, P., Ward, J. A., Heppenstall, A., Kumar, V., Kieu, L. M. and Malleson, N. “Data assim- ilation and agent-based modelling: Towards the incorporation of categorical agent parameters.” Open Research Europe, 1(1), 131, 2022
2022
-
[27]
Open problems in mathematical biology
Vittadello, S. T. and Stumpf, M. P. H. “Open problems in mathematical biology.”Mathematical Biosciences, 354, 108926, 2022
2022
-
[28]
Spatially structured models of viral dynamics: A scoping review
Williams, T., McCaw, J. M. and Osborne, J. M. “Spatially structured models of viral dynamics: A scoping review.”Microbiology and Molecular Biology Reviews, 89(4), e00283–24, 2025
2025
-
[29]
Computation of the basic reproduction numbers for reaction-diffusion epidemic models
Yang, C. and Wang, J. “Computation of the basic reproduction numbers for reaction-diffusion epidemic models.”Mathematical Biosciences and Engineering, 20(8), 15201, 2023
2023
-
[30]
InfectiousDiseasesWeeklyReport: Provisionaldata
NationalInstituteofInfectiousDiseases.“InfectiousDiseasesWeeklyReport: Provisionaldata.” Available at:https://id-info.jihs.go.jp/surveillance/idwr/provisional/2025/47/ index.html. 35
2025
discussion (0)
Sign in with ORCID, Apple, or X to comment. Anyone can read and Pith papers without signing in.