The benefit of a multi-band high resolution spectroscopic monitoring for studying stellar transients: the NGC 300 OT2008-1 UVES spectrum as a test case
Pith reviewed 2026-05-21 01:55 UTC · model grok-4.3
The pith
High-resolution spectra of stellar transients reveal complex ejecta geometry and dynamics that low-resolution data cannot detect.
A machine-rendered reading of the paper's core claim, the machinery that carries it, and where it could break.
Core claim
The central claim is that analysis of the high-resolution spectrum identifies a larger sample of emission lines whose profiles are suggestive of complex geometry and ejecta dynamics, inferences that remain impossible from the low-resolution spectrum. Low-resolution data compromise interpretation by limiting information to bolometric-like studies of the spectral energy distribution and major transitions, while high-resolution data enable precise physical characterization and realistic physical scenarios rather than parameter fitting to oversimplified models. Only one epoch was available in this case, so the new scenario cannot be confirmed without high-resolution spectroscopic monitoring.
What carries the argument
Comparison of emission line identification and profile analysis between a low-resolution spectrum and a high-resolution spectrum of the same stellar transient taken one day apart.
If this is right
- High-resolution spectra enable secure identification of many more lines than low-resolution spectra.
- Line profile analysis from high-resolution data can constrain ejecta geometry and dynamics.
- Low-resolution spectra remain useful for tracking overall spectral energy distribution changes but not for detailed dynamics.
- Multi-epoch high-resolution monitoring is required to follow transient evolution and test physical scenarios.
- Without high-resolution data, interpretations favor oversimplified models and leave energetics speculative.
Where Pith is reading between the lines
- The approach could be extended to other classes of transients to test whether high-resolution monitoring consistently reveals overlooked components.
- This highlights a broader need for allocating high-resolution telescope time to transient follow-up rather than relying solely on survey-mode low-resolution observations.
- Single-epoch high-resolution data still leave open questions about time variability that only repeated observations can address.
Load-bearing premise
That the shapes of emission line profiles in a single-epoch high-resolution spectrum can be directly interpreted as evidence of complex geometry and ejecta dynamics without multi-epoch observations or detailed modeling to rule out alternatives.
What would settle it
A later high-resolution spectrum of the same transient that shows no evolution in the line profiles or a detailed radiative transfer model of a simple spherical geometry that reproduces the observed profiles would challenge the inferred complex dynamics.
Figures



read the original abstract
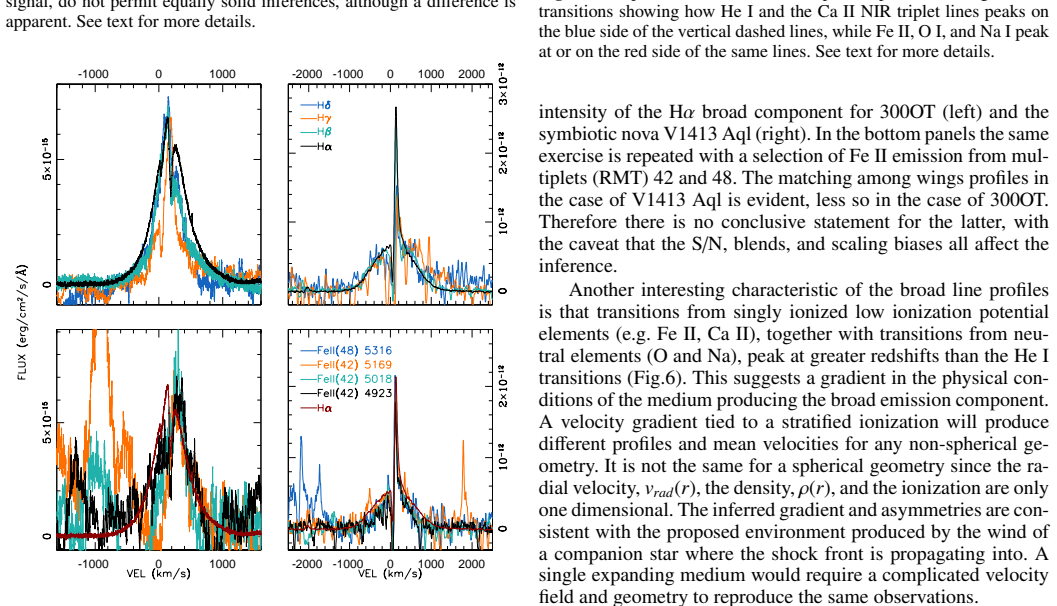
This work advocates the benefit of high resolution spectroscopic monitoring in the study of transients (local group transients given the available collecting power). As an exemplary analysis, we focus on the optical transient NGC300OT2008-1. Searching the ESO archives, we found a low resolution (LR, FORS) and a high resolution (HR, UVES) spectrum that were separated by only one day with no changes between them. The independent analysis of the FORS and UVES spectra show that in the LR spectrum we can securely identify only a small sample of lines and miss the correct characterization of the ejecta energetics which remain at the level of speculation. In the HR data, we identify a larger sample of emission lines and analyze their profiles suggestive of a complex geometry and ejecta dynamics whose inferences are simply impossible in LR spectra. Line profile studies are not possible with LR spectra, and may lead to potentially misleading measures. The limited information available from LR data compromises the interpretation and prevents formulating realistic physical scenarios, favoring parameter fitting to oversimplified, biased, standard models. In this occasion only one epoch was available, but monitoring is fundamental to characterize the transient evolution. The new scenario derived from the analysis of the HR spectrum cannot be confirmed or dismissed lacking a HR spectroscopic monitoring. LR and HR spectra serve different but complementary purposes. With LR one does bolometric-like studies (SED, strengthening or weakening of the major transitions), while with HR one does dynamics and precise physical characterization. HR spectroscopic monitoring on different types of transient has already shown how it serves to disentangle the various components, constrain their physical parameters, the involved energy source, and derive the ejecta dynamics.
Editorial analysis
A structured set of objections, weighed in public.
Referee Report
Summary. The manuscript advocates for high-resolution spectroscopic monitoring of stellar transients, using NGC 300 OT2008-1 as a test case. It compares an archival low-resolution FORS spectrum with a high-resolution UVES spectrum taken one day later (with no reported changes), showing that LR data permit only limited secure line identifications and leave ejecta energetics speculative, while HR data reveal more emission lines whose profiles suggest complex geometry and dynamics that cannot be inferred from LR spectra. LR and HR are presented as complementary, with HR enabling dynamics studies and the work stressing that multi-epoch HR monitoring is needed to confirm scenarios.
Significance. If substantiated, the work provides a concrete observational demonstration of the additional physical information (larger line sample, profile shapes) accessible only with HR spectra for transients, supporting targeted monitoring strategies with current facilities. The explicit note that the derived scenario requires further HR epochs for confirmation is a positive aspect of the presentation.
major comments (2)
- [UVES spectrum analysis] UVES spectrum analysis: The interpretation of line profile shapes (asymmetries, multiple components) as direct evidence for complex geometry and ejecta dynamics is presented without radiative transfer modeling or tests against simpler alternatives such as spherical ejecta with optical-depth or velocity-gradient effects. This is load-bearing for the central claim that such inferences are impossible in LR spectra.
- [Discussion section] Discussion section: While the text correctly notes that monitoring is required to confirm the scenario, the headline inferences about complex dynamics and energetics are drawn from this single-epoch comparison without quantitative error analysis on fitted profile parameters or alternative model comparisons.
minor comments (2)
- [Abstract] Abstract: The time separation (one day) and lack of variability between the FORS and UVES spectra could be stated more explicitly to strengthen the direct comparison.
- [Figures] Figure presentation: Spectra comparison figures should include explicit labels for resolution, instrument, and any smoothing applied to aid reader assessment of line identification differences.
Simulated Author's Rebuttal
We thank the referee for the constructive comments and positive assessment of the manuscript's significance. We address each major comment below, revising the text to better reflect the observational nature of the study and its limitations while maintaining the core demonstration of HR spectroscopy benefits.
read point-by-point responses
-
Referee: UVES spectrum analysis: The interpretation of line profile shapes (asymmetries, multiple components) as direct evidence for complex geometry and ejecta dynamics is presented without radiative transfer modeling or tests against simpler alternatives such as spherical ejecta with optical-depth or velocity-gradient effects. This is load-bearing for the central claim that such inferences are impossible in LR spectra.
Authors: We agree that full radiative transfer modeling would strengthen the physical interpretation. However, the manuscript's primary aim is to show that HR spectra reveal profile features (asymmetries, multiple components) unresolved in LR data, making profile-based dynamical inferences impossible from LR spectra regardless of the underlying model. We have revised the relevant sections to qualify the language as 'suggestive of complex geometry' rather than direct evidence, added discussion of possible alternative explanations including optical-depth effects in spherical geometries, and clarified that detailed modeling lies beyond the current observational comparison but is enabled by HR data. revision: partial
-
Referee: Discussion section: While the text correctly notes that monitoring is required to confirm the scenario, the headline inferences about complex dynamics and energetics are drawn from this single-epoch comparison without quantitative error analysis on fitted profile parameters or alternative model comparisons.
Authors: We accept that quantitative error analysis improves rigor. The revised manuscript now includes formal uncertainties on fitted velocities and profile parameters from the UVES spectrum. We have also expanded the discussion to explicitly compare with simpler alternatives (e.g., spherical ejecta with velocity gradients) and explain why the observed multi-component profiles are difficult to reconcile with them. The headline claims have been moderated to emphasize the suggestive character of the single-epoch results and the necessity of multi-epoch HR monitoring for confirmation. revision: yes
Circularity Check
No circularity: claims rest on direct archival spectral comparison
full rationale
The paper's central argument derives from comparing one LR FORS spectrum and one HR UVES spectrum of NGC 300 OT2008-1 taken one day apart. Larger line sample and profile features are reported as observed facts in the HR data; no equations, fitted parameters, or predictions are constructed that reduce to the inputs by definition. No self-citation load-bearing steps, ansatz smuggling, or renaming of known results appear in the provided text. The derivation is self-contained observational analysis against external archival data.
Axiom & Free-Parameter Ledger
axioms (1)
- domain assumption The LR and HR spectra show no changes between them despite being separated by one day.
Reference graph
Works this paper leans on
-
[1]
Adams, S. M.; Kochanek, C. S.; Prieto, J. L.; et al., 2016, MNRAS, 460, 1645
work page 2016
-
[2]
Akimoto, H.; Itoh, Y., 2019, IJAA, 9, 321,
work page 2019
-
[3]
Avila, G.; Rupprecht G.; Beckers, J.M.. 1997, SPIE, 2871.1135A
- [4]
-
[5]
Berger, E.; Soderberg, A. M.; Chevalier, R. A.; et al., 2009, ApJ, 699, 1850
work page 2009
- [6]
-
[7]
Botticella, M. T.; Pastorello, A.; Smartt, S. J.; et al., 2009, MNRAS 398, 1041
work page 2009
-
[8]
Cai, Y.-Z.; Pastorello, A.; Fraser, M.; et al., 2018 MNRAS, 480, 3424
work page 2018
-
[9]
Cai, Y.-Z.; Pastorello, A.; Fraser, M. ; et al., 2021, A&A, 654, A157
work page 2021
-
[10]
Cassatella, A.; Lamers, H. J. G. L. M.; Rossi, C., 2004, A&A, 420, 571
work page 2004
- [11]
- [12]
-
[13]
Desidera, S.; Giro, E.; Munari, U.; et al., 2004, A&A, 414, 591
work page 2004
- [14]
- [15]
-
[16]
Ederoclite, A.; Mason, E.; Della Valle, M.; et al., 2006, A&A, 459, 875
work page 2006
-
[17]
Erkal, J.; Manara, C. F.; Schneider, P. C.; et al., 2022, A&A, 666, 188
work page 2022
-
[18]
Folha, D. F. M.; Emerson, J. P., 2001, A&A, 365, 90
work page 2001
-
[19]
Friedjung, M., 1966, MNRAS, 132, 317
work page 1966
-
[20]
Friedjung, M., 1987, A&A, 179, 164
work page 1987
-
[21]
Friedjung, M., 1992, A&A, 262, 487
work page 1992
-
[22]
Friedjung, M., 2011, A&A, 536, 97
work page 2011
-
[23]
Gogarten, S. M.; Dalcanton, J. J.; Murphy, J. W.; et. al, 2009, ApJ, 703, 300
work page 2009
- [24]
-
[25]
Hamilton, Catrina M.; Johns-Krull, Christopher M.; Mundt, Reinhard; et al., 2012, ApJ, 751, 147
work page 2012
-
[26]
Hajigholi, M.; Persson, C. M.; Wirstrom, E. S.; et al., 2016, A&A, 585, 158
work page 2016
-
[27]
Humphreys, R. M.; Bond, H E.; Bedin, L. R.; et al., 2011, ApJ, 743, 118
work page 2011
-
[28]
Izzo, L.; Molaro, P.; Mason, E.; et al., 2018a, ATel 11468
-
[29]
Izzo, L.; Molaro, P.; Bonifacio, P.; et al.; 2018b, MNRAS, 478, 1601
- [30]
-
[31]
C.; et al., 2018, MNRAS, 480, 1973
Kacharov, N.; Neumayer, N.; Seth, A. C.; et al., 2018, MNRAS, 480, 1973
work page 2018
-
[32]
Kaminski, T.; Schmidt, M.; Tylenda, R.; et al., 2009, ApJS, 182, 33
work page 2009
-
[33]
Karambelkar, V. R.; Kasliwal, M. M.; Blagorodnova, N.; et al., 2023, ApJ, 948, 137
work page 2023
-
[34]
Kashi, A.; Frankowski, A.; Soker, N., 2010, ApJ, 709, L11
work page 2010
- [35]
-
[36]
Leonard, D. C.; Filippenko, A. V.; Barth, Aaron J.; Matheson, T., 2000, ApJ, 536, 239
work page 2000
-
[37]
Lucy, L. B.; Danziger, I. J.; Gouiffes, C.; Bouchet, P., 1989, LNP, 350, 164
work page 1989
-
[38]
Marconi, A.; Abreu, M.; Adibekyan, V.; et al., 2024, SPIE, 13096, 13
work page 2024
- [39]
-
[40]
Mason, E.; Munari, U., 2014, A&A, 569, 84
work page 2014
-
[41]
N.; De Gennaro Aquino, I.; et al., 2018, ApJ, 853, 27
Mason, E.; Shore, S. N.; De Gennaro Aquino, I.; et al., 2018, ApJ, 853, 27
work page 2018
-
[42]
Mason, E.; Shore, S. N. ; Kuin, P. ; Bohlsen, T., 2020, A&A, 635, A115
work page 2020
- [43]
-
[44]
Molaro, P.; Izzo, L.; Mason, E.; et al., 2016, MNRAS, 463, L117
work page 2016
-
[45]
Molaro, P.; Izzo, L.; Bonifacio, P.; et al., 2020, MNRAS, 492, 4975
work page 2020
-
[46]
Monard, B., 2022, TNSCR, 463, 1
work page 2022
-
[47]
Moran, S.; Kotak, R.; Fraser, M.; et al., 2024, A&A, 688, A161
work page 2024
-
[48]
R.; McCollum, B.; van den Ancker, M
Perez, M. R.; McCollum, B.; van den Ancker, M. E.; et al., 2008, A&A, 486, 533
work page 2008
- [49]
-
[50]
Ohsawa, R.; Sakon, I.; Onaka, T.; et al., 2010, ApJ, 718, 1456
work page 2010
-
[51]
Palle, E.; Biazzo, K.; Bolmont, E.; et al.; 2025, ExA, 59, 29
work page 2025
-
[52]
Pastorello A.; Fraser, M., 2019, Nat. Astr. 3, 676
work page 2019
-
[53]
R.; Benetti, S.; et al., 2010, A&A, 510, 108
Patat, F.; Maund, J. R.; Benetti, S.; et al., 2010, A&A, 510, 108
work page 2010
-
[54]
Pavana, M.; Raj, A.; Bohlsen, T.; et al., 2020, MNRAS, 495, 2075
work page 2020
-
[55]
Pessi, T.; Cartier, R.; Hueichapan, E.; et al., 2024, A&A, 688, L28
work page 2024
-
[56]
Prieto, J. L.; Kistler, M. D.; Thompson, T. A.; et al., 2008, ApJ, 681, L9
work page 2008
-
[57]
Prieto, J. L.; Sellgren, K.; Thompson, T. A.; Kochanek, C. S., 2009, ApJ, 705, 1425
work page 2009
-
[58]
Roederer, I. U. ; Alvarado-Gómez, J. D.; Allende Prieto, C.; et al.; 2024, ExA, 57, 17
work page 2024
-
[59]
Schipani, P.; Campana, S.; Claudi, R.; et al., 2018, SPIE, 10702E0FS
work page 2018
-
[60]
Shore, S. N. ; Augusteijn, T. ; Ederoclite, A. ; Uthas, H., 2011b, A&A, 533L, 8
-
[61]
Shore, S. N. ; Wahlgren, G. M. ; Augusteijn, T. ; et al., 2011a, A&A, 527A, 98
-
[62]
Shore, S. N.; Wahlgren, G. M.; Augusteijn, T.; et al., 2012a, A&A, 540A, 55
- [63]
-
[64]
N.; De Gennaro Aquino, I.; Schwarz, G
Shore, S. N.; De Gennaro Aquino, I.; Schwarz, G. J.; et al., 2013, A&A, 553A, 123
work page 2013
-
[65]
N.; De Gennaro Aquino, I.; Scaringi, S.; et al., 2014, A&A, 570L, 4
Shore, S. N.; De Gennaro Aquino, I.; Scaringi, S.; et al., 2014, A&A, 570L, 4
work page 2014
-
[66]
Shore, S. N.; Mason, E.; Schwarz, G. J.; et al., 2016, A&A, 590A, 123
work page 2016
-
[67]
Shore, S. N.; Kuin, N. P.; Mason, E.; De Gennaro Aquino, I., 2018, A&A, 619A, 104
work page 2018
-
[68]
J.; et al., 2025, ApJ, 982, L32
Shrestha, M.; DeSoto, S.; Sand, D. J.; et al., 2025, ApJ, 982, L32
work page 2025
-
[69]
Smith, N.; Ganeshalingam, M.; Chornock, R.; et al., 2009, ApJ, 697, L49
work page 2009
-
[70]
Smith, N., 2017, in Handbook of Supernovae , Alsabti A. W., Murdin P. editors, p. 403
work page 2017
- [71]
-
[72]
J.; et al., 2023, ApJ, 956, 46
Smith, N.; Pearson, J.; Sand, D. J.; et al., 2023, ApJ, 956, 46
work page 2023
- [73]
-
[74]
Soker, N.; Kashi, A., 2012, ApJ, 746, 100
work page 2012
-
[75]
W.-S.; et al., 2018, ATel 11456
Strader, J.; Chomiuk, L.; Holoien, T. W.-S.; et al., 2018, ATel 11456
work page 2018
-
[76]
D.; Taddia, F.; Fraser, M.; et al., 2020, A&A, 639, A103
Stritzinger, M. D.; Taddia, F.; Fraser, M.; et al., 2020, A&A, 639, A103
work page 2020
- [77]
-
[78]
Thompson, T. A.; Prieto, J. L.; Stanek, K. Z.; et al., 2009, ApJ, 705, 1364
work page 2009
-
[79]
Tylenda, R.; Kamiński, T.; Schmidt, M.; et al., 2011, A&A, 532, 138
work page 2011
-
[80]
K.; Kamiński, T.; Schmidt, M., 2015, A&A, 578, 75
Tylenda, R.; Górny, S. K.; Kamiński, T.; Schmidt, M., 2015, A&A, 578, 75
work page 2015
discussion (0)
Sign in with ORCID, Apple, or X to comment. Anyone can read and Pith papers without signing in.