pith. sign in

arxiv: 2605.21617 · v2 · pith:54PNUDIHnew · submitted 2026-05-20 · 💻 cs.LG · q-bio.QM

textit{BlockFormer} : Transformer-based inference from interaction maps

Pith reviewed 2026-05-22 09:11 UTC · model grok-4.3

classification 💻 cs.LG q-bio.QM
keywords BlockFormertransformerHi-Ccentromere localizationinteraction mapssynthetic datagenomicsinverse problems
0
0 comments X

The pith

A transformer trained on synthetic data accurately locates centromeres from Hi-C interaction maps across many species.

A machine-rendered reading of the paper's core claim, the machinery that carries it, and where it could break.

The paper presents a transformer-based approach for inferring parameters from interaction maps that have blocks of variable numbers and sizes. It uses a custom simulator to generate training data and leverages shared structures like global alignments in the maps. This method is applied to centromere localization in genome-wide chromosome conformation capture data. If the approach holds, it could provide a general way to analyze such maps without species-specific tuning.

Core claim

The authors claim that their BlockFormer transformer architecture, trained on abundant synthetic interaction maps, can accurately recover the genomic positions of centromeres from real Hi-C data across a wide range of species with varying genome sizes.

What carries the argument

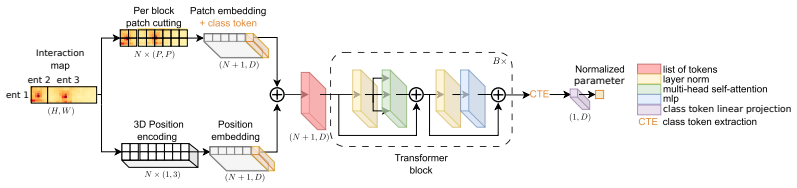
The BlockFormer transformer that processes interaction maps with variable entity numbers and sizes to infer localized parameters like centromere positions.

If this is right

  • Accurate centromere position recovery in species with different genome sizes.
  • Generalization to other inverse problems involving interaction maps.
  • Reduced reliance on manual annotation or per-species models for genomic feature detection.
  • Scalable analysis using computationally cheap synthetic training data.

Where Pith is reading between the lines

These are editorial extensions of the paper, not claims the author makes directly.

  • Similar methods could apply to other pairwise interaction data in biology or physics.
  • Training on synthetic data might reduce the need for large real datasets in genomic inference tasks.
  • Extensions could handle even more variable or noisy interaction maps from different experimental techniques.

Load-bearing premise

Interaction maps from different species share enough common structure, such as aligned localized patterns, for a single transformer model to handle the variability in block numbers and sizes.

What would settle it

The model producing inaccurate centromere positions when tested on Hi-C maps from a species whose interaction patterns deviate substantially from those in the synthetic training data.

Figures

Figures reproduced from arXiv: 2605.21617 by Elo\"ise Touron, Julyan Arbel, Michael Arbel, Nelle Varoquaux, Pedro L. C. Rodrigues.

Figure 1
Figure 1. Figure 1: Inference from interaction maps using BlockFormer (see architecture in [PITH_FULL_IMAGE:figures/full_fig_p002_1.png] view at source ↗
Figure 2
Figure 2. Figure 2: Architecture of BlockFormer. The input is any sequence of blocks of interactions between entity i and others and the output is the parameter estimation θi. In the context of chromatin structure, Hi-C–based graph approaches such as [12, 34] model contact maps as graphs and apply graph neural networks (GNNs) or graph attention networks (GATs) to reconstruct 3D genome organization or infer functional relation… view at source ↗
Figure 3
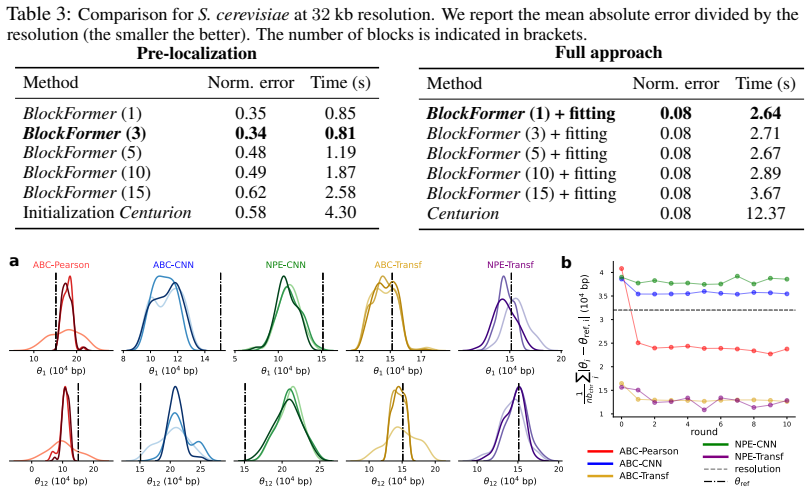
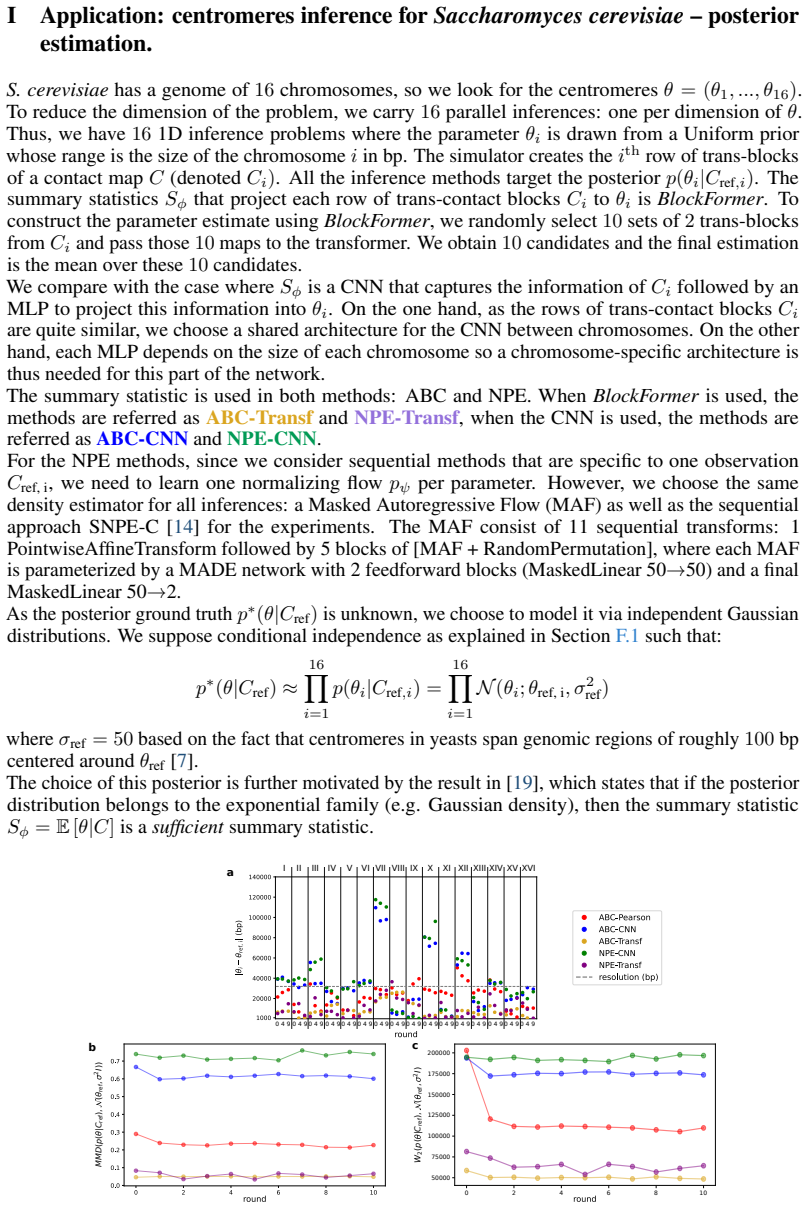
Figure 3. Figure 3: Inference using ABC-Pearson (see Appendix G.1), ABC-CNN, ABC-Transf, (see Appendix G.2) NPE-CNN, and NPE-Transf (a) (see Appendix H). Color shades increase from lightest to darkest across rounds. Densities are estimated with the 5% best θ according to the ABC criterion or sampled from the flow. In some dimensions, only the BlockFormer-based approaches ABC-Transf and NPE-Transf are accurate (e.g. the densit… view at source ↗
Figure 4
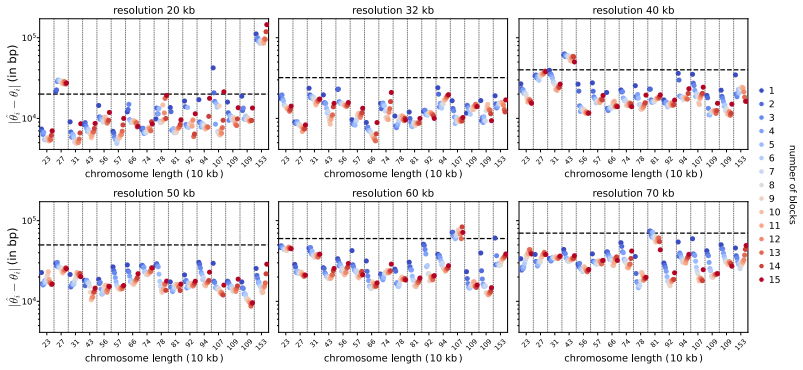
Figure 4. Figure 4: Absolute error per centromere over 100 synthetic maps generated from the S.C. genome. For each number of blocks k and each chromosome i, we report the absolute error errk i (see details in J.2). Target chromosomes i on the x-axis are sorted by length (bp). Color shades range from blue to red as the number of blocks k increases from 1 to 15. Across resolutions, the centromeres are estimated with a precision… view at source ↗
Figure 5
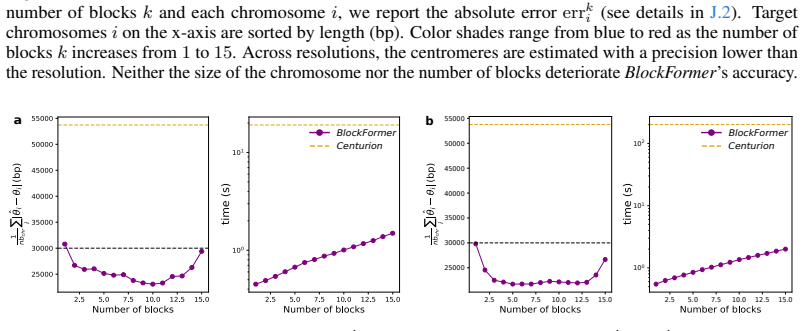
Figure 5. Figure 5: Mean absolute error (in bp, 1st and 3rd panels) and runtime (in seconds, 2nd and 4th panels) over 100 synthetic maps generated from the S.C. genome at resolution 30 kb. a: per trans-block, one major Gaussian spot and one auxiliary Gaussian spot, smaller and less bright. b: Square spot in each trans-block. The black dotted line stands for the resolution. Square spots. If large regions of DNA interact, leadi… view at source ↗
Figure 6
Figure 6. Figure 6: Process to construct a contact map in the case of 2 chromosomes. A.2 Hi-C map normalization. To correct biases in reference maps, we use ICE normalization via the Python library iced with the function ICE_normalization from the module normalization. B A state-of-the-art method for centromere identification: Centurion [32] tackled the problem of centromere identification based on Hi-C data with an algorithm… view at source ↗
Figure 7
Figure 7. Figure 7: reference Hi-C map (left) and a simulated map (right) generated from the S.C. reference genome (resolution 32 kb). 16 [PITH_FULL_IMAGE:figures/full_fig_p016_7.png] view at source ↗
Figure 8
Figure 8. Figure 8: (top) Contact maps of yeasts S.C., L.T., and S.M., shown in the following order: simulated map Csimu, map with real spots and simulated noise Cspot, real map without telomere interactions Ccent, and real map transported to the closest simulated one Ctrans. (bottom) Histograms of pixel-normalized values. 18 [PITH_FULL_IMAGE:figures/full_fig_p018_8.png] view at source ↗
Figure 9
Figure 9. Figure 9: Examples of simulated maps, the number and the size of blocks vary. We provide sequences of trans-blocks created from synthetic genome of 2, 4, 6, 8 or 10 chromosomes. The spots also vary in size (σ 2 ) and locations (θ). 21 [PITH_FULL_IMAGE:figures/full_fig_p021_9.png] view at source ↗
Figure 10
Figure 10. Figure 10: Mean normalized error with standard deviation. BlockFormer (BF) outperforms all the others methods especially for high number of blocks, showing that maps with various number of blocks in the training set is necessary to maintain sub-resolution accuracy no matter the number of blocks (under 1). 25 [PITH_FULL_IMAGE:figures/full_fig_p025_10.png] view at source ↗
Figure 11
Figure 11. Figure 11: Mean normalized error with standard deviation. BlockFormer (BF) outperforms all the others methods showing that adding noise and making spot size vary in the training set is necessary to have sub￾resolution accuracy (under 1). 26 [PITH_FULL_IMAGE:figures/full_fig_p026_11.png] view at source ↗
Figure 12
Figure 12. Figure 12: We report the absolute error per dimension of θ between the mean θ computed over the 5% best θ according to the ABC criterion or sampled from the flow and θref (a) as well as the MMD (b) and the Wasserstein-2 distance (c) between p(θ|Cref) and δθref . The horizontal dotted line stands for the resolution of the contact map Cref (in bp) in the top figure. 32 [PITH_FULL_IMAGE:figures/full_fig_p032_12.png] view at source ↗
Figure 13
Figure 13. Figure 13: (top) Simulation-Based Calibration rank. (bottom) Expected coverage of level α = 90%. The posteriors are globally well calibrated: in many dimensions, the histograms are roughly flat and the expected coverage are close to the nominal level (e.g. for θ1, θ6 or θ11). However, some dimensions exhibit U-shape histograms as well as coverage under the nominal level (e.g. for θ4 or θ8) indicating overconfident p… view at source ↗
Figure 14
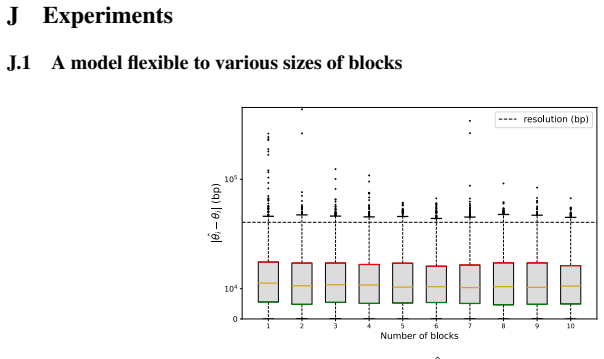
Figure 14. Figure 14: Boxplot of the absolute error between estimated ˆθi and ground truth θi averaged over 1 000 synthetic contact maps per number of trans-blocks k, where k varies from 1 to 10 .The maps are generated at resolution 32 kb from a synthetic genome of k + 1 chromosomes, whose sizes vary from 2 × 10⁵ bp to 2 Mbp. At this resolution, each trans-block has a size varying between 6 and 62 pixels. In all the cases, mor… view at source ↗
Figure 15
Figure 15. Figure 15: Absolute error per centromere over 100 synthetic contact maps generated from the S.C. genome (a) and (b) and one reference map (c) and (d) with 10% or 50% of sequencing depth. Chromosomes on the x-axis are sorted by length (bp). Color shades range from blue to red as the number of blocks k increases from 1 to 15. 36 [PITH_FULL_IMAGE:figures/full_fig_p036_15.png] view at source ↗
Figure 16
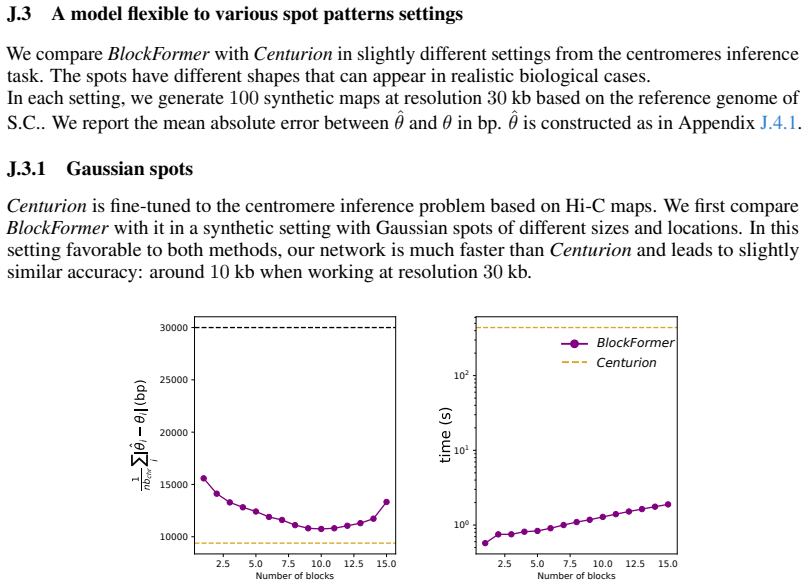
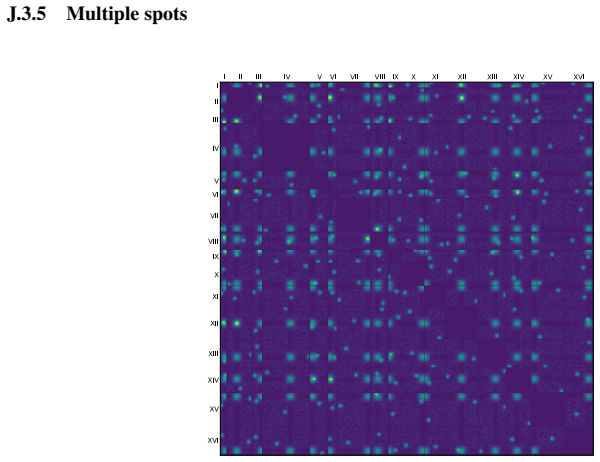
Figure 16. Figure 16: Mean absolute error (bp, left) and runtime (s, right) over 100 synthetic maps generated from the S.C. genome at resolution 30 kb. The spots in each trans-block are Gaussian. The black dotted line in the left plot represents the resolution of the maps. J.3.2 Square spots [PITH_FULL_IMAGE:figures/full_fig_p037_16.png] view at source ↗
Figure 17
Figure 17. Figure 17: One synthetic map simulated from the S.C. reference genome with square spots in each trans-block. 37 [PITH_FULL_IMAGE:figures/full_fig_p037_17.png] view at source ↗
Figure 18
Figure 18. Figure 18: One synthetic map simulated from the S.C. reference genome with elliptical spots in each trans￾block. When the spots are elliptical, both methods output under-resolution parameter estimation. Centurion is 1.5 more accurate but more than 10 times slower than BlockFormer. 2.5 5.0 7.5 10.0 12.5 15.0 Number of blocks 10000 15000 20000 25000 30000 2.5 5.0 7.5 10.0 12.5 15.0 Number of blocks 100 101 Centurion B… view at source ↗
Figure 19
Figure 19. Figure 19: Mean absolute error (bp, left) and runtime (s, right) over 100 synthetic maps generated from the S.C. genome at resolution 30 kb. The spots in each trans-block are ellipse. The black dotted line in the left plot represents the resolution of the maps. 38 [PITH_FULL_IMAGE:figures/full_fig_p038_19.png] view at source ↗
Figure 20
Figure 20. Figure 20: One synthetic map simulated from the S.C. reference genome with ring spots in each trans-block. When the spots in the maps are rings instead of Gaussian spots, Centurion has difficulties to output accurate results in reasonable time. Our approach is 1.2 times less accurate than Centurion since the accuracy is around twice the resolution but the runtime is nearly 102 smaller. 2.5 5.0 7.5 10.0 12.5 15.0 Num… view at source ↗
Figure 21
Figure 21. Figure 21: Mean absolute error (bp, left) and runtime (s, right) over 100 synthetic maps generated from the S.C. genome at resolution 30 kb. The spots in each trans-block are rings. The black dotted line in the left plot represents the resolution of the maps. 39 [PITH_FULL_IMAGE:figures/full_fig_p039_21.png] view at source ↗
Figure 22
Figure 22. Figure 22: One synthetic map simulated from the S.C. genome with two Gaussian spots per trans-block. When the contact maps are noisy: with 2 Gaussian spots per trans-blocks, one major and one auxiliary smaller and less bright, our model outperforms Centurion in both speed and accuracy, achieving 1.8 times better accuracy while running 10 times faster. Moreover, our method manages to estimate θ at a precision under t… view at source ↗
Figure 23
Figure 23. Figure 23: One synthetic map simulated from the S.C. reference genome with noise. When the map is noisy: per trans-block, we add traps consisting in 5 random pixels with intensity equal the maximum of the block, Centurion produces estimates with a precision exceeding the map resolution, whereas our method is able to estimate θ with sub-resolution accuracy. In this setting Centurion is 2.5 times less accurate than ou… view at source ↗
Figure 24
Figure 24. Figure 24: Absolute error (bp, left) and runtime (s, right) over 100 synthetic maps generated from the S.C. genome at resolution 30 kb. Per trans-block, we add 5 random pixels with intensity the maximum of the bloc. The black dotted line in the left plot represents the resolution of the maps. 41 [PITH_FULL_IMAGE:figures/full_fig_p041_24.png] view at source ↗
Figure 25
Figure 25. Figure 25: Centromere estimation for the yeasts L.T. (left) and L.K. (right), resolution 30 kb. 42 [PITH_FULL_IMAGE:figures/full_fig_p042_25.png] view at source ↗
Figure 26
Figure 26. Figure 26: Loops detection at resolution 5 kb in automated selected genomic regions of chromosomes 1 (left), 3 (middle) and 7 (right). BlockFormer (referred as BF) or Centurion (referred as Cent.) take as input pre-localized regions in the observed-over-expected maps. Red lines in the top plots indicate the mean error. Depending on the region, BlockFormer does not always estimate loops at under-resolution precision … view at source ↗
Figure 27
Figure 27. Figure 27: Example of observed-over-expected maps used as input to BlockFormer for loop position estimation. Only the upper (left) or lower (right) triangular part is considered for respectively the y- or x- coordinate estimations. Dashed lines represent the model’s predictions of the loops [PITH_FULL_IMAGE:figures/full_fig_p046_27.png] view at source ↗
Figure 28
Figure 28. Figure 28: Loops detection at resolution 5 kb in selected genomic regions of chromosomes 1 (left), 3 (middle) and 7 (right). Loops appear as bright off-diagonal enrichment spots. BlockFormer takes as input the upper or lower triangular part of the observed-over-expected maps. Chromosight takes as input the entire raw map but considers only the upper triangular part. Dashed lines represent model’s loop predictions, w… view at source ↗
read the original abstract

Inference from interaction maps, such as centromere identification from genome-wide chromosome conformation capture techniques -- notably Hi-C -- can be formulated as a generic inverse problem: infer a set of parameters given a map summarizing pairwise interactions between entities through blocks of variable numbers and sizes. In this work, we introduce a data-driven approach that leverages shared structure between these maps, such as global alignment between localized patterns, while handling the variability in number and size of entities arising in real-world data. Our approach relies on a transformer architecture capable of handling such variability and a custom simulator to generate abundant, yet computationally cheap synthetic data for training. Applied to the problem of centromere localization, the method accurately recovers their genomic positions across a wide range of species of various genome sizes.

Editorial analysis

A structured set of objections, weighed in public.

Desk editor's note, referee report, simulated authors' rebuttal, and a circularity audit. Tearing a paper down is the easy half of reading it; the pith above is the substance, this is the friction.

Referee Report

2 major / 2 minor

Summary. The manuscript introduces BlockFormer, a transformer architecture for inferring a set of parameters from interaction maps that share global alignment of localized patterns but exhibit variability in the number and size of entities. Training relies on synthetic data from a custom simulator; the method is applied to centromere localization in Hi-C maps and claims accurate recovery of genomic positions across species with varying genome sizes.

Significance. If the simulator-to-real generalization is substantiated, the work provides a scalable, data-driven alternative to traditional inverse-problem methods for interaction maps, leveraging transformer flexibility for variable-length inputs without fixed entity assumptions. This could benefit automated analysis in genomics and related domains where interaction matrices arise.

major comments (2)
  1. Abstract: the claim that the method 'accurately recovers' centromere genomic positions across species supplies no quantitative metrics, baseline comparisons, error bars, or validation details, leaving the central empirical claim unsupported on the information given.
  2. Simulator and training description (Methods section): the custom simulator used to generate training interaction maps is not shown to reproduce key statistical features of real Hi-C data (contact decay, compartment biases, noise structure, variable block sizes); without such fidelity checks the simulator-to-real transfer that underpins the generalization claim remains unvalidated.
minor comments (2)
  1. Clarify the precise tokenization and positional encoding scheme used to accommodate variable numbers of blocks within the transformer input.
  2. Figure captions and axis labels should explicitly state the species, genome sizes, and quantitative recovery metrics shown.

Simulated Author's Rebuttal

2 responses · 0 unresolved

We thank the referee for their constructive feedback, which has helped us identify areas where the manuscript can be strengthened. We address each major comment below and outline the revisions we will make.

read point-by-point responses
  1. Referee: Abstract: the claim that the method 'accurately recovers' centromere genomic positions across species supplies no quantitative metrics, baseline comparisons, error bars, or validation details, leaving the central empirical claim unsupported on the information given.

    Authors: We agree that the abstract's claim would be better supported by quantitative evidence. The original abstract was kept concise to highlight the overall contribution, but this omitted key details from our experiments. In the revised manuscript we will expand the abstract to include specific performance metrics (e.g., mean absolute error in base-pair localization with standard deviation across species) and a brief reference to baseline comparisons performed in the results section. revision: yes

  2. Referee: Simulator and training description (Methods section): the custom simulator used to generate training interaction maps is not shown to reproduce key statistical features of real Hi-C data (contact decay, compartment biases, noise structure, variable block sizes); without such fidelity checks the simulator-to-real transfer that underpins the generalization claim remains unvalidated.

    Authors: The referee is correct that explicit fidelity validation was not included in the submitted version. While the simulator was designed to capture the block-like interaction patterns and length variability central to centromere localization, we did not present direct statistical comparisons (such as contact decay curves or block-size histograms) against real Hi-C data. We will add a dedicated subsection to the Methods (or supplementary material) that quantifies these matches, including plots and metrics for contact probability decay, noise levels, and block-size distributions between simulated and real maps from the evaluated species. revision: yes

Circularity Check

0 steps flagged

No circularity: training on independent custom simulator with real-data evaluation

full rationale

The paper formulates centromere localization as an inverse problem and solves it via a transformer trained exclusively on synthetic interaction maps produced by a custom simulator, then evaluated on real Hi-C data from multiple species. No equations or claims reduce a prediction to a fitted parameter on the same data, no self-definitional loops appear, and no load-bearing self-citations or uniqueness theorems are invoked to force the architecture or results. The simulator-to-real transfer is an external generalization step rather than a tautological renaming or fit; the derivation chain therefore remains self-contained against external benchmarks.

Axiom & Free-Parameter Ledger

0 free parameters · 0 axioms · 0 invented entities

Review performed from abstract only; no explicit free parameters, axioms, or invented entities are stated in the provided text.

pith-pipeline@v0.9.0 · 5672 in / 977 out tokens · 35870 ms · 2026-05-22T09:11:37.595565+00:00 · methodology

discussion (0)

Sign in with ORCID, Apple, or X to comment. Anyone can read and Pith papers without signing in.

Lean theorems connected to this paper

Citations machine-checked in the Pith Canon. Every link opens the source theorem in the public Lean library.

What do these tags mean?
matches
The paper's claim is directly supported by a theorem in the formal canon.
supports
The theorem supports part of the paper's argument, but the paper may add assumptions or extra steps.
extends
The paper goes beyond the formal theorem; the theorem is a base layer rather than the whole result.
uses
The paper appears to rely on the theorem as machinery.
contradicts
The paper's claim conflicts with a theorem or certificate in the canon.
unclear
Pith found a possible connection, but the passage is too broad, indirect, or ambiguous to say the theorem truly supports the claim.