REVIEW 4 major objections 5 minor 59 references
Exploring Quasar Variability With ZTF at 0<z<3: A Universal Relation with Eddington Ratio
T0 review · 4 major / 5 minor · reviewed 2026-08-15 · deepseek-v4-flash
Pith's one-line read Quasar flicker rate predicts black hole feeding pace across z=0 to z=3.
desk verdict The underlying Fvar–λEdd anti-correlation is real and the sample is solid, but Eq. 5 as a universal predictor does not survive the paper's own Table 4. read the letter →
The pith
A machine-rendered reading of the paper's core claim, the machinery that carries it, and where it could break.
The reading
What carries the argument
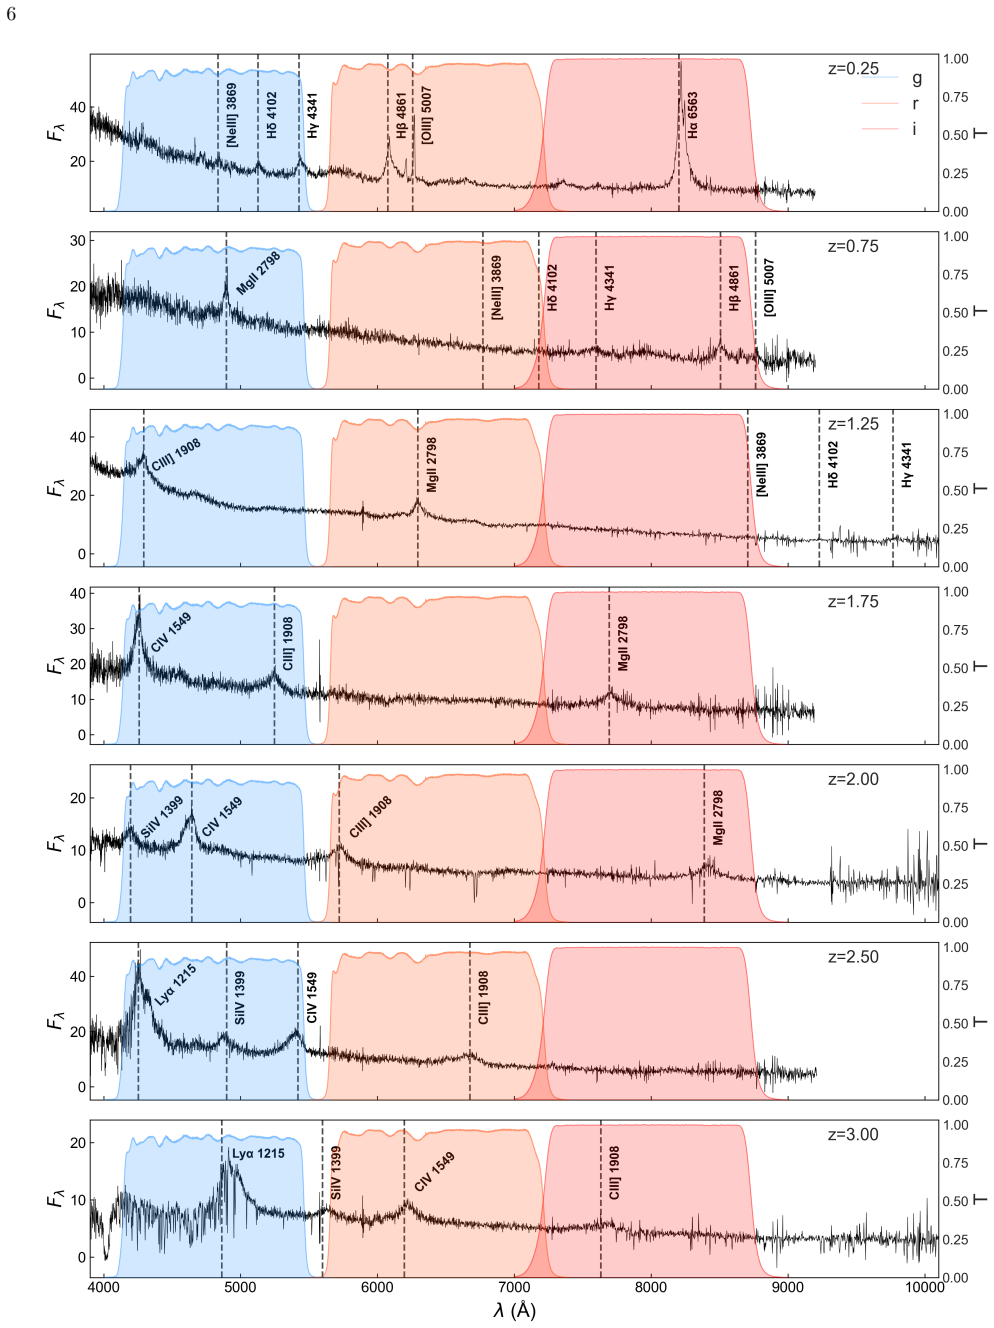
The load-bearing quantity is fractional variability $F_{\rm var}$, the excess variance of a light curve normalized by its mean flux, computed after subtracting the average measurement-error variance. It is measured from ZTF g-band light curves binned to one-day means, after removing outliers and requiring at least 100 points. Because the Eddington ratio normalizes bolometric luminosity by the Eddington luminosity, it removes most of the mass and redshift dependence carried by luminosity alone; the weighted least-squares regressions of $\log\lambda_{\rm Edd}$ against $\log F_{\rm var}$ are the machinery that produces Equation 5.
What would settle it
Extend the $z\approx2$-$3$ light curves to a rest-frame baseline comparable to low redshift, roughly 2000 days as LSST monitoring will provide, and recompute $F_{\rm var}$. If high-redshift $F_{\rm var}$ values rise substantially, the universal relation steepens or becomes redshift-dependent; if they stay put, the relation is confirmed.
Extended reading notes
Core claim
The central claim is that the Eddington ratio, not luminosity or black hole mass alone, is the physical parameter that organizes optical quasar variability across cosmic time. Over the full $0<z<3$ sample, the measured fractional variability in the g-band obeys $\log\lambda_{\rm Edd}=(-0.71\pm0.06)\log F_{\rm var}-(1.52\pm0.06)$ with $R^2=0.15$ and global correlation $r=-0.31$; the authors state that this relation is particularly useful to estimate the Eddington ratio of a general quasar at $0<z<3$ from its measured $F_{\rm var}$. They interpret the anti-correlation physically: at high accretion rates the disk radiates more efficiently and the stochastic amplitude of brightness changes is suppressed relative to the mean. The paper does not claim the relation is exact; it presents it as a robust empirical framework with redshift-dependent scatter, weakest at $2<z<3$.
Load-bearing premise
The comparison treats $F_{\rm var}$ measured at different redshifts as equivalent, even though the rest-frame baseline shrinks from about 2000 days at $z\approx0$ to about 500 days at $z\approx3$ and the g-band moves to progressively bluer rest wavelengths.
Editorial extensions
If this is right
- Eddington ratios for quasars at $0<z<3$ can be estimated from single-band photometric variability alone, without spectra.
- Upcoming high-cadence surveys can map accretion states over large quasar samples and cosmic time using one photometric relation.
- The redshift dependence seen in luminosity and black-hole-mass correlations is largely a selection effect; Eddington ratio is the underlying variable.
- The weaker high-redshift correlation points to a timescale requirement: variability metrics need rest-frame baselines long enough to capture the full fluctuation power.
Reading between the lines
- If the relation survives longer baselines, variability could serve as a cheap proxy for black-hole growth rate in surveys too faint for spectroscopy, complementing X-ray and radio accretion indicators.
- A natural test is to apply Equation 5 to r-band or i-band light curves; if the same slope holds across bands, the relation is truly wavelength-independent and not a g-band artifact.
- One could check individual high-Eddington quasars known from single-epoch spectra: those with low $F_{\rm var}$ should systematically be the most efficiently accreting, and outliers may flag unreliable virial mass estimates.
Signed reviews
Editorial analysis
A structured set of objections, weighed in public.
Referee Report
Summary. The paper analyzes ZTF g-band photometric variability for 915 quasars from the AQMES-MED sample and correlates the fractional variability Fvar with bolometric luminosity, black hole mass, and Eddington ratio across five redshift bins from 0 to 3. The authors report an anti-correlation between Fvar and luminosity, a redshift-dependent Fvar-MBH relation, and a global anti-correlation between log lambda_Edd and log Fvar. This global relation is expressed as Eq. (5) and is claimed to be nearly redshift independent and useful for estimating Eddington ratios of quasars at 0<z<3.
Significance. If the claimed universal lambda_Edd-Fvar relation were established, it would provide a simple photometric estimator of Eddington ratio across a wide redshift range and a useful constraint for accretion-disk variability models. The paper contributes a carefully constructed sample, explicit checks on emission-line contamination in the photometric bands, publicly available filtering code, and a machine-readable catalog of variability and spectral properties. However, the central claim of a universal, redshift-invariant relation is not supported by the paper's own bin-dependent fits, and the global relation's predictive power is weak. The lasting value of the work is likely the descriptive correlations and the data products rather than Eq. (5) as currently stated.
major comments (4)
- [Section 4.4 and Table 4] The claim that the WLS fits are "all very similar" for 0<z<2 is contradicted by Table 4: the slopes are -0.99, -0.32, -0.48, -0.43, and -0.16 across the five redshift bins. The lowest-redshift slope differs from the adjacent bin by roughly a factor of three, and the 2<z<3 bin has R^2=0.01, which is effectively no within-bin correlation. Therefore Eq. (5), presented as a universal 0<z<3 relation, is not supported by the paper's own bin-resolved fits.
- [Section 4.4, Eq. (5)] The global regression may reflect between-bin covariance rather than an intrinsic physical relation. Higher-redshift quasars in this sample have higher lambda_Edd and lower Fvar, with the latter partly caused by the rest-frame baseline shrinking from about 2000 days at z~0 to about 500 days at z~3 (Section 4.1). The authors should report partial correlations controlling for redshift and quantify the global fit after formally excluding or down-weighting the highest-redshift bin; the statement that the correlation coefficient remained unchanged after excluding that bin is not accompanied by any quantitative result.
- [Section 4.4, Eq. (5)] The predictive utility claimed for Eq. (5) is not established. The relation is an in-sample fit to the same 915 objects with R^2=0.15, and no independent validation set or cross-validation is provided. With R^2=0.15, the scatter in inferred lambda_Edd is large relative to the dynamic range of the relation, so the phrase "particularly useful to estimate the Eddington ratio" needs quantitative support, such as a scatter plot of predicted versus measured lambda_Edd or a cross-validated prediction interval.
- [Section 4.1 and Section 4.4] The systematic redshift dependence of the rest-frame monitoring baseline and rest-frame wavelength is load-bearing for the universality claim. The paper concedes that the rest-frame interval at z>2 may be insufficient to fully capture variability. If high-z Fvar values are systematically underestimated, the observed flattening of the lambda_Edd-Fvar relation at high redshift is an expected artifact, not evidence of a universal relation. The authors should either quantify this effect by recomputing Fvar on matched rest-frame baselines or explicitly restrict the claimed generality of Eq. (5) to z<2.
minor comments (5)
- [Abstract] The sentence "an anti-correlation the highest redshifts" is missing the word "at" before "the highest redshifts."
- [References] Lu et al. (2019) and Vanden Berk et al. (2004) each appear twice in the reference list with slightly different citation details; these duplicates should be merged.
- [Eq. (4)] The second term in Eq. (4) uses sigma_err without a clear definition; if it denotes the standard deviation of the measurement errors, that should be stated explicitly, and the notation should be made consistent with sigma^2_err used in Eqs. (2) and (3).
- [Figure 11 and Section 4.4] The caption of Figure 11 describes a green shaded region as a 95% prediction interval, while the text in Section 4.4 refers to the green-shaded region as the 95% confidence interval; these statements should be aligned.
- [Section 2.2] The phrase "approximately 2000 MJDs in the rest frame per source" is ambiguous: it likely means roughly 2000 epochs or a baseline in MJD units, but the wording should be clarified to distinguish the number of epochs from the temporal baseline.
Circularity Check
Eq. (5) is the in-sample WLS regression of the same 915 quasars, so its advertised use as a predictor of Eddington ratio reduces to the fitted line; no self-citation chain or definitional circularity is present.
-
fitted input called prediction
[Section 4.4, Eq. (5), Fig. 11]
"logλEdd = (−0.71 ± 0.06)·logFvar−(1.52 ± 0.06) (5) This relation is particularly useful to estimate the Eddington ratio of a general quasar at 0<z<3 from its measured Fvar"
Equation (5) is not derived from an independent physical principle; it is the WLS regression of log λEdd on log Fvar for the same 915 quasars whose individual bins and overall fit are shown in Figs. 10-11 and Table 4. The suggested use, to 'estimate the Eddington ratio ... from its measured Fvar', is an evaluation of the fitted line on the training sample, so the claimed prediction is the regression equation itself. The abstract's 'or vice-versa' is likewise just the algebraic inverse of Eq. (5). No held-out sample or external benchmark is provided, so the predictive claim reduces by construction to the fitted relation.
full rationale
No load-bearing self-citations or imported uniqueness theorems appear: earlier work by the authors is cited for background and for spectral fitting tools, not to force the central relation. The λEdd-Fvar anti-correlation is an empirical fit between independently measured quantities and therefore is not self-definitional. The concrete circularity is confined to the presentation of Eq. (5): it is the in-sample regression of the 915-object sample, yet it is offered as 'particularly useful to estimate the Eddington ratio of a general quasar ... from its measured Fvar'. That is a fitted input called a prediction. Separately, and not as a circularity argument, Table 4's per-bin slopes range from -0.99 to -0.16 with R² values of 0.18, 0.03, 0.10, 0.12, and 0.01, which conflicts with the text's claim that the fits are 'all very similar' and makes the 'universal' relation statistically fragile, especially at 2<z<3. Those internal inconsistencies are correctness risks, not circularity. Because the central claim 'general equation ... enabling predictions' reduces to the fitted line, a partial-circularity score of 6 is appropriate.
Assumptions & free parameters
free parameters (2)
- Slope a in Eq. 5 =
-0.71 ± 0.06
- Intercept b in Eq. 5 =
-1.52 ± 0.06
assumptions (4)
- domain assumption The excess variance after subtracting measurement noise traces intrinsic quasar variability.
- domain assumption Single-epoch virial black hole masses and Eddington ratios from Wu & Shen (2022) are unbiased across 0<z<3.
- domain assumption The AQMES sample, though not representative, is sufficient to infer a universal quasar relation.
- domain assumption Fvar values measured over different rest-frame baselines and wavelength coverages are comparable.
Cite this review
Pith. "Pith review of Exploring Quasar Variability With ZTF at 0<z<3: A Universal Relation with Eddington Ratio." pith.science (2026). https://pith.science/paper/54UQPNA3
@misc{pith2026250509779,
  author       = {Pith},
  title        = {Pith review of: Exploring Quasar Variability With ZTF at 0<z<3: A Universal Relation with Eddington Ratio},
  year         = {2026},
  howpublished = {\url{https://pith.science/paper/54UQPNA3}},
  note         = {Machine review of arXiv:2505.09779}
}
abstract
Quasars, powered by accretion onto supermassive black holes (SMBHs), exhibit significant variability, offering insights into the physics of accretion and the properties of the central engines. In this study, we analyze photometric variability and its correlation with key quasar properties, including black hole mass ($M_{\mathrm{BH}}$) and nuclear luminosities, using 915 quasars with $0\leq z<3.0$ from the AQMES sample monitored within SDSS-V. Variability metrics were derived from approximately 6-year light curves provided by the Zwicky Transient Facility -- ZTF, while SMBH masses and luminosities were obtained from the SDSS DR16 quasar catalog of \citet{wu2022catalog}. We identify a strong anti-correlation between variability amplitude and luminosity, which strengthens with redshift, and a redshift-dependent trend for $M_{\mathrm{BH}}$: a positive correlation at low redshifts, no significant correlation at intermediate redshifts, and an anti-correlation the highest redshifts. Our main finding is a robust anti-correlation between photometric variability amplitude and Eddington ratio, consistent across redshift bins. We present a general equation encapsulating this relationship, that appears to be almost free of redshift dependence, enabling predictions of quasar variability based on accretion parameters {\bf or vice-versa}. The derived relation with the Eddington ratio provides a unified framework for interpreting variability in active galactic nuclei (AGN) and facilitates future studies of quasar variability using high-cadence surveys, such as the Vera C. Rubin Observatory's Legacy Survey of Space and Time -- LSST.
Figures


Figures from the paper (8 more)


Reference graph
Works this paper leans on
-
[1]
Ai, Y. L., Yuan, W., Zhou, H. Y., et al. 2010, The Astrophysical Journal, 716, L31–L35, doi: 10.1088/2041-8205/716/1/l31
-
[2]
Ananna, T. T., Urry, C. M., Ricci, C., et al. 2022, ApJL, 939, L13, doi: 10.3847/2041-8213/ac9979 Ar´ evalo, P., Lira, P., S´ anchez-S´ aez, P., et al. 2023, Monthly Notices of the Royal Astronomical Society, 526, 6078, doi: 10.1093/mnras/stad1939
-
[3]
2014, in The Third Hot-wiring the Transient Universe Workshop, Vol
Bellm, E. 2014, in The Third Hot-wiring the Transient Universe Workshop, Vol. 27
work page 2014
-
[4]
Bellm, E. C., Kulkarni, S. R., Graham, M. J., et al. 2018, Publications of the Astronomical Society of the Pacific, 131, 018002, doi: 10.1088/1538-3873/aadd6c Benati Gon¸ calves, H. 2024, ZTF-Data-Filters, 0.1.0, doi: 10.5281/zenodo.10602737
-
[5]
Berk, D. E. V., Wilhite, B. C., Kron, R. G., et al. 2004, The Astrophysical Journal, 601, 692, doi: 10.1086/381195
-
[6]
1990, Physics Letters A, 150, 227, doi: 10.1016/0375-9601(90)90086-4
Bigot, G., & Triay, R. 1990, Physics Letters A, 150, 227, doi: 10.1016/0375-9601(90)90086-4
-
[7]
2018, Frontiers in Astronomy and Space Sciences, 5, 3, doi: 10.3389/fspas.2018.00003
Bon, N., Bon, E., & Marziani, P. 2018, Frontiers in Astronomy and Space Sciences, 5, 3, doi: 10.3389/fspas.2018.00003
-
[8]
Butkevich, A. G., Berdyugin, A. V., & Teerikorpi, P. 2005, MNRAS, 362, 321, doi: 10.1111/j.1365-2966.2005.09306.x
arXiv 2005
Show all 59 references
-
[9]
M., Bentz, M
Cackett, E. M., Bentz, M. C., & Kara, E. 2021, Iscience, 24, doi: 10.1016/j.isci.2021.102482
2021
-
[10]
2024, The Astrophysical Journal, 969, 131, doi: 10.3847/1538-4357/ad479a
Chanchaiworawit, K., & Sarajedini, V. 2024, The Astrophysical Journal, 969, 131, doi: 10.3847/1538-4357/ad479a
2024 doi
-
[11]
1996, Astronomy and Astrophysics, v
Cristiani, S., Trentini, S., La Franca, F., et al. 1996, Astronomy and Astrophysics, v. 306, p. 395, 306, 395, doi: 10.1051/0004-6361/19963034
1996 doi
-
[12]
2023, A&A, 675, A163, doi: 10.1051/0004-6361/202345844
Czerny, B., Panda, S., Prince, R., et al. 2023, A&A, 675, A163, doi: 10.1051/0004-6361/202345844
2023 doi
-
[13]
M., Riddle, R., et al
Dekany, R., Smith, R. M., Riddle, R., et al. 2020, Publications of the Astronomical Society of the Pacific, 132, 038001, doi: 10.1088/1538-3873/ab6ed6
2020 doi
-
[14]
C., & Trump, J
Elitzur, M., Ho, L. C., & Trump, J. R. 2014, Monthly Notices of the Royal Astronomical Society, 438, 3340, doi: 10.1093/mnras/stt2445
2014 doi
-
[15]
A., Richards, G
Fan, X., Strauss, M. A., Richards, G. T., et al. 2006, The Astronomical Journal, 131, 1203, doi: 10.1086/499497
2006 doi
-
[16]
Giveon, U., Maoz, D., Kaspi, S., Netzer, H., & Smith, P. S. 1999, Monthly Notices of the Royal Astronomical Society, 306, 637, doi: 10.1046/j.1365-8711.1999.02685.x
1999
-
[17]
J., Ross, N
Graham, M. J., Ross, N. P., Ford, K. E., et al. 2022, The Astrophysical Journal, 940, 20, doi: 10.3847/1538-4357/ac92a3
2022 doi
-
[18]
J., Kulkarni, S., Bellm, E
Graham, M. J., Kulkarni, S., Bellm, E. C., et al. 2019, Publications of the Astronomical Society of the Pacific, 131, 078001, doi: 10.1088/1538-3873/ab0647
2019 doi
-
[19]
2018, PyQSOFit: Python code to fit the spectrum of quasars, https://github.com/legolason/PyQSOFit
Guo, H., Shen, Y., & Wang, S. 2018, PyQSOFit: Python code to fit the spectrum of quasars, https://github.com/legolason/PyQSOFit
2018
-
[20]
J., Stone, R
Helfand, D. J., Stone, R. P., Willman, B., et al. 2001, The Astronomical Journal, 121, 1872, doi: 10.1086/319525
2001 doi
-
[21]
1994, Monthly Notices of the Royal Astronomical Society, 268, 305, doi: 10.1093/mnras/268.2.305 Ivezi´ c,ˇZ., Kahn, S
Hook, I., McMahon, R., Boyle, B., & Irwin, M. 1994, Monthly Notices of the Royal Astronomical Society, 268, 305, doi: 10.1093/mnras/268.2.305 Ivezi´ c,ˇZ., Kahn, S. M., Tyson, J. A., et al. 2019, ApJ, 873, 111, doi: 10.3847/1538-4357/ab042c
1994 doi
-
[22]
N., Maoz, D., et al
Kaspi, S., Brandt, W. N., Maoz, D., et al. 2007, ApJ, 659, 997, doi: 10.1086/512094
2007 doi
-
[23]
C., Bechtold, J., & Siemiginowska, A
Kelly, B. C., Bechtold, J., & Siemiginowska, A. 2009, The Astrophysical Journal, 698, 895, doi: 10.1088/0004-637X/698/1/895
2009 doi
-
[24]
C., Treu, T., Malkan, M., Pancoast, A., & Woo, J.-H
Kelly, B. C., Treu, T., Malkan, M., Pancoast, A., & Woo, J.-H. 2013, The Astrophysical Journal, 779, 187, doi: 10.1088/0004-637X/779/2/187
2013 doi
-
[25]
2019, Bulletin of the American Astronomical Society, doi: 10.3847/2041-8213/ab2c1f Koz lowski, S
Kollmeier, J., Anderson, S., Blanc, G., et al. 2019, Bulletin of the American Astronomical Society, doi: 10.3847/2041-8213/ab2c1f Koz lowski, S. 2017, ApJ, 835, 250, doi: 10.3847/1538-4357/aa56c0 Koz lowski, S., Kochanek, C. S., Udalski, A., et al. 2010, ApJ, 708, 927, doi: 10...
2019 doi
-
[26]
M., Cales, S., Moran, E
LaMassa, S. M., Cales, S., Moran, E. C., et al. 2015, ApJ, 800, 144, doi: 10.1088/0004-637X/800/2/144
2015 doi
-
[27]
2019, The Astrophysical Journal, 877, 23, doi: 10.3847/1538-4357/ab1f47
Lu, K.-X., Huang, Y.-K., Zhang, Z.-X., et al. 2019, The Astrophysical Journal, 877, 23, doi: 10.3847/1538-4357/ab1f47
2019 doi
-
[28]
2019, ApJ, 877, 23, doi: 10.3847/1538-4357/ab16e8
Lu, K.-X., Huang, Y.-K., Zhang, Z.-X., et al. 2019, ApJ, 877, 23, doi: 10.3847/1538-4357/ab16e8
2019 doi
-
[29]
2024, arXiv preprint arXiv:2403.10223
Ma, Q., Wen, Y., Wu, X.-B., Gu, H., & Fu, Y. 2024, arXiv preprint arXiv:2403.10223
2024 arXiv
-
[30]
L., Ivezi´ c,ˇZ., Kochanek, C
MacLeod, C. L., Ivezi´ c,ˇZ., Kochanek, C. S., et al. 2010, The Astrophysical Journal, 721, 1014–1033, doi: 10.1088/0004-637x/721/2/1014
2010 doi
-
[31]
2014, Annual Review of Astronomy and Astrophysics, 52, 415–486, doi: 10.1146/annurev-astro-081811-125615
Madau, P., & Dickinson, M. 2014, Annual Review of Astronomy and Astrophysics, 52, 415–486, doi: 10.1146/annurev-astro-081811-125615
2014 doi
- [32]
-
[33]
2024, The Astrophysical Journal, 966, 5, doi: 10.3847/1538-4357/acc123
Ming, Z., Zhang, F., & Yu, W. 2024, The Astrophysical Journal, 966, 5, doi: 10.3847/1538-4357/acc123
2024 doi
-
[34]
2019, MNRAS, 488, 5185, doi: 10.1093/mnras/stz2016
Netzer, H. 2019, MNRAS, 488, 5185, doi: 10.1093/mnras/stz2016
2019 doi
-
[35]
M., Gupta, A., & Rumbaugh, N
Neustadt, J. M., Gupta, A., & Rumbaugh, N. 2023, Monthly Notices of the Royal Astronomical Society, 522, 5588, doi: 10.1093/mnras/stad1813
2023 doi
-
[36]
L., & Zajaˇ cek, M
Panda, S., Mart´ ınez-Aldama, M. L., & Zajaˇ cek, M. 2019, Frontiers in Astronomy and Space Sciences, 6, doi: 10.3389/fspas.2019.00075
2019
-
[37]
2024, ApJS, 272, 11, doi: 10.3847/1538-4365/ad3549
Panda, S., Koz lowski, S., Gromadzki, M., et al. 2024, ApJS, 272, 11, doi: 10.3847/1538-4365/ad3549
2024 doi
-
[38]
2024, The Astrophysical Journal Supplement Series, 272, 13, doi: 10.3847/1538-4365/abc02b
Panda, S., & ´Sniegowska, M. 2024, The Astrophysical Journal Supplement Series, 272, 13, doi: 10.3847/1538-4365/abc02b
2024 doi
-
[39]
Peterson, B. M. 2001, in Advanced Lectures on the Starburst-AGN Connection (World Scientific), 3–68, doi: 10.1142/9789812797643 0001
2001 doi
-
[40]
Peterson, B. M. 2014, SSRv, 183, 253, doi: 10.1007/s11214-013-9987-4
2014 doi
-
[41]
M., Wanders, I., Horne, K., et al
Peterson, B. M., Wanders, I., Horne, K., et al. 1998, PASP, 110, 660, doi: 10.1086/316177
1998 doi
-
[42]
2017, The Astrophysical Journal, 842, 96, doi: 10.3847/1538-4357/aa77b9
Rakshit, S., & Stalin, C. 2017, The Astrophysical Journal, 842, 96, doi: 10.3847/1538-4357/aa77b9
2017 doi
-
[43]
2023, Nature Astronomy, 7, 1282, doi: 10.1038/s41550-023-02108-4
Ricci, C., & Trakhtenbrot, B. 2023, Nature Astronomy, 7, 1282, doi: 10.1038/s41550-023-02108-4
2023 doi
-
[44]
T., Strauss, M
Richards, G. T., Strauss, M. A., Fan, X., et al. 2006, The Astronomical Journal, 131, 2766, doi: 10.1086/503559
2006 doi
-
[45]
T., Strauss, M
Shen, Y., Richards, G. T., Strauss, M. A., et al. 2011, The Astrophysical Journal Supplement Series, 194, 45, doi: 10.1088/0067-0049/194/2/45
2011 doi
-
[46]
2016, Astronomy & Astrophysics, 585, A129, doi: 10.1051/0004-6361/201527735
Simm, T., Salvato, M., Saglia, R., et al. 2016, Astronomy & Astrophysics, 585, A129, doi: 10.1051/0004-6361/201527735
2016 doi
-
[47]
J., et al
Stern, D., McKernan, B., Graham, M. J., et al. 2018, ApJ, 864, 27, doi: 10.3847/1538-4357/aac726
2018 doi
-
[48]
Storchi-Bergmann, T., Schimoia, J. d. S., Peterson, B. M., et al. 2017, The Astrophysical Journal, 835, 236, doi: 10.3847/1538-4357/835/2/236
2017 doi
-
[49]
M., & Simmons, B
Treister, E., Schawinski, K., Urry, C. M., & Simmons, B. D. 2011, Nature, 474, 356, doi: 10.1038/nature10167 Vanden Berk, D. E., Wilhite, B. C., Kron, R. G., et al. 2004, ApJ, 601, 692, doi: 10.1086/380563 Vanden Berk, D. E., Wilhite, B. C., Kron, R. G., et al. 2004, The Astro...
2011 doi
-
[50]
S., & Uttley, P
Vaughan, S., Edelson, R., Warwick, R. S., & Uttley, P. 2003, MNRAS, 345, 1271, doi: 10.1046/j.1365-2966.2003.07042.x
2003
-
[51]
2010, The Astronomy and Astrophysics Review, 18, 279, doi: 10.1007/s00159-010-0029-2
Volonteri, M. 2010, The Astronomy and Astrophysics Review, 18, 279, doi: 10.1007/s00159-010-0029-2
2010 doi
-
[52]
M., & Malkan, M
Wandel, A., Peterson, B. M., & Malkan, M. A. 1999, ApJ, 526, 579, doi: 10.1086/308017
1999 doi
-
[53]
2022, The Astrophysical Journal, 936, 104, doi: 10.3847/1538-4357/ac88a1
Wang, S., Li, Y.-R., Zhang, Z.-X., et al. 2022, The Astrophysical Journal, 936, 104, doi: 10.3847/1538-4357/ac88a1
2022 doi
-
[54]
C., Brunner, R
Wilhite, B. C., Brunner, R. J., Grier, C. J., Schneider, D. P., & Vanden Berk, D. E. 2008, Monthly Notices of the Royal Astronomical Society, 383, 1232, doi: 10.1111/j.1365-2966.2008.12829.x
2008
-
[55]
2007, Monthly Notices of the Royal Astronomical Society, 375, 989, doi: 10.1111/j.1365-2966.2007.11414.x
Wold, M., Brotherton, M., & Shang, Z. 2007, Monthly Notices of the Royal Astronomical Society, 375, 989, doi: 10.1111/j.1365-2966.2007.11414.x
2007
-
[56]
2022, The Astrophysical Journal Supplement Series, 263, 42, doi: 10.3847/1538-4365/ac5c6e
Wu, Q., & Shen, Y. 2022, The Astrophysical Journal Supplement Series, 263, 42, doi: 10.3847/1538-4365/ac5c6e
2022 doi
-
[57]
2024, The Astrophysical Journal, 966, 128, doi: 10.3847/1538-4357/acc002
Wu, X., Shen, Y., & Chen, C. 2024, The Astrophysical Journal, 966, 128, doi: 10.3847/1538-4357/acc002
2024 doi
-
[58]
Graham, M. J. 2022, ApJ, 936, 132, doi: 10.3847/1538-4357/ac8351
2022 doi
-
[59]
2012, The Astrophysical Journal, 758, 104, doi: 10.1088/0004-637X/758/2/104
Zuo, W., Wu, X.-B., Liu, Y.-Q., & Jiao, C.-L. 2012, The Astrophysical Journal, 758, 104, doi: 10.1088/0004-637X/758/2/104
2012 doi
Reviewed August 15, 2026 · model on record in the stance chip above.
Discussion (0). Continue with ORCID to comment.