When Are Multimodal Predictions Biologically Supported? A Diagnostic Evaluation Framework
Pith reviewed 2026-06-28 22:48 UTC · model grok-4.3
The pith
DECAT shows entangled multimodal models falsely claim shared biology in most cases where it is absent.
A machine-rendered reading of the paper's core claim, the machinery that carries it, and where it could break.
Core claim
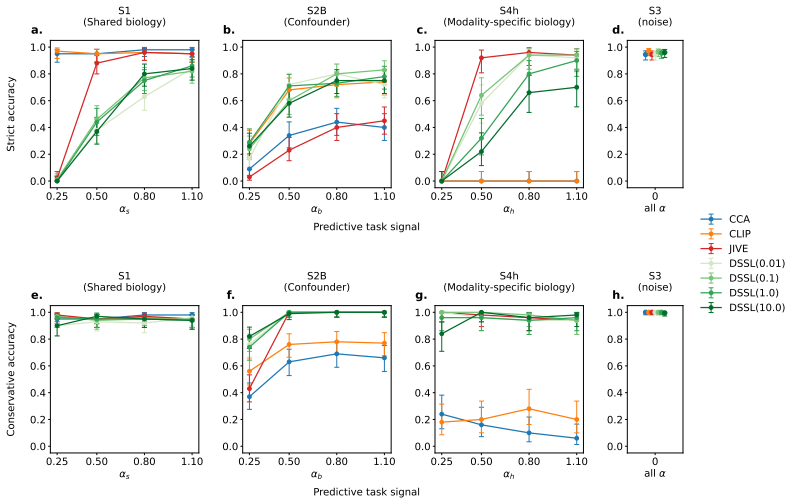
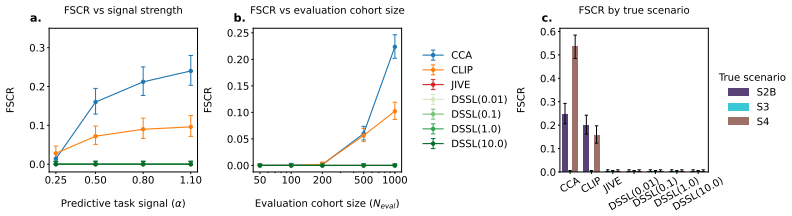
DECAT classifies multimodal representations into four diagnostic scenarios using five null-referenced metrics and a rule-based procedure; on both synthetic data and real TCGA embeddings, entangled models achieve near-perfect shared-biology detection while falsely claiming shared biology in the majority of cases where it is absent, with the false-claim rate increasing with confound strength so that larger cohorts and stronger representations yield more confident but incorrect diagnoses.
What carries the argument
The DECAT framework, a set of five null-referenced metrics plus a rule-based decision procedure that assigns each representation to one of four diagnostic scenarios without requiring confounder labels.
If this is right
- Standard AUROC evaluation cannot distinguish genuine shared biology from confounding in multimodal oncology models.
- Entangled training objectives increase the rate of false shared-biology claims as dataset size and representation strength grow.
- The framework can be applied to existing foundation models without paired modalities to surface confounding that performance metrics miss.
- Models labeled indeterminate by DECAT should not be interpreted as biologically supported for the given task.
Where Pith is reading between the lines
- Developers of multimodal foundation models could run DECAT as a routine post-training check before deploying predictions as biologically grounded.
- The same metric set might be adapted to other multimodal domains such as imaging-genomics pairs outside oncology.
- If the rule-based decision thresholds prove stable across cohorts, DECAT could serve as a lightweight filter for selecting representations for downstream biological interpretation.
Load-bearing premise
The five null-referenced metrics and rule-based procedure can reliably separate the four diagnostic scenarios even when the confounder is unknown and the representations come from real patient data with complex confounding.
What would settle it
A dataset in which the true presence or absence of shared biology and the identity of the confounder are known in advance, yet DECAT assigns the wrong diagnostic label to a majority of representations.
Figures


read the original abstract
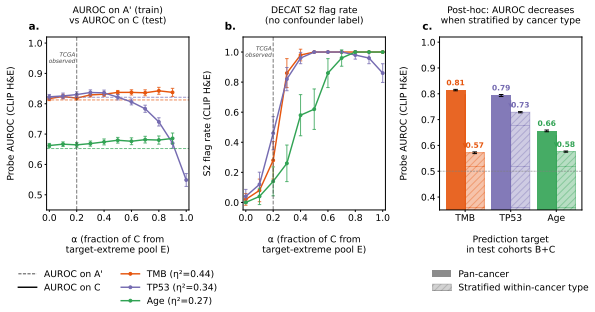
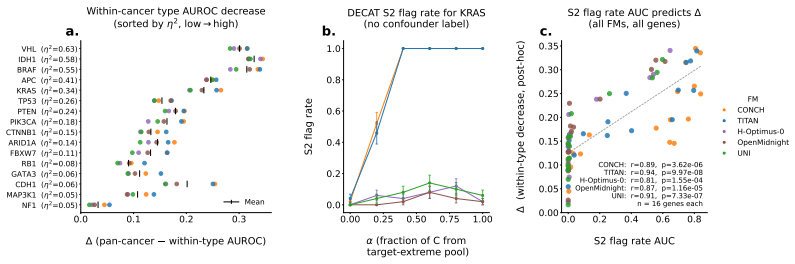
Multimodal models in oncology can produce accurate predictions, but accurate prediction does not reveal whether the model has learned biology that is shared across modalities, biology confined to one modality, or spurious correlations that reflect confounders rather than genuine biology. We introduce DECAT, a model-agnostic post-hoc evaluation framework that classifies multimodal representations into four diagnostic scenarios for a given task and modality, using five null-referenced metrics and a rule-based decision procedure. The framework operates on learned representations, requires no knowledge of which specific confounder is present, and returns indeterminate when the evidence is insufficient. We validate DECAT on synthetic data across four multimodal model classes (over 2,500 trained representations) and on real data from 8,979 TCGA patients, evaluating both multimodal embeddings and five pretrained pathology foundation models. Entangled models (e.g., CLIP) achieve near-perfect shared biology detection but falsely claim shared biology in the majority of cases where it is absent on real foundation model embeddings. This false claim rate increases with confound strength so that larger cohorts and stronger representations produce more confident but still incorrect diagnoses. Applied to both multimodal TCGA embeddings and five pathology foundation models without paired RNA, DECAT detects confounding invisible to AUROC without requiring the confounder labels, as confirmed by post-hoc stratification.
Editorial analysis
A structured set of objections, weighed in public.
Referee Report
Summary. The manuscript introduces DECAT, a model-agnostic post-hoc framework that classifies multimodal representations into four diagnostic scenarios (shared biology, modality-specific, spurious, indeterminate) using five null-referenced metrics and a rule-based decision procedure. It reports validation across >2500 synthetic representations from four multimodal model classes and application to embeddings from 8979 TCGA patients plus five pathology foundation models, with the central empirical claim that entangled models (e.g., CLIP) achieve near-perfect shared-biology detection on synthetic data but exhibit high false-positive rates on real embeddings, with the false-claim rate increasing with confound strength.
Significance. If the five null-referenced metrics and rule-based procedure can be shown to reliably separate the four scenarios on real patient embeddings whose confounding structure is unknown and more complex than the controlled synthetic cases, the framework would provide a useful post-hoc diagnostic for distinguishing biologically supported multimodal predictions from spurious ones in oncology, beyond standard metrics such as AUROC.
major comments (3)
- [Abstract] Abstract and methods (as referenced in the reader's note): the central claim that DECAT reliably maps representations to the four scenarios on real TCGA embeddings rests on the assumption that the null-referenced metrics plus rule-based procedure generalize from synthetic data (known confounder structure) to real data (unknown, multi-variable clinical confounding). No direct accuracy measurement against ground-truth scenario labels is provided when the confounder is withheld, leaving the reported false-claim rates for entangled models on real foundation-model embeddings without independent confirmation.
- [Abstract] Abstract: the statement that 'this false claim rate increases with confound strength' on real data requires a concrete operationalization of confound strength that does not rely on the same metrics used for classification; without it, the reported increase could be circular with the decision procedure itself.
- [Abstract] Abstract: the framework is described as returning 'indeterminate when the evidence is insufficient,' yet the abstract supplies no quantitative thresholds or decision rules for the five metrics, making it impossible to assess whether the procedure is parameter-free or whether post-hoc choices affect the reported false-claim rates.
minor comments (1)
- [Abstract] The abstract would benefit from a one-sentence definition or example of each of the four diagnostic scenarios to orient readers before the empirical claims.
Simulated Author's Rebuttal
We thank the referee for these constructive comments on the manuscript. We respond to each major comment below, indicating where revisions will be incorporated.
read point-by-point responses
-
Referee: [Abstract] Abstract and methods (as referenced in the reader's note): the central claim that DECAT reliably maps representations to the four scenarios on real TCGA embeddings rests on the assumption that the null-referenced metrics plus rule-based procedure generalize from synthetic data (known confounder structure) to real data (unknown, multi-variable clinical confounding). No direct accuracy measurement against ground-truth scenario labels is provided when the confounder is withheld, leaving the reported false-claim rates for entangled models on real foundation-model embeddings without independent confirmation.
Authors: We agree that ground-truth scenario labels cannot be obtained for real TCGA embeddings, as the true multi-variable confounding structure is unknown by design. The synthetic experiments (with held-out confounder structure) serve to validate that the five metrics and rule-based procedure recover the correct scenario when the generative process is known. On real data the framework is applied diagnostically, with post-hoc stratification by clinical variables providing corroborating evidence. We will add an explicit limitations paragraph in the Discussion clarifying this point and the reliance on synthetic validation for procedural soundness. revision: yes
-
Referee: [Abstract] Abstract: the statement that 'this false claim rate increases with confound strength' on real data requires a concrete operationalization of confound strength that does not rely on the same metrics used for classification; without it, the reported increase could be circular with the decision procedure itself.
Authors: Confound strength on real data is operationalized via two external proxies that are independent of the five DECAT metrics: (1) cohort size (larger TCGA subsets) and (2) representation strength (model scale and pre-training data volume of the five pathology foundation models). The abstract already alludes to this via the clause on larger cohorts and stronger representations. We will add a dedicated paragraph in Methods defining these proxies and include a supplementary table showing the monotonic relationship between these proxies and the observed false-claim rate. revision: yes
-
Referee: [Abstract] Abstract: the framework is described as returning 'indeterminate when the evidence is insufficient,' yet the abstract supplies no quantitative thresholds or decision rules for the five metrics, making it impossible to assess whether the procedure is parameter-free or whether post-hoc choices affect the reported false-claim rates.
Authors: The abstract is a high-level summary; the quantitative thresholds, null-referenced metric definitions, and the complete rule-based decision tree (including the indeterminate condition) are fully specified in the Methods section. No post-hoc parameter tuning was performed; the rules were fixed prior to the real-data experiments. We will add a sentence in the abstract directing readers to the Methods for the decision procedure if space allows. revision: partial
- Direct ground-truth scenario labels for real TCGA embeddings cannot be supplied because the true confounding structure is unknown and multi-variable; this is an inherent limitation of any diagnostic applied to observational clinical data.
Circularity Check
No significant circularity detected in DECAT framework or claims
full rationale
The paper introduces DECAT as a new model-agnostic post-hoc framework that applies five null-referenced metrics and a rule-based decision procedure to classify representations into four diagnostic scenarios. The abstract and provided text describe validation on over 2,500 synthetic representations with controlled confounder structure plus application to real TCGA embeddings from 8,979 patients and five foundation models. No equations, decision rules, or claims are shown to reduce by construction to fitted inputs on the same data, self-definitions, or load-bearing self-citations. The central results (near-perfect detection on entangled models, false claims on real embeddings, detection of confounding invisible to AUROC) are presented as empirical outcomes of the independent framework rather than tautological renamings or forced predictions. The derivation chain remains self-contained against external benchmarks.
Axiom & Free-Parameter Ledger
free parameters (1)
- decision thresholds
axioms (1)
- domain assumption Null-referenced metrics can separate shared biology, modality-specific biology, and confounding without knowledge of the specific confounder identity
Reference graph
Works this paper leans on
-
[1]
Richard J. Chen, Ming Y . Lu, Drew F. K. Williamson, Tiffany Y . Chen, Jana Lipkova, Zahra Noor, Muhammad Shaban, Maha Shady, Mane Williams, Bumjin Joo, and Faisal Mahmood. Pan-cancer integrative histology-genomic analysis via multimodal deep learning.Cancer Cell, 40(8):865–878.e6, August 2022. ISSN 1535-6108. doi: 10.1016/j.ccell.2022.07.004
-
[2]
Song, Tong Ding, Sophia J
Anurag Vaidya, Andrew Zhang, Guillaume Jaume, Andrew H. Song, Tong Ding, Sophia J. Wagner, Ming Y . Lu, Paul Doucet, Harry Robertson, Cristina Almagro-Perez, Richard J. Chen, Dina ElHarouni, Georges Ayoub, Connor Bossi, Keith L. Ligon, Georg Gerber, Long Phi Le, and Faisal Mahmood. Molecular-driven Foundation Model for Oncologic Pathology, January
-
[3]
EXAONE Path 2.5: Pathology Foundation Model with Multi-Omics Alignment, December 2025
Juseung Yun, Sunwoo Yu, Sumin Ha, Jonghyun Kim, Janghyeon Lee, Jongseong Jang, and Soonyoung Lee. EXAONE Path 2.5: Pathology Foundation Model with Multi-Omics Alignment, December 2025. arXiv:2512.14019
-
[4]
Yingxue Xu, Yihui Wang, Fengtao Zhou, Jiabo Ma, Cheng Jin, Shu Yang, Jinbang Li, Zhengyu Zhang, Chenglong Zhao, Huajun Zhou, Zhenhui Li, Huangjing Lin, Xin Wang, Jiguang Wang, Anjia Han, Ronald Cheong Kin Chan, Li Liang, Xiuming Zhang, and Hao Chen. A multimodal knowledge-enhanced whole-slide pathology foundation model.Nature Communications, 16(1): 11406,...
-
[5]
Leveraging multi-modal foundation models for analysing spatial multi-omic and histopathology data
Tianyu Liu, Tinglin Huang, Tong Ding, Hao Wu, Peter Humphrey, Sudhir Perincheri, Kurt Schalper, Rex Ying, Hua Xu, James Zou, Faisal Mahmood, and Hongyu Zhao. Leveraging multi-modal foundation models for analysing spatial multi-omic and histopathology data. Nature Biomedical Engineering, pages 1–18, February 2026. ISSN 2157-846X. doi: 10.1038/ s41551-025-01602-6
2026
-
[6]
Frederick M. Howard, James Dolezal, Sara Kochanny, Jefree Schulte, Heather Chen, Lara Heij, Dezheng Huo, Rita Nanda, Olufunmilayo I. Olopade, Jakob N. Kather, Nicole Cipriani, Robert L. Grossman, and Alexander T. Pearson. The impact of site-specific digital histology signatures on deep learning model accuracy and bias.Nature Communications, 12(1):4423, Ju...
-
[7]
Do Histopathologi- cal Foundation Models Eliminate Batch Effects? A Comparative Study
Jonah Kömen, Hannah Marienwald, Jonas Dippel, and Julius Hense. Do Histopathologi- cal Foundation Models Eliminate Batch Effects? A Comparative Study. InAIM-FM Work- shop, Advances in Neural Information Processing Systems (NeurIPS). arXiv, November 2024. arXiv:2411.05489
-
[8]
de Jong, Eric Marcus, and Jonas Teuwen
Edwin D. de Jong, Eric Marcus, and Jonas Teuwen. Current Pathology Foundation Models are unrobust to Medical Center Differences, February 2025. arXiv:2501.18055
-
[9]
Jonah Kömen, Edwin D. de Jong, Julius Hense, Hannah Marienwald, Jonas Dippel, Philip Naumann, Eric Marcus, Lukas Ruff, Maximilian Alber, Jonas Teuwen, Frederick Klauschen, and Klaus-Robert Müller. Towards Robust Foundation Models for Digital Pathology, July 2025. arXiv:2507.17845
-
[10]
Gustafsson, Kajsa Ledesma Eriksson, and Mattias Rantalainen
Erik Thiringer, Fredrik K. Gustafsson, Kajsa Ledesma Eriksson, and Mattias Rantalainen. Scanner-Induced Domain Shifts Undermine the Robustness of Pathology Foundation Models, January 2026. arXiv:2601.04163. 10
-
[11]
Muhammad Dawood, Kim Branson, Sabine Tejpar, Nasir Rajpoot, and Fayyaz ul Amir Afsar Minhas. Confounding factors and biases abound when predicting molecular biomarkers from histological images.Nature Biomedical Engineering, pages 1–15, March 2026. ISSN 2157- 846X. doi: 10.1038/s41551-026-01616-8
-
[12]
Haotian Cui, Alejandro Tejada-Lapuerta, Maria Brbi´c, Julio Saez-Rodriguez, Simona Cristea, Hani Goodarzi, Mohammad Lotfollahi, Fabian J. Theis, and Bo Wang. Towards multimodal foundation models in molecular cell biology.Nature, 640(8059):623–633, April 2025. ISSN 1476-4687. doi: 10.1038/s41586-025-08710-y
-
[13]
Vanguri, Jia Luo, Andrew T
Rami S. Vanguri, Jia Luo, Andrew T. Aukerman, Jacklynn V . Egger, Christopher J. Fong, Natally Horvat, Andrew Pagano, Jose de Arimateia Batista Araujo-Filho, Luke Geneslaw, Hira Rizvi, Ramon Sosa, Kevin M. Boehm, Soo-Ryum Yang, Francis M. Bodd, Katia Ventura, Travis J. Hollmann, Michelle S. Ginsberg, Jianjiong Gao, Rami Vanguri, Matthew D. Hellmann, Jenni...
2022
-
[14]
Oz Kilim, Orsolya Pipek, Zsofia Sztupinszki, Miklos Diossy, Aurel Prosz, Cristina Naceur- Lombardelli, Selvaraju Veeriah, David Moore, Mariam Jamal-Hanjani, Allan Hackshaw, Janos Fillinger, Judit Moldvay, Istvan Csabai, Charles Swanton, and Zoltan Szallasi. A multimodal AI biomarker PATH-ORACLE improves prediction of recurrence in stage I lung adenocarcin...
-
[15]
Howard, Jakob Nikolas Kather, and Alexander T
Frederick M. Howard, Jakob Nikolas Kather, and Alexander T. Pearson. Multimodal deep learning: An improvement in prognostication or a reflection of batch effect?Cancer Cell, 41 (1):5–6, January 2023. ISSN 1535-6108, 1878-3686. doi: 10.1016/j.ccell.2022.10.025
-
[16]
Learning Transferable Visual Models From Natural Language Supervision
Alec Radford, Jong Wook Kim, Chris Hallacy, Aditya Ramesh, Gabriel Goh, Sandhini Agar- wal, Girish Sastry, Amanda Askell, Pamela Mishkin, Jack Clark, Gretchen Krueger, and Ilya Sutskever. Learning Transferable Visual Models From Natural Language Supervision. InPro- ceedings of the 38th International Conference on Machine Learning (ICML). arXiv, February
-
[17]
An Information Criterion for Controlled Disentanglement of Multimodal Data
Chenyu Wang, Sharut Gupta, Xinyi Zhang, Sana Tonekaboni, Stefanie Jegelka, Tommi Jaakkola, and Caroline Uhler. An Information Criterion for Controlled Disentanglement of Multimodal Data. InProceedings of the International Conference on Learning Representations. arXiv, March 2025. arXiv:2410.23996
-
[18]
Factorized Contrastive Learning: Going Beyond Multi-view Redundancy
Paul Pu Liang, Zihao Deng, Martin Ma, James Zou, Louis-Philippe Morency, and Ruslan Salakhutdinov. Factorized Contrastive Learning: Going Beyond Multi-view Redundancy. InAdvances in Neural Information Processing Systems (NeurIPS). arXiv, October 2023. arXiv:2306.05268
-
[19]
Canonical Correlation Analysis (CCA) Based Multi-View Learning: An Overview, May 2021
Chenfeng Guo and Dongrui Wu. Canonical Correlation Analysis (CCA) Based Multi-View Learning: An Overview, May 2021. arXiv:1907.01693
-
[20]
Eric F. Lock, Katherine A. Hoadley, J. S. Marron, and Andrew B. Nobel. Joint and individual variation explained (JIVE) for integrated analysis of multiple data types.The Annals of Applied Statistics, 7(1), March 2013. ISSN 1932-6157. doi: 10.1214/12-AOAS597
-
[21]
Tong Ding, Sophia J. Wagner, Andrew H. Song, Richard J. Chen, Ming Y . Lu, Andrew Zhang, Anurag J. Vaidya, Guillaume Jaume, Muhammad Shaban, Ahrong Kim, Drew F. K. Williamson, Harry Robertson, Bowen Chen, Cristina Almagro-Pérez, Paul Doucet, Sharifa Sahai, Chengkuan Chen, Christina S. Chen, Daisuke Komura, Akihiro Kawabe, Mieko Ochi, Shinya Sato, Tomoyuki...
-
[22]
Sun, Arijit Patra, Ioannis Kagiampakis, and Etai Jacob
Gustavo Arango-Argoty, Elly Kipkogei, Ross Stewart, Gerald J. Sun, Arijit Patra, Ioannis Kagiampakis, and Etai Jacob. Pretrained transformers applied to clinical studies improve predictions of treatment efficacy and associated biomarkers.Nature Communications, 16(1): 2101, March 2025. ISSN 2041-1723. doi: 10.1038/s41467-025-57181-2
-
[23]
Ming Y . Lu, Bowen Chen, Drew F. K. Williamson, Richard J. Chen, Ivy Liang, Tong Ding, Guillaume Jaume, Igor Odintsov, Long Phi Le, Georg Gerber, Anil V . Parwani, Andrew Zhang, and Faisal Mahmood. A visual-language foundation model for computational pathology.Nature Medicine, 30(3):863–874, March 2024. ISSN 1546-170X. doi: 10.1038/s41591-024-02856-4
-
[24]
Richard J. Chen, Tong Ding, Ming Y . Lu, Drew F. K. Williamson, Guillaume Jaume, Andrew H. Song, Bowen Chen, Andrew Zhang, Daniel Shao, Muhammad Shaban, Mane Williams, Lukas Oldenburg, Luca L. Weishaupt, Judy J. Wang, Anurag Vaidya, Long Phi Le, Georg Gerber, Sharifa Sahai, Walt Williams, and Faisal Mahmood. Towards a general-purpose foundation model for ...
-
[25]
H-optimus-0, 2024
Charlie Saillard, Rodolphe Jenatton, Felipe Llinares-López, Zelda Mariet, David Cahané, Eric Durand, and Jean-Philippe Vert. H-optimus-0, 2024. https://github.com/bioptimus/ releases/tree/main/models/h-optimus/v0
2024
-
[26]
Daniel Kaplan, Ratna Sagari Grandhi, Connor Lane, Benjamin Warner, Tanishq Mathew Abraham, and Paul S. Scotti. How to Train a State-of-the-Art Pathology Foundation Model with $1.6k, 2025. Sophont Blog,https://sophont.med/blog/openmidnight
2025
-
[27]
Training state-of-the-art pathology foundation models with orders of magnitude less data, April 2025
Mikhail Karasikov, Joost van Doorn, Nicolas Känzig, Melis Erdal Cesur, Hugo Mark Horlings, Robert Berke, Fei Tang, and Sebastian Otálora. Training state-of-the-art pathology foundation models with orders of magnitude less data, April 2025. arXiv:2504.05186
-
[28]
Guillaume Jaume, Lukas Oldenburg, Anurag Vaidya, Richard J. Chen, Drew F. K. Williamson, Thomas Peeters, Andrew H. Song, and Faisal Mahmood. Transcriptomics-guided Slide Repre- sentation Learning in Computational Pathology. InProceedings of the IEEE/CVF Conference on Computer Vision and Pattern Recognition (CVPR). arXiv, May 2024. arXiv:2405.11618
-
[29]
Tran, Yiwei Xiao, Shengyu Li, Vrutant V
Weiqing Chen, Pengzhi Zhang, Tu N. Tran, Yiwei Xiao, Shengyu Li, Vrutant V . Shah, Hao Cheng, Kristopher W. Brannan, Keith Youker, Li Lai, Longhou Fang, Yu Yang, Nhat-Tu Le, Jun-ichi Abe, Shu-Hsia Chen, Qin Ma, Ken Chen, Qianqian Song, John P. Cooke, and Guangyu Wang. A visual–omics foundation model to bridge histopathology with spatial transcriptomics.Na...
2025
-
[30]
The Conditional Entropy Bottleneck.Entropy, 22(9):999, September 2020
Ian Fischer. The Conditional Entropy Bottleneck.Entropy, 22(9):999, September 2020. ISSN 1099-4300. doi: 10.3390/e22090999
-
[31]
Disentanglement of Variations with Multimodal Generative Modeling, September 2025
Yijie Zhang, Yiyang Shen, and Weiran Wang. Disentanglement of Variations with Multimodal Generative Modeling, September 2025. arXiv:2509.23548
-
[32]
IndiSeek learns information-guided disentangled representations, December 2025
Yu Gui, Cong Ma, and Zongming Ma. IndiSeek learns information-guided disentangled representations, December 2025. arXiv:2509.21584
-
[33]
Learning Optimal Multimodal Infor- mation Bottleneck Representations
Qilong Wu, Yiyang Shao, Jun Wang, and Xiaobo Sun. Learning Optimal Multimodal Infor- mation Bottleneck Representations. InProceedings of the 42nd International Conference on Machine Learning. arXiv, May 2025. arXiv:2505.19996
-
[34]
Xinyi Zhang, G. V . Shivashankar, and Caroline Uhler. Partially shared multi-modal embedding learns holistic representation of cell state.Nature Computational Science, 6(3):285–300, March
-
[35]
doi: 10.1038/s43588-025-00948-w
ISSN 2662-8457. doi: 10.1038/s43588-025-00948-w
-
[36]
Theis, Srivatsan Raghavan, Pe- ter S
Till Richter, Eric Zimmermann, James Hall, Fabian J. Theis, Srivatsan Raghavan, Pe- ter S. Winter, Ava P. Amini, and Lorin Crawford. Beyond alignment: Synergistic inte- gration is required for multimodal cell foundation models, March 2026. bioRxiv preprint, doi:10.64898/2026.02.23.707420. 12
-
[37]
Challenging Common Assumptions in the Unsupervised Learning of Disentangled Representations
Francesco Locatello, Stefan Bauer, Mario Lucic, Gunnar Rätsch, Sylvain Gelly, Bernhard Schölkopf, and Olivier Bachem. Challenging Common Assumptions in the Unsupervised Learning of Disentangled Representations. InProceedings of the 36th International Conference on Machine Learning (ICML). arXiv, June 2019. arXiv:1811.12359
work page internal anchor Pith review Pith/arXiv arXiv 2019
-
[38]
Causal Structure and Representation Learning with Biomedical Applications, November 2025
Caroline Uhler and Jiaqi Zhang. Causal Structure and Representation Learning with Biomedical Applications, November 2025. arXiv:2511.04790. 13 Appendix A Additional Simulator Limitations The measurement model is linear (Appendix D.2), while real biological assays involve highly nonlinear transformations. This likely advantages linear models (CCA, JIVE) be...
-
[39]
Real assays involve nonlin- ear mixing, which the linear simulator does not capture
Observations are linear mixtures of latents plus Gaussian noise. Real assays involve nonlin- ear mixing, which the linear simulator does not capture
-
[40]
Real biology has complex dependencies and imposed independence is an optimistic assumption forz s/bseparation
Latents are independent Gaussians. Real biology has complex dependencies and imposed independence is an optimistic assumption forz s/bseparation
-
[41]
Real cohorts differ in scanner, protocol, and pre-processing and we do not model measurement-level shifts
Measurement matrices A∗, B∗ are fixed across cohorts. Real cohorts differ in scanner, protocol, and pre-processing and we do not model measurement-level shifts
-
[42]
Confounding is shared across modalities via a single latent b. Modality-specific artifacts uncorrelated with the shared batch axis are not modeled as a separate latent, though single- modality proxy ( γh >0, γ r = 0 ) captures a related mechanism. Such artifacts do not generate shared-looking signal and are therefore not the hardest failure mode for S1 mi...
-
[43]
Real biomarkers may be sparse, with phenotype depending on a low-dimensional mechanism embedded in a higher-dimensional latent space
Outcome weight vectors ¯w∗ are fixed across patients and dense (every latent dimension con- tributes). Real biomarkers may be sparse, with phenotype depending on a low-dimensional mechanism embedded in a higher-dimensional latent space
-
[44]
In practice, one modality may capture shared biology more reliably than the other
Modalities are treated as symmetric (similar SNR and contamination). In practice, one modality may capture shared biology more reliably than the other
-
[45]
In real data, additional unmeasured factors may influence both the outcome and the observed features
All outcome-relevant structure is encoded in (zs, zh, zr, b) with no unmodeled confounders. In real data, additional unmeasured factors may influence both the outcome and the observed features
-
[46]
In real data, different assays may sample different tissue regions or time points, introducing intratumor heterogeneity and sampling variation that the simulator does not model
All modalities observe the same patient’s latent state with perfect spatial and temporal correspondence. In real data, different assays may sample different tissue regions or time points, introducing intratumor heterogeneity and sampling variation that the simulator does not model. E Model Architectures and Training We evaluate four model classes spanning...
-
[47]
This step is identical to CCA, so JIVE’s joint component matches CCA’s shared representation exactly
Joint subspace:compute the SVD of the cross-covariance C=X ⊤ h Xr/(n−1) with the top K left and right singular vectors Wh, Wr defining the joint projection directions. This step is identical to CCA, so JIVE’s joint component matches CCA’s shared representation exactly
-
[48]
For evaluation cohorts, the encoder returns the concatenation [Z(h) joint |Z (h) indiv]∈R n×2K
Individual subspaces:project out the joint subspace from each modality ( Xres h =X h − XhWhW ⊤ h , analogously for r), then apply PCA to each residual to obtain K individual components per modality. For evaluation cohorts, the encoder returns the concatenation [Z(h) joint |Z (h) indiv]∈R n×2K. The first K dimensions are joint (shared) and the remaining K ...
-
[49]
Probe direction ˆw. From the logistic regression coefficients WLR of the selected probe and per-dimension standard deviationsˆσestimated on A′: ˆw= WLR/ˆσ ∥WLR/ˆσ∥2 .(23) Selection follows Stage III: shared-dominant leads to using probe on zc; modality-dominant leads to using probe on zms; indeterminate leads to using probe on zc (conservative fallback); ...
-
[50]
Each patient receives a scalar representing their posi- tion along the outcome-predictive direction
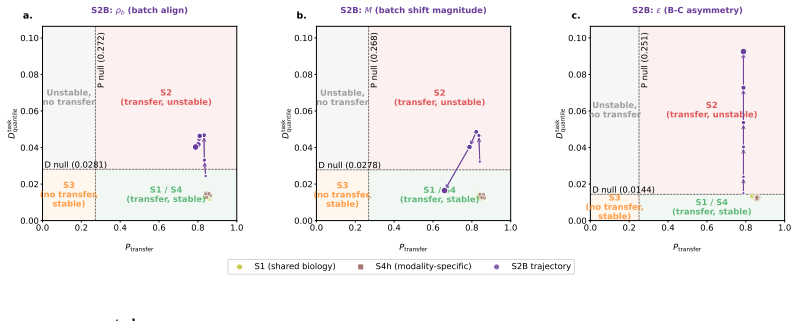
Scores.Project representations onto ˆwwithout per-cohort standardization: s(X) i = ⟨z(i,s) sig ,ˆw⟩for X∈ {A ′, B, C}. Each patient receives a scalar representing their posi- tion along the outcome-predictive direction. 3.A ′-referenced quantiles. q(X) i =F A′(s(X) i ) = |{j∈A ′ :s (A′) j ≤s (X) i }| |A′| , X∈ {B, C}.(24) A′ provides a fixed reference sca...
-
[51]
Dtask(s) quantile =W 1(QB, QC), where QX ={q (X) i }i∈X
Wasserstein-1 distance. Dtask(s) quantile =W 1(QB, QC), where QX ={q (X) i }i∈X. A large W1 indicates that the cohort shift moves patients differentially along the probe direction, suggesting composition-dependent ordering. Null calibration.A one-sided permutation null is estimated by shuffling B/C cohort labels (pre- serving sizes); the probe direction ˆ...
-
[52]
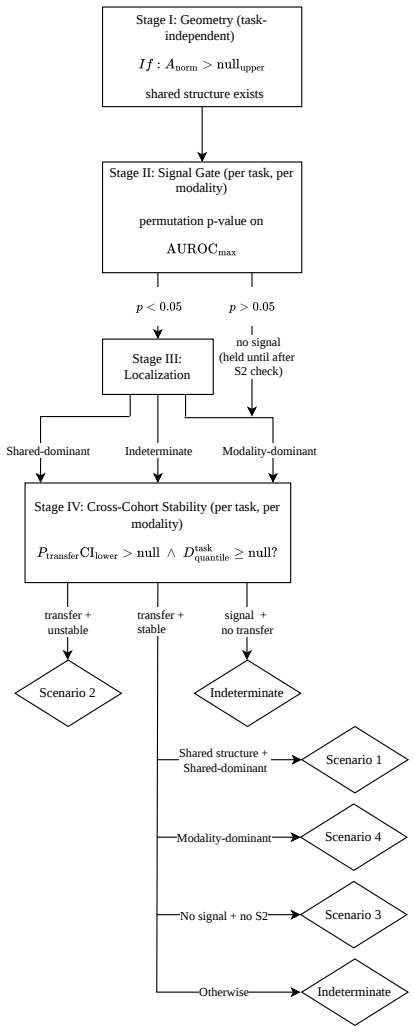
Scenario 2 (checked first).If CIlower(P (s) transfer)>null upper and Dtask(s) quantile ≥null upper, predic- tive signal transfers functionally but biological ordering is unstable across cohorts.Assign S2. 2.Scenario 1.If not S2,andA norm >null upper,andsignal-gatep <0.05,and(for factorized models) shared-dominant localization,and CIlower(P (s) transfer)>n...
-
[53]
4.Scenario 3.If signal-gatep≥0.05and Scenario 2 not assigned:Assign S3
Scenario 4.If not S2 or S1,andsignal-gate p <0.05 ,and(for factorized models) modality- dominant localization,and CIlower(P (s) transfer)>null upper,and Dtask(s) quantile <null upper:Assign S4. 4.Scenario 3.If signal-gatep≥0.05and Scenario 2 not assigned:Assign S3. 5.Indeterminate.Any case not matching the above:Assign∅. G.5 Cross-Modality Scenario Intera...
-
[54]
unimodal
Outcome-scenario evaluation(linear probes on Cohorts A ′, B, C across multiple outcome configurations). This separation enables evaluating many biological scenarios on a single frozen representation without retraining, improving computational efficiency. H.2 Representation-Generating Parameter Space Each synthetic run is defined by a joint configuration o...
2000
discussion (0)
Sign in with ORCID, Apple, or X to comment. Anyone can read and Pith papers without signing in.