CHEX-MATE: AMALGAM weak-lensing analysis of 41 Planck Sunyaev-Zel'dovich-selected galaxy clusters
Pith reviewed 2026-06-25 23:37 UTC · model grok-4.3
The pith
Weak-lensing analysis of 41 Planck SZ-selected clusters finds c200=3.53 at 10^15 solar masses and calibrates MSZ/M500 to 0.83 with 8% systematic uncertainty.
A machine-rendered reading of the paper's core claim, the machinery that carries it, and where it could break.
Core claim
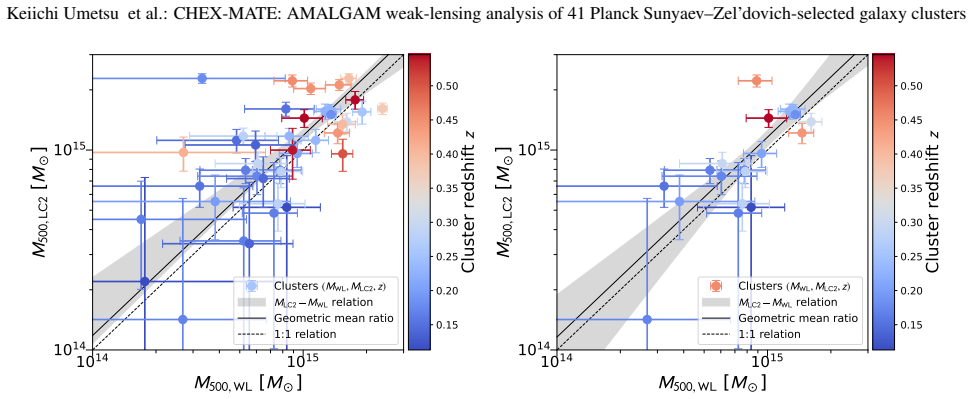
At M200=10^15 M_⊙ and z=0.25 the concentration is c200=3.53±0.71 with intrinsic scatter 0.22±0.04 dex, showing no significant mass or redshift dependence over the probed range and matching recent Lambda-CDM predictions. For the Planck SZ proxy the baseline relation gives MSZ/M500=0.83±0.09 at M500=7×10^14 M_⊙ and z=0.25 with intrinsic scatter 0.10±0.02 dex; a restricted model with fixed unit slope yields 1-b=0.72±0.11. The total systematic uncertainty on the weak-lensing mass calibration is assessed at 8%. Weak-lensing-calibrated posterior estimates of M500 are also provided for the sample.
What carries the argument
Navarro-Frenk-White profile fits to the excess surface mass density of each cluster, embedded in a hierarchical Bayesian regression that jointly accounts for sample selection, modeling biases, and residual calibration uncertainty when extracting the scaling relations.
If this is right
- The concentration-mass relation shows no significant mass or redshift dependence across the sampled range.
- A restricted model with fixed unit mass slope and no redshift evolution gives a hydrostatic bias factor of 1-b=0.72±0.11.
- Weak-lensing calibrated posterior estimates of M500 are supplied for each cluster in the sample.
- The derived relations supply an initial mass calibration for CHEX-MATE multi-probe cluster studies.
Where Pith is reading between the lines
- If the 8% systematic floor is dominated by shape measurement or photo-z errors rather than profile assumptions, repeating the analysis with deeper imaging or spectroscopic redshifts could tighten the calibration.
- The measured scatter values imply that additional baryonic contributions to mass variance are modest for these high-mass systems.
- Cross-matching the provided M500 posteriors with independent X-ray or SZ observables on the same clusters would test whether the reported scatter is intrinsic or partly residual calibration noise.
Load-bearing premise
The excess surface mass density profile of each cluster is accurately described by an NFW profile, and the hierarchical Bayesian framework fully accounts for sample selection effects, weak-lensing modelling biases, and residual calibration uncertainty when deriving the scaling relations.
What would settle it
An independent mass measurement of the same clusters (for example from X-ray hydrostatic equilibrium or strong lensing) that differs from the reported weak-lensing masses by more than 8% after known differences are subtracted would falsify the calibration.
Figures


read the original abstract
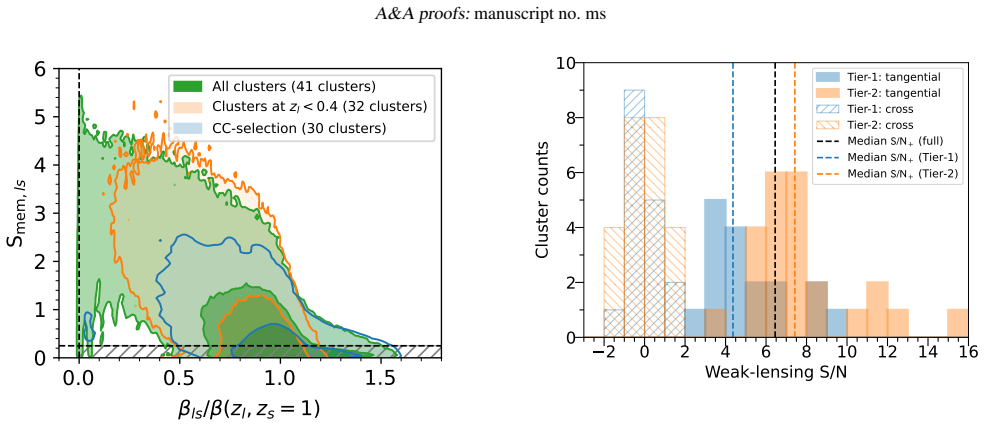
We present a weak-lensing shear analysis of 41 Planck SZ-selected galaxy clusters at $0.11\le z\le 0.55$ from the CHEX-MATE sample, using wide-field Subaru/Suprime-Cam and CFHT/MegaPrime imaging from the AMALGAM project. We detect the azimuthally averaged weak-lensing signal around the X-ray peak of each cluster, achieving a median S/N of 6.5 per cluster. The $45^\circ$-rotated component has a median S/N of -0.1 and ranges from -1.8 to +1.8, consistent with zero. We model the excess surface mass density profile of each cluster with an NFW profile to infer weak-lensing mass and concentration constraints. The total systematic uncertainty in the weak-lensing mass calibration is assessed to be $8\%$. Using a hierarchical Bayesian framework, we then derive weak-lensing-calibrated scaling relations for the halo concentration, $c_{200}$, as a function of $M_{200}$ and redshift, and for the Planck SZ mass proxy, $M_{SZ}$, as a function of $M_{500}$ and redshift, while accounting for sample selection effects, weak-lensing modelling biases, and residual calibration uncertainty. At $M_{200}=10^{15}M_\odot$ and $z=0.25$, we find $c_{200}=3.53\pm0.71$ with an intrinsic scatter of $0.22\pm0.04$ dex. The inferred normalisation and scatter are consistent with recent $\Lambda$CDM predictions for massive haloes, with no significant mass or redshift dependence over the probed range. For the Planck mass proxy, our baseline regression yields $M_{SZ}/M_{500}=0.83\pm0.09$ at $M_{500}=7\times10^{14}M_\odot$ and $z=0.25$, with an intrinsic scatter of $0.10\pm0.02$ dex. A restricted model with fixed unit mass slope and no redshift evolution gives $1-b=0.72\pm0.11$. We also provide weak-lensing-calibrated posterior estimates of $M_{500}$ for the sample based on the baseline $M_{SZ}$--$M_{500}$--$z$ relation. These results provide an initial weak-lensing mass calibration for CHEX-MATE multi-probe cluster studies.
Editorial analysis
A structured set of objections, weighed in public.
Referee Report
Summary. The paper presents a weak-lensing shear analysis of 41 Planck SZ-selected galaxy clusters (0.11 ≤ z ≤ 0.55) from the CHEX-MATE sample using Subaru/Suprime-Cam and CFHT/MegaPrime imaging. Azimuthally averaged excess surface mass density profiles centered on X-ray peaks are detected at median S/N = 6.5, with the 45°-rotated component consistent with zero. Each profile is modeled with an NFW form to obtain per-cluster mass and concentration constraints, with total systematic uncertainty assessed at 8%. A hierarchical Bayesian framework is then used to derive scaling relations for c200(M200, z) and MSZ/M500-z while accounting for selection effects, modeling biases, and calibration uncertainty, yielding c200 = 3.53 ± 0.71 (intrinsic scatter 0.22 ± 0.04 dex) at M200 = 10^15 M⊙, z = 0.25 and MSZ/M500 = 0.83 ± 0.09 (scatter 0.10 ± 0.02 dex) at M500 = 7 × 10^14 M⊙, z = 0.25; a restricted model gives 1-b = 0.72 ± 0.11. Weak-lensing-calibrated M500 posteriors are also provided.
Significance. If the central results hold, the work supplies an important weak-lensing mass calibration for the CHEX-MATE multi-probe program and a direct test of the concentration-mass relation and Planck SZ mass bias for massive clusters. The median S/N = 6.5 detection, null rotated-component test, explicit 8% systematic budget, and use of a hierarchical Bayesian model that incorporates selection and bias marginalization are strengths that would make the reported normalizations, slopes, and scatters useful benchmarks for ΛCDM predictions and future SZ surveys.
major comments (2)
- [Modeling of excess surface mass density profiles] Modeling section (NFW fits to excess surface mass density): The central claims for c200 and MSZ/M500 rest on fitting an NFW profile to the azimuthally averaged excess surface mass density of each cluster. The manuscript must demonstrate, via mocks or alternative profile fits, that deviations from NFW due to triaxiality, substructure, or miscentering (beyond the rotated-component test) do not bias the per-cluster M and c values at a level comparable to the quoted 8% systematic or the reported intrinsic scatters of 0.22 and 0.10 dex.
- [Hierarchical Bayesian regression] Hierarchical Bayesian regression section: The statement that the framework fully accounts for sample selection effects, weak-lensing modelling biases, and residual calibration uncertainty when deriving the scaling relations is load-bearing for the quoted normalizations (c200 = 3.53 ± 0.71 and MSZ/M500 = 0.83 ± 0.09) and scatters. Explicit validation (e.g., recovery tests on simulated catalogs with known input relations and realistic NFW deviations) is required to confirm that correlated biases in the input M and c estimates are not absorbed into the fitted parameters.
minor comments (2)
- [Abstract and regression description] The abstract and methods should clarify the exact parameterization of the hierarchical model (priors on slopes, redshift evolution terms, and how the 8% systematic is propagated) to allow readers to reproduce the baseline versus restricted-model results.
- [Results presentation] Figure captions and text should explicitly state the pivot masses and redshifts used for the quoted normalizations to avoid ambiguity when comparing to other works.
Simulated Author's Rebuttal
We thank the referee for the constructive and positive report. The comments highlight important aspects of robustness that we will address explicitly in revision. We respond point-by-point below.
read point-by-point responses
-
Referee: [Modeling of excess surface mass density profiles] Modeling section (NFW fits to excess surface mass density): The central claims for c200 and MSZ/M500 rest on fitting an NFW profile to the azimuthally averaged excess surface mass density of each cluster. The manuscript must demonstrate, via mocks or alternative profile fits, that deviations from NFW due to triaxiality, substructure, or miscentering (beyond the rotated-component test) do not bias the per-cluster M and c values at a level comparable to the quoted 8% systematic or the reported intrinsic scatters of 0.22 and 0.10 dex.
Authors: We agree that explicit demonstration via mocks is valuable for confirming that NFW deviations do not introduce biases comparable to the 8% systematic budget or the reported scatters. The manuscript already reports the rotated-component test (median S/N = -0.1, range -1.8 to +1.8) as evidence against significant azimuthal bias and incorporates an 8% systematic uncertainty that draws on literature estimates for triaxiality, substructure, and miscentering. To directly address the request, we will add mock-based validation tests in the revised manuscript showing that any residual biases remain within the quoted uncertainties. revision: yes
-
Referee: [Hierarchical Bayesian regression] Hierarchical Bayesian regression section: The statement that the framework fully accounts for sample selection effects, weak-lensing modelling biases, and residual calibration uncertainty when deriving the scaling relations is load-bearing for the quoted normalizations (c200 = 3.53 ± 0.71 and MSZ/M500 = 0.83 ± 0.09) and scatters. Explicit validation (e.g., recovery tests on simulated catalogs with known input relations and realistic NFW deviations) is required to confirm that correlated biases in the input M and c estimates are not absorbed into the fitted parameters.
Authors: The hierarchical Bayesian framework is constructed to marginalize over selection effects, weak-lensing modeling biases, and calibration uncertainties, as stated in the manuscript. We recognize that recovery tests on simulated catalogs would provide stronger confirmation that input relations are recovered without bias absorption. We will therefore include such explicit validation tests (incorporating realistic NFW deviations) in the revised manuscript. revision: yes
Circularity Check
No significant circularity; reported relations are explicit Bayesian fits to weak-lensing data.
full rationale
The paper fits NFW profiles to measured excess surface density profiles to obtain per-cluster M and c values, then feeds those into a hierarchical Bayesian regression that explicitly returns the quoted normalizations, slopes, and scatters for c200(M,z) and MSZ/M500(M,z). These outputs are data-driven parameter estimates, not predictions or derivations claimed to be independent of the input measurements. No self-citation load-bearing steps, self-definitional loops, or fitted-input-renamed-as-prediction patterns appear. The analysis compares its fitted values to external ΛCDM expectations but does not import them as inputs. The derivation chain is therefore self-contained.
Axiom & Free-Parameter Ledger
free parameters (3)
- normalization of c200-M200-z relation
- normalization of MSZ/M500-z relation
- intrinsic scatters
axioms (2)
- domain assumption NFW profile accurately describes the excess surface mass density of each cluster
- domain assumption Hierarchical Bayesian model fully corrects for selection effects, lensing biases, and calibration uncertainty
Reference graph
Works this paper leans on
-
[1]
2022, , 74, 175
Akino , D., Eckert , D., Okabe , N., et al. 2022, , 74, 175
2022
-
[2]
W., Evrard , A
Allen , S. W., Evrard , A. E., & Mantz , A. B. 2011, , 49, 409
2011
-
[3]
& Berg \'e , J
Andreon , S. & Berg \'e , J. 2012, , 547, A117
2012
-
[4]
E., von der Linden , A., Kelly , P
Applegate , D. E., von der Linden , A., Kelly , P. L., et al. 2014, , 439, 48
2014
-
[5]
2025, arXiv e-prints, arXiv:2509.02068
Aymerich , G., Grandis , S., Douspis , M., et al. 2025, arXiv e-prints, arXiv:2509.02068
arXiv 2025
-
[6]
A., Marshall , P., & Oguri , M
Baltz , E. A., Marshall , P., & Oguri , M. 2009, , 1, 15
2009
-
[7]
2023, , 674, A179
Bartalucci , I., Molendi , S., Rasia , E., et al. 2023, , 674, A179
2023
-
[8]
& Schneider , P
Bartelmann , M. & Schneider , P. 2001, , 340, 291
2001
-
[9]
2016, , 2016, 013
Battaglia , N., Leauthaud , A., Miyatake , H., et al. 2016, , 2016, 013
2016
-
[10]
Becker , M. R. & Kravtsov , A. V. 2011, , 740, 25
2011
-
[11]
C., Flynn , K., & Gebhardt , K
Beers , T. C., Flynn , K., & Gebhardt , K. 1990, , 100, 32
1990
-
[12]
2006, in Astronomical Society of the Pacific Conference Series, Vol
Bertin , E. 2006, in Astronomical Society of the Pacific Conference Series, Vol. 351, Astronomical Data Analysis Software and Systems XV, ed. C. Gabriel, C. Arviset, D. Ponz, & S. Enrique , 112
2006
-
[13]
2011, in Astronomical Society of the Pacific Conference Series, Vol
Bertin , E. 2011, in Astronomical Society of the Pacific Conference Series, Vol. 442, Astronomical Data Analysis Software and Systems XX, ed. I. N. Evans , A. Accomazzi , D. J. Mink , & A. H. Rots , 435
2011
-
[14]
& Arnouts , S
Bertin , E. & Arnouts , S. 1996, , 117, 393
1996
-
[15]
2002, in Astronomical Society of the Pacific Conference Series, Vol
Bertin , E., Mellier , Y., Radovich , M., et al. 2002, in Astronomical Society of the Pacific Conference Series, Vol. 281, Astronomical Data Analysis Software and Systems XI, ed. D. A. Bohlender , D. Durand , & T. H. Handley , 228
2002
-
[16]
2020, in Astronomical Society of the Pacific Conference Series, Vol
Bertin , E., Schefer , M., Apostolakos , N., et al. 2020, in Astronomical Society of the Pacific Conference Series, Vol. 527, Astronomical Data Analysis Software and Systems XXIX, ed. R. Pizzo , E. R. Deul , J. D. Mol , J. de Plaa , & H. Verkouter , 461
2020
-
[17]
2013, , 766, 32
Bhattacharya , S., Habib , S., Heitmann , K., & Vikhlinin , A. 2013, , 766, 32
2013
-
[18]
2013, , 558, A1
Biviano , A., Rosati , P., Balestra , I., et al. 2013, , 558, A1
2013
-
[19]
P., Schrabback , T., et al
Bocquet , S., Dietrich , J. P., Schrabback , T., et al. 2019, , 878, 55
2019
-
[20]
S., Kolatt , T
Bullock , J. S., Kolatt , T. S., Sigad , Y., et al. 2001, , 321, 559
2001
-
[21]
A., Gastaldello , F., Humphrey , P
Buote , D. A., Gastaldello , F., Humphrey , P. J., et al. 2007, , 664, 123
2007
-
[22]
2025, , 699, A141
Chappuis , L., Eckert , D., Sereno , M., et al. 2025, , 699, A141
2025
-
[23]
2021, , 650, A104
CHEX-MATE Collaboration , Arnaud , M., Ettori , S., et al. 2021, , 650, A104
2021
-
[24]
L., Habib , S., Heitmann , K., et al
Child , H. L., Habib , S., Heitmann , K., et al. 2018, , 859, 55
2018
-
[25]
N., Ghirardini , V., Liu , A., et al
Chiu , I. N., Ghirardini , V., Liu , A., et al. 2022, , 661, A11
2022
-
[26]
H., et al
Clowe , D., Brada c , M., Gonzalez , A. H., et al. 2006, , 648, L109
2006
-
[27]
A., Wyithe , J
Correa , C. A., Wyithe , J. S. B., Schaye , J., & Duffy , A. R. 2015, , 452, 1217
2015
-
[28]
2018, , 480, 2898
Cui , W., Knebe , A., Yepes , G., et al. 2018, , 480, 2898
2018
-
[29]
J., et al
Desai , S., Armstrong , R., Mohr , J. J., et al. 2012, , 757, 83
2012
-
[30]
2018, , 239, 35
Diemer , B. 2018, , 239, 35
2018
-
[31]
& Joyce , M
Diemer , B. & Joyce , M. 2019, , 871, 168
2019
-
[32]
& Kravtsov , A
Diemer , B. & Kravtsov , A. V. 2015, , 799, 108
2015
-
[33]
P., Bocquet , S., Schrabback , T., et al
Dietrich , J. P., Bocquet , S., Schrabback , T., et al. 2019, , 483, 2871
2019
-
[34]
M., Mahdavi , A., et al
Donahue , M., Voit , G. M., Mahdavi , A., et al. 2014, , 794, 136
2014
-
[35]
R., Schaye , J., Kay , S
Duffy , A. R., Schaye , J., Kay , S. T., & Dalla Vecchia , C. 2008, , 390, L64
2008
-
[36]
2011, , 526, A79
Eckert , D., Molendi , S., & Paltani , S. 2011, , 526, A79
2011
-
[37]
2010, , 524, A68
Ettori , S., Gastaldello , F., Leccardi , A., et al. 2010, , 524, A68
2010
-
[38]
Gavazzi, R. et al. 2026, AMALGAM: a large sample of galaxy clusters for weak lensing from pixels in multi-band images to galaxy photometry and shape , in preparation
2026
-
[39]
2026, , 710, A40
Gavidia , A., Kim , J., Sayers , J., et al. 2026, , 710, A40
2026
-
[40]
2024, , 687, A178
Grandis , S., Ghirardini , V., Bocquet , S., et al. 2024, , 687, A178
2024
-
[41]
R., Friedrich , O., & Mana , A
Gruen , D., Seitz , S., Becker , M. R., Friedrich , O., & Mana , A. 2015, , 449, 4264
2015
-
[42]
2014, , 442, 1507
Gruen , D., Seitz , S., Brimioulle , F., et al. 2014, , 442, 1507
2014
-
[43]
J., & Holder , G
Haiman , Z., Mohr , J. J., & Holder , G. P. 2001, , 553, 545
2001
-
[44]
A., Barnes , D
Henson , M. A., Barnes , D. J., Kay , S. T., McCarthy , I. G., & Schaye , J. 2017, , 465, 3361
2017
-
[45]
2020, , 497, 4684
Herbonnet , R., Sif \'o n , C., Hoekstra , H., et al. 2020, , 497, 4684
2020
-
[46]
2003, , 339, 1155
Hoekstra , H. 2003, , 339, 1155
2003
-
[47]
2015, , 449, 685
Hoekstra , H., Herbonnet , R., Muzzin , A., et al. 2015, , 449, 685
2015
-
[48]
A., et al
Ishiyama , T., Prada , F., Klypin , A. A., et al. 2021, , 506, 4210
2021
-
[49]
J., Rosati , P., Ford , H
Jee , M. J., Rosati , P., Ford , H. C., et al. 2009, , 704, 672
2009
-
[50]
& Squires , G
Kaiser , N. & Squires , G. 1993, , 404, 441
1993
-
[51]
Kelly , B. C. 2007, , 665, 1489
2007
-
[52]
Kravtsov , A. V. & Borgani , S. 2012, , 50, 353
2012
-
[53]
2022, arXiv e-prints, arXiv:2212.02428
K \"u mmel , M., \'A lvarez-Ayll \'o n , A., Bertin , E., et al. 2022, arXiv e-prints, arXiv:2212.02428
arXiv 2022
-
[54]
J., Ilbert , O., et al
Laigle , C., McCracken , H. J., Ilbert , O., et al. 2016, , 224, 24
2016
-
[55]
D., Bose , S., Angulo , R
Ludlow , A. D., Bose , S., Angulo , R. E., et al. 2016, , 460, 1214
2016
-
[56]
2015, , 450, 2963
Mandelbaum , R., Rowe , B., Armstrong , R., et al. 2015, , 450, 2963
2015
-
[57]
W., Rapetti , D., & Ebeling , H
Mantz , A., Allen , S. W., Rapetti , D., & Ebeling , H. 2010, , 406, 1759
2010
-
[58]
B., von der Linden , A., Allen , S
Mantz , A. B., von der Linden , A., Allen , S. W., et al. 2015, , 446, 2205
2015
-
[59]
G., Bird , S., Schaye , J., et al
McCarthy , I. G., Bird , S., Schaye , J., et al. 2018, , 476, 2999
2018
-
[60]
G., Schaye , J., Bird , S., & Le Brun , A
McCarthy , I. G., Schaye , J., Bird , S., & Le Brun , A. M. C. 2017, , 465, 2936
2017
-
[61]
2018 a , , 70, S28
Medezinski , E., Battaglia , N., Umetsu , K., et al. 2018 a , , 70, S28
2018
-
[62]
2011, , 414, 1840
Medezinski , E., Broadhurst , T., Umetsu , K., Ben \' tez , N., & Taylor , A. 2011, , 414, 1840
2011
-
[63]
2010, , 405, 257
Medezinski , E., Broadhurst , T., Umetsu , K., et al. 2010, , 405, 257
2010
-
[64]
J., et al
Medezinski , E., Oguri , M., Nishizawa , A. J., et al. 2018 b , , 70, 30
2018
-
[65]
2017, , 469, 4899
Melchior , P., Gruen , D., McClintock , T., et al. 2017, , 469, 4899
2017
-
[66]
2014, , 797, 34
Meneghetti , M., Rasia , E., Vega , J., et al. 2014, , 797, 34
2014
-
[67]
2015, , 806, 4
Merten , J., Meneghetti , M., Postman , M., et al. 2015, , 806, 4
2015
-
[68]
2018, , 70, S22
Miyaoka , K., Okabe , N., Kitaguchi , T., et al. 2018, , 70, S22
2018
-
[69]
2025, arXiv e-prints, arXiv:2505.07697
Miyatake , H. 2025, arXiv e-prints, arXiv:2505.07697
arXiv 2025
-
[70]
2019, , 875, 63
Miyatake , H., Battaglia , N., Hilton , M., et al. 2019, , 875, 63
2019
-
[71]
2023, , 108, 123517
Miyatake , H., Sugiyama , S., Takada , M., et al. 2023, , 108, 123517
2023
-
[72]
F., Frenk , C
Navarro , J. F., Frenk , C. S., & White , S. D. M. 1996, , 462, 563
1996
-
[73]
F., Frenk , C
Navarro , J. F., Frenk , C. S., & White , S. D. M. 1997, , 490, 493
1997
-
[74]
2015, , 67, 103
Niikura , H., Takada , M., Okabe , N., Martino , R., & Takahashi , R. 2015, , 67, 103
2015
-
[75]
& Hamana , T
Oguri , M. & Hamana , T. 2011, , 414, 1851
2011
-
[76]
& Takada , M
Oguri , M. & Takada , M. 2011, , 83, 023008
2011
-
[77]
H., Grandis , S., et al
Okabe , N., Reiprich , T. H., Grandis , S., et al. 2025, , 700, A46
2025
-
[78]
& Smith , G
Okabe , N. & Smith , G. P. 2016, , 461, 3794
2016
-
[79]
& Umetsu , K
Okabe , N. & Umetsu , K. 2008, , 60, 345
2008
-
[80]
2018, , 478, 1141
Okabe , T., Nishimichi , T., Oguri , M., et al. 2018, , 478, 1141
2018
discussion (0)
Sign in with ORCID, Apple, or X to comment. Anyone can read and Pith papers without signing in.